An official website of the United States government
An official website of the United States government
The .gov means it's official.
Federal government websites often end in .gov or .mil. Before sharing sensitive information,
make sure you're on a federal government site.
The site is secure.
The
https:// ensures that you are connecting to the official website and that any
information you provide is encrypted and transmitted securely.

Additional articles or information on homeownership are available online at the following links:
"Will the 2012 drought have a bigger impact on grocery prices than the 1988 drought?"
"Energy prices jump while food prices show modest increases"
In January 1913, when the U.S. Department of Labor was formed, the buffalo nickel would soon replace the Liberty Head nickel, women were protesting for the right to vote, and a family could buy a pound of potatoes for less than two cents. Fast forward 100 years to January 2013, when the U.S. Department of Labor is a century old, credit cards and online purchases are the more common forms of payment than the cash purchases of 1913, a record number of women are elected to Congress, and a pound of potatoes now costs 62 cents. These historic comparisons show how much has changed in the United States, and food prices have changed as well.
To examine prices over time, the U.S. Bureau of Labor Statistics (BLS) has Consumer Price Index (CPI) data going back to January 1913 and a few average prices going back to at least that far.1 This article summarizes some average food prices over the last century. Table 1 lists selected food average prices a century apart.
As many senior citizens will tell you, prices have increased quite a lot over the past century. Of the items listed, potatoes were the least expensive item in 1913, at less than 2 cents per pound. By 2013, flour had replaced potatoes as the cheapest item per pound among the items tracked. And while potatoes remain among the cheapest food items today, potato prices have increased over 39-fold since 1913, the sharpest rate of increase seen of the items tracked over the past century.
Of the items listed on a per pound basis, butter was the most expensive in 1913, selling for slightly more than 40 cents per pound. By 2013, prices for coffee, steak (round and sirloin), chuck roast, bacon, and cheese were all significantly higher than butter (using the January 2012 average price for butter because average price data for butter were not available for 2013).
Of the average price items listed, egg prices have increased the least, up about 5-fold in the last century, as advances in production, delivery, and storage techniques have outpaced those seen for most other food items.
| Item | Average price (dollars) | |
|---|---|---|
| January 1913 | January 2013 | |
Bread | $0.056 | $1.422 |
Flour | 0.033 | 0.524 |
Fresh milk, per gallon(1) | 0.089/quart (or 0.356/gallon) | 3.526 |
Cheese | 0.222 | 5.832 |
Butter(2) | 0.409 | 3.501 |
Coffee | 0.299 | 5.902 |
Potatoes | 0.016 | 0.627 |
Rice | 0.086 | 0.715 |
Sirloin steak | 0.238 | 5.705 |
Round steak | 0.205 | 5.074 |
Chuck roast | 0.149 | 3.696 |
Pork chops | 0.187 | 3.465 |
Bacon | 0.254 | 4.407 |
Ham | 0.251 | 2.693 |
Eggs, per dozen | 0.373 | 1.933 |
Sugar | 0.058 | 0.683 |
Footnotes: | ||
Note: All average prices are per pound, unless otherwise noted. Source: U.S. Bureau of Labor Statistics. | ||
A review of 1913 and 2013 BLS average price data also show that the eating habits of Americans have changed somewhat over the past century. For example, BLS no longer tracks what in 1913 were apparently more common food items, such as “hens,” “corn meal,” and “lard.”
Conversely, BLS publishes average prices for many items in 2013 that were not tracked in 1913, including potato chips, gasoline, cola, ground coffee, ice cream and yogurt. Potato chips were not mass-produced until early in the 20th century. Gasoline, ground coffee, and colas, each of which has been produced since the late 1800s, were not in wide use by 1913. And ice cream and yogurt, while around long before 1913, are also much more widely consumed today.
The BLS Consumer Price Index program plans to explore a century of price changes, in detail, in forthcoming Monthly Labor Review articles during 2013.
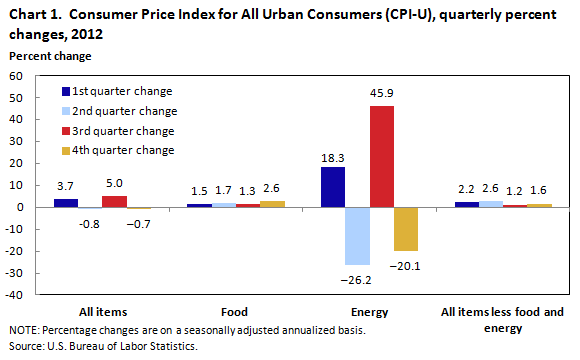
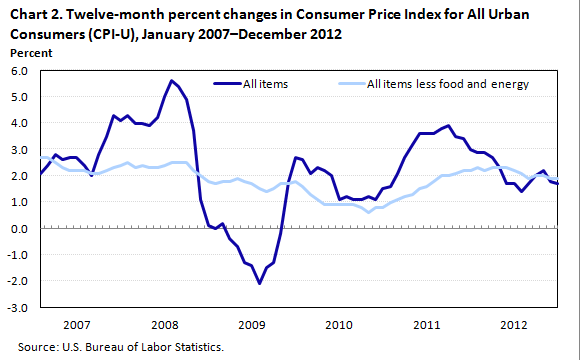
The U.S. all items Consumer Price Index for all Urban Consumers (CPI-U) decreased at a seasonally adjusted annualized rate of 0.7 percent during the fourth quarter of 2012. The fourth quarter drop follows a 5.0 percent increase in the third quarter, a 0.8 percent drop in the second quarter, and a 3.7 percent increase in the first quarter. For the year, the all items CPI-U rose 1.7 percent from December 2011 to December 2012. The 5-year annualized change in this index from December 2007 to December 2012 (not seasonally adjusted) was 1.8 percent.
The fourth-quarter decrease in the all items CPI-U is attributed largely to a sharp decrease in the energy index. The energy index decreased at a seasonally adjusted annualized rate of 20.1 percent during the fourth quarter. By contrast, the food index increased 2.6 percent on a seasonally adjusted annualized basis. Excluding food and energy, the CPI-U increased 1.6 percent during the fourth quarter of 2012 (see chart 1.)
Price movements in the energy index remained volatile during the last quarter of 2012. The energy index decreased 20.1 percent during the fourth quarter, following an increase of 45.9 percent in the third quarter of 2012. Annually, the index increased 0.5 percent from December 2011 to December 2012. The 5-year annualized change in the energy index from December 2007 to December 2012 was 1.4 percent.
The marked decrease in the energy index was due to the large fourth-quarter decrease in the index for gasoline, which decreased at a seasonally adjusted annualized rate of 34.7 percent. In contrast, three components of the energy index—fuel oil and other fuels, utility (piped) gas service, and electricity —increased at annualized rates of 6.5 percent, 10.1 percent, and 5.8 percent, respectively, during the fourth quarter of 2012. The increase in the index for fuel oil and other fuels followed an 18.2 percent increase in the third quarter, helping the index recover from a 13.4 percent drop in the first half of 2012. Similarly, the increase in the index for utility (piped) gas service came after a 20.0 percent increase in the third quarter, recovering from a 17.9 percent decline in the first half of the year. The increase in the index for electricity followed three straight quarters of small declines.
Changes in the energy index are explained chiefly by similar price movements in the gasoline index, which exhibited marked reversals in price movements between each quarter of 2012. Despite decreasing during the fourth quarter, the gasoline index increased 1.7 percent from December 2011 to December 2012. The 5-year annualized change in this index from December 2007 to December 2012 was 2.1 percent.
Increases in the food CPI-U rose to a seasonally adjusted annualized rate of 2.6 percent during the fourth quarter of 2012, after increasing at a seasonally adjusted annualized rate of 1.5 percent for the first 9 months of 2012. From December 2011 to December 2012, the index increased 1.8 percent. The 5-year annualized change in the food index from December 2007 to December 2012 was 2.6 percent.
The food at home component jumped in the fourth quarter to a seasonally adjusted annualized rate of 3.5 percent, after slight increases of 0.5 percent, 0.8 percent, and 0.2 percent in the first three quarters respectively. All six of the major item categories within the food at home index increased, led by a 7.9 percent increase in the index for dairy and related products, and a 5.6 percent increase in the index for fruits and vegetables. The indexes for cereal and bakery products and meats, poultry, fish, and eggs increased at more moderate paces of 3.6 percent and 3.0 percent, while the indexes for nonalcoholic beverages and beverage materials and other food at home increased at near equal rates of 1.8 percent and 1.7 percent.
Prices were up across the board within cereal and bakery products, led by a 9.8 percent increase in the index for white bread, with only a decrease of 1.8 percent in the price of cookies. The increase in prices for meats, poultry, fish, and eggs was led by an increase of 10.2 percent in the index for poultry, including an increase of 12.0 percent in the index for chicken. Within the dairy and related products index, the milk index jumped to 15.9 percent during the fourth quarter after a 2.2 percent increase in the third quarter and decreases in each of the first two quarters. The increase in the index for fruits and vegetables was led by a 52.8 percent increase in tomato prices and a 43.3 percent increase in the price of oranges.
The coffee index, which is a component of the nonalcoholic beverages and beverage materials index, increased 5.4 percent during the fourth quarter of 2012, after three straight quarterly declines. The inflation rates for peanut butter, within other food at home, moderated throughout the year, from a 50.6 percent increase in the first quarter, to 10.5 percent in the second quarter, 1.6 percent in the third quarter, and a decrease of 0.8 percent in the final quarter.
The increase in the food away from home index, slowed to 1.3 percent on an annualized basis during the fourth quarter of 2012, after three quarters of increases at more than double that rate. The 5-year annualized change in the food away from home index from December 2007 to December 2012 was 2.7 percent.
The all items less food and energy index increased at a seasonally adjusted annualized rate of 1.6 percent during the fourth quarter of 2012, an uptick from the 1.2 percent increase in the third quarter. After the 12-month change in this index reached a historic low of 0.6 percent in October 2010, the annual rate of change in the index inched up to 2.3 percent in the three months of March, April, and May 2012, but came down to 1.9 percent in December 2012. The 5-year trend from December 2007 to December 2012 for the index was 1.7 percent.
The housing index increased 2.6 percent on a seasonally adjusted annualized basis during the fourth quarter of 2012, with the shelter component increasing an annualized 2.3 percent over the same period.
The rent of primary residence index rose at a seasonally adjusted annualized rate of 3.2 percent in the fourth quarter, the same as in the third quarter, following an annualized increase of 2.2 percent during the first 6 months of the year. The tenants’ and household insurance index, accelerated during the last quarter of the year, increasing at an annualized rate of 7.3 percent; this rise follows a 0.9 percent increase in the third quarter and a 9-month annualized increase of 2.1 percent ending in September 2012.
Price movements in the owners’ equivalent rent of primary residence index slowed to a seasonally adjusted annualized increase of 2.2 percent during the fourth quarter of 2012, from 2.7 percent during the third quarter, remaining above the seasonally adjusted annualized rate of 2.1 percent for the first 9 months of the year.
In contrast to quarterly price increases in residential shelter components, the lodging away from home component of the shelter index decreased at a seasonally adjusted annualized rate of 5.4 percent during the fourth quarter of 2012. The index has now decreased for two consecutive quarters, following consecutive increases of 9.9 percent and 9.2 percent in the first two quarters.
The new and used motor vehicles index decreased 2.1 percent during the quarter on a seasonally adjusted annualized basis, despite a 16.4 percent increase in the car and truck rental index. The decrease was driven by a 6.7 percent decrease in the index for used cars and trucks. Airfare prices were up 21.5 percent over the quarter after declining 3.6 percent through the first 9 months of the year.
The medical care index increased at a seasonally adjusted annualized rate of 1.0 percent during the fourth quarter of 2012. The index for medical care commodities decreased 3.6 percent, but was offset by a 2.5 percent increase in medical care services. The increase in the prices of medical care commodities was due to a 3.2 percent decrease in prescription drugs prices. Year to year, the medical care index rose 3.2 percent from December 2011 to December 2012, and 3.2 percent, annualized, from December 2007 to December 2012.
The apparel index was unchanged over the last six months of 2012, decreasing 0.1 percent in the fourth quarter of 2012 after rising 0.1 percent in the third quarter. The men’s and women’s apparel prices were down 3.9 percent and 1.8 percent, respectively, over the fourth quarter, while boys’ and girls’ apparel prices were up 15.5 percent and 2.9 percent, respectively. Though women’s apparel prices were down, women’s outerwear prices jumped 28.3 percent in the quarter. Infants’ and toddlers’ apparel prices decreased 2.0 percent. The footwear index increased in each quarter of the year, hitting 5.0 percent during the fourth quarter. The jewelry and watches index decreased 5.0 percent following a 10.9 percent increase in the third quarter.
The recreation index decreased during the fourth quarter of 2012 at a seasonally adjusted annualized rate of 0.7 percent. Of note, however, is the continued double-digit declines in price movements of the televisions index, which decreased in every quarter, falling at a seasonally adjusted annualized rate of 11.9 percent in the fourth quarter. Annually, the televisions index decreased 17.5 percent from December 2011 to December 2012. The 5-year annualized decrease in the index from December 2007 to December 2012 was 20.2 percent.
Likewise, the index for personal computers and peripheral equipment, a component of the communication index, decreased 16.0 percent during the fourth quarter of 2012, after falling 13.2 percent in the third quarter. The index decreased by 8.7 percent from December 2011 to December 2012, whereas the 5-year annualized decrease from December 2007 to December 2012 was 10.1 percent. The decrease in prices of personal computers, as well as a 3.8 percent decrease in the index for telephone hardware, calculators, and other consumer information items, caused a 0.3 percent decrease in the communication index. Most other indexes within communication increased, including the index for computer software and accessories, which increased 5.7 percent after three straight quarterly declines of 10.4 percent, 9.2 percent, and 13.8 percent.
In contrast to the communication index, the education index increased 4.6 percent during the fourth quarter of 2012. In the aggregate, the education and communication index rose 2.0 percent over the quarter.
Quarterly increases in the other goods and services index slowed to a seasonally adjusted annualized rate of 0.3 percent during the fourth quarter of 2012, following a quarterly rise of 2.5 percent during the third quarter. Tobacco prices were up 1.8 percent, while the index for personal care decreased 0.2 percent.
The quarterly decrease of 0.7 percent in the all items index was due largely to a significant quarterly decrease in the energy index; excluding energy, the all items less energy index increased 1.7 percent during the fourth quarter, while the food index rose 2.6 percent.
Price movements described in this article reflect data released on January 16, 2013. All percent changes of 12 months or greater reflect data that are not seasonally adjusted. Data are annualized if the period covered is greater than a year. Percent changes covering less than a year are based on seasonally adjusted annual rates, unless otherwise noted. CPI seasonally adjusted indexes and percent changes are subject to annual revision. n
This Beyond the Numbers summary was prepared by Jonathan Church and Kenneth J. Stewart, economists in the Office of Prices and Living Conditions, U.S. Bureau of Labor Statistics. Email: church.jonathan@bls.gov. Telephone: (202) 691-5379.
Information in this article will be made available to sensory-impaired individuals upon request. Voice phone: (202) 691-5200. Federal Relay Service: 1-800-877-8339. This article is in the public domain and may be reproduced without permission.
Suggested citation:
Jonathan Church and Kenneth J. Stewart, “Average Food Prices: a snapshot of how much has changed over a century,” Beyond the Numbers: Prices and Spending, vol. 2, no. 06, (Bureau of Labor Statistics, February 2013), https://www.bls.gov/opub/btn/volume-2/average-food-prices:-a-snapshot-of-how-much-has-changed-over-a -century.pdf
This Beyond the Numbers summary was prepared by Jonathan Church and Kenneth J. Stewart, economists in the Office of Prices and Living Conditions, U.S. Bureau of Labor Statistics. Email: church.jonathan@bls.gov. Telephone: (202) 691-5379.
Information in this article will be made available to sensory-impaired individuals upon request. Voice phone: (202) 691-5200. Federal Relay Service: 1-800-877-8339. This article is in the public domain and may be reproduced without permission.
Jonathan Church and Ken Stewart, “Average Food Prices: a snapshot of how much has changed over a century,” Beyond the Numbers: Prices & Spending, vol. 2, no. 6 (U.S. Bureau of Labor Statistics, February 2013), https://www.bls.gov/opub/btn/volume-2/average-food-prices-a-snapshot-of-how-much-has-changed-over-a-century.htm
1 January 1913 average prices taken from U.S. Bureau of Labor Statistics, Retail Prices, 1913 to December 1921, Bulletin # 315, January 1923, Government Printing Office pages 86–96.
Publish Date: Tuesday, February 26, 2013