
An official website of the United States government
An official website of the United States government
The .gov means it's official.
Federal government websites often end in .gov or .mil. Before sharing sensitive information,
make sure you're on a federal government site.
The site is secure.
The
https:// ensures that you are connecting to the official website and that any
information you provide is encrypted and transmitted securely.

As Americans returned to their prepandemic spending patterns in the first half of 2022, they noticed one thing was not as it used to be: their grocery bills were much higher.1 Families paid more for food than they used to, and the increase was due to more than coronavirus disease 2019 (COVID-19) pandemic supply chain issues.2 Prices for raw grain crops were exceptionally high, and these elevated prices rippled through the economy and raised Americans’ grocery bills.3
U.S. grain prices rose dramatically in the years following the start of the COVID-19 pandemic.4 Domestic grain supplies were depleted by global issues that impacted both supply and demand since late 2020. These included “increased global demand, led by China; drought-reduced supplies; tightening wheat, corn, and soybean stocks in major exporting countries; high energy prices pushing up the costs of fertilizer, transportation, and agricultural production; and countries imposing export bans and restrictions, further tightening supplies.”5 In February 2022, the beginning of the Russia-Ukraine war further decreased global grain supplies, which increased demand for U.S. grains.6
An increase in grain prices typically leads to higher food prices charged by food producers at later stages of production, and eventually higher prices paid by consumers.7 Price increases ripple from grain crops to other farm products that depend on grains, and down the production line, diminishing in amplitude at each stage of production. As a result, food inflation can outpace inflation for other goods for both producer prices and consumer prices.
This Beyond the Numbers article discusses trends in grain prices and their ripple effects on food inflation from December 2019 through August 2022. We’ll also examine changes in food prices in the Producer Price Index (PPI), the Consumer Price Index (CPI), and in the Final Demand‐Intermediate Demand (FD-ID) system.
Producer prices for grains, as measured by the PPI, increased at a faster rate after the start of the COVID-19 pandemic than they had in prior years.8 (See chart 1.)
Global lockdowns for the COVID-19 pandemic began in January 2020. When workers were required to stay at home production chains halted, spending habits changed, and producers pivoted to meet the shifting demands of consumers.9
In the two years prior to the COVID-19 pandemic (December 2017 to December 2019), the PPI for grains increased 14.9 percent, and the aggregate PPI for farm products rose 3.6 percent. From the start of the global pandemic in December 2019 to February 2022, the PPI for grains jumped 73.5 percent, and the PPI for farm products advanced 38.8 percent.
The PPI for grains increased at a monthly average of 0.6 percent in the 2 years prior to the start of the COVID-19 pandemic. In the following two years, the PPI for grains increased at a rate three times faster (a monthly average of 2.5 percent).
The Russia-Ukraine war, which began on February 24, 2022, further impacted both the global supply and demand for grains.10 Ukraine and Russia produce a major share of the world’s grain supply, together accounting for over a quarter of global wheat production.11 The Russia-Ukraine war destroyed crop production, interrupted Ukrainian exports, and led to international sanctions. This reduced Russian exports and resulted in increased demand for U.S. grains.12
U.S. grain prices increased 24.1 percent during the first 4 months of the Russia-Ukraine war, compounding the effect of the global supply and demand issues that dated back to 2020. After increasing at a monthly average of 2.5 percent from the start of the COVID-19 pandemic to February 2022, the PPI for grains rose an average of 6.0 percent per month between February and June 2022. For comparison, the overall PPI for farm products increased 13.2 percent over the February to June 2022 period.
Grain prices suddenly showed signs of returning to prewar levels as the PPI for grains decreased 15 percent in July and August 2022, combined, as Ukraine and Russia reached an agreement to reopen Ukrainian ports to export grain products to bolster worldwide supplies.13 The PPI for farm products decreased 5.5 percent over the same period.
By August 2022, prices for grains and for farm products overall remained 5.5 percent and 6.9 percent higher, respectively, than their levels prior to the beginning of the Russia-Ukraine war in February 2022.
The PPI for grains is composed of commodity indexes for seven types of grain: oats, sorghum, wheat, corn, barley, rough (harvested but not hulled) rice, and rye (which did not publish during this period). The six available grains indexes are shown in chart 2.
Prior to the COVID-19 pandemic, each type of grain changed price at a relatively similar rate. By late 2020, there was wider price variation between the types of grain. Sorghum and corn experienced the first large upticks in price, peaking in May 2021. These two types of grain, used as animal feeds, faced high demand as China sought to rebuild its hog supply following an outbreak of African swine fever.14 The corn and sorghum price indexes have since fluctuated, and they remain at substantially higher levels than in December 2019.15 The overall grains index is largely driven by the price of corn, which composes 70 percent of the grains PPI.16
From the onset of the COVID-19 pandemic, oats, wheat, barley, and rough rice followed a different price pattern. These four grains had a slower and steadier rise in prices over the period. But the cumulative movement of these four grains over the period was similar to that of corn and sorghum. Prior to the beginning of the Russia-Ukraine war, oats had the largest increase in prices since the start of the COVID-19 pandemic, followed by sorghum, barley, wheat, corn, and rough rice, respectively.
During the first 4 months of the Russia-Ukraine war, all six of the PPIs for grains increased compared with their prewar levels. Wheat and corn, which are heavily supplied by Ukraine, experienced the largest price increases since the start of the war, increasing 25.7 percent and 24.8 percent, respectively, by June 2022.17 The PPI for sorghum increased 21.3 percent between February and June 2022, followed by rough rice at 8.3 percent, barley at 4.5 percent, and oats at 2.0 percent.
Substantial price decreases in July and August 2022 were spread across all six of the grains component indexes. The PPI for wheat decreased 24.9 percent in July and August 2022 combined. In fact, wheat prices in August were lower than they were prior to the beginning of the war (5.5 percent below the February 2022 level). Corn prices also fell in July and August 2022 (12.7 percent lower). However, these decreases were not enough to completely reverse the price increases since the start of the Russia-Ukraine war (8.9 percent higher than in February 2022).
Oats saw the largest price decline across July and August 2022, dropping 37.0 percent over the 2 months. This brought the PPI for oats far below its prewar level (35.7 percent lower than in February 2022).
Barley and sorghum also experienced price decreases in July and August 2022. The PPI for barley fell 16.8 percent over the 2 months, which was 13.0 percent lower than prior to the Russia-Ukraine war. The PPI for sorghum decreased 14.3 percent in July and August. But sorghum remained 4.0 percent higher than in February 2022.
In contrast, rough rice prices increased 6.7 percent in July and August 2022, leaving the PPI index 15.6 percent above its February 2022 level.
Grains are a major part of Americans’ grocery carts, but usually after they have undergone processing to become consumer food products. The PPI Final Demand‐Intermediate Demand (FD‐ID) aggregation system tracks the production flow between industries. The FD-ID system shows how a shock to the price of grains makes its way to Americans’ grocery bills. (See About the PPI FD-ID Stage-Based System of Intermediate Demand.)
Within the FD-ID production flow system of PPI, detailed price indexes are calculated for food inputs (as well as other types of products) consumed at each stage of the goods production process. Commodities such as grains may enter the goods production process at stage 1 and pass down the line in processed forms. Also, they may be sold directly to later-stage producers without prior processing. In the case of food inputs to goods producers as of December 2021, raw grains constituted 45.7 percent of total foods inputs to stage 1, 20.2 percent of foods inputs to stage 3, and 19.1 percent of foods inputs to stage 4. Grains were not included directly in stage 2, but their influence can be seen in the form of processed goods, such as flour and animal feeds.18
A price shock to grains can ripple through the stages of goods production. When a food producer pays more for their inputs to production, such as when prices for grains rise, these producers typically pass on some or all the price increases to their buyers. The extent of the price transmission from a grain price shock down the line of production often depends on the farm value of the output product. In other words, the more processes and ingredients involved in creating a food, the less its price depends on a single ingredient, such as grains.19 Therefore, the price shock diminishes in amplitude as grains pass through the production process.20 This can lead to higher prices for bread, pasta, and cooking oils, to name just a few products made from grains.
Other farm products can also fluctuate in price according to the price of grains, since grains are sometimes purchased as inputs as feed for animal farming. For example, the PPIs for soybean cake and meal and for formula feeds constitute 50.9 percent of stage 2 foods inputs to goods producers.21 When grain prices rise substantially, farmers have historically culled their herds to lower input costs (i.e., turning cattle into beef).22 This has downstream impacts on the supply and prices of beef, pork, poultry, eggs, and dairy products. Supplies of eggs and dairy products then become tighter, increasing prices. Supplies of beef, pork, and poultry may be in large supply in the short term. This increase in supply results in initially lower prices for meat. But the cost of replenishing herds has the opposite effect on prices in the longer-term.
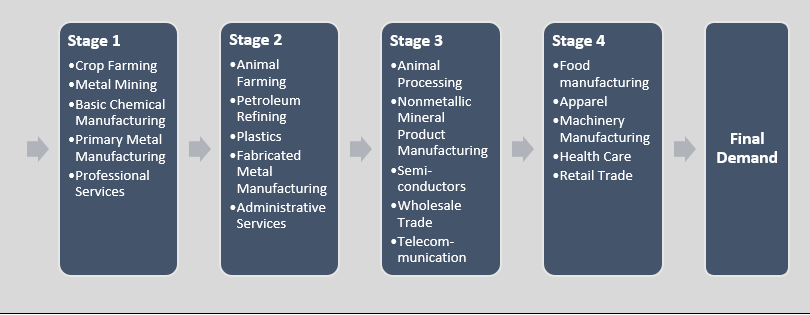
The production flow portion of the PPI Final Demand‐Intermediate Demand (FD‐ID) System measures changes in producer prices paid across four stages of intermediate demand (business to business sales) and for final demand. The system groups industries into each stage based on the flow of production across the economy, and it is the most rigorous and precise system within PPI for tracking price movements at earlier stages of the economy. The four intermediate demand stage-based index measures price changes for inputs purchased by industries included in each stage. For example, producers who sell most of their products to final demand (personal consumption, capital investment, government purchase, or export) are grouped into stage 4. The stage 4 intermediate demand index measures price changes for the inputs these producers typically purchase. Industries that sell most of their products to stage 4 industries are grouped into stage 3, and the stage 3 intermediate demand index measures price changes for the inputs they typically purchase. Conditions are similar for stages 2 and 1. In many cases, the same product is purchased by different buyer types, so products are often included in several intermediate demand stages.
For illustrative purposes, figure 1 below represents a simplified, hypothetical example of the production flow system from the four intermediate stages of production to the final demand stage. Each stage lists examples of industry sectors assigned to that stage. For example, industries listed under stage 4 represent industries that produce final demand outputs. Similarly, industries listed under stage 3 represent industries that primarily produce products consumed by stage 4.
The PPI stage-based system of intermediate demand uses this information to incorporate a second step where price movements for products of industries typically purchased by stage 4 (generally products from stage 3) are used to calculate the stage 4 intermediate demand indexes.
Similarly, the stage 3 intermediate demand indexes track prices paid by stage 3 producers for the goods, services, and maintenance and repair construction they typically buy (generally stage 2 outputs). The arrows in figure 1 below represent the outputs of earlier stages progressing as inputs to subsequent stages of production. The full list of stage assignments by industry can be found at PPI Updates Commodity Weight Allocations for Final Demand–Intermediate Demand Aggregation Structure.
The grain price shock compounded supply chain disruptions and other price inflation, such as for gasoline, which led to higher prices initially for food producers. These higher prices eventually reached food consumers.
Chart 3 illustrates price movements at each stage of demand for food items, from the beginning of goods production (stage 1) to final products (finished consumer foods). From the start of the COVID-19 pandemic to February 2022, food input prices rose at every stage of goods production, from 47.9 percent higher prices at stage 1 to 14.2 percent at finished consumer foods. Consumer prices for food and beverages, as measured by the Consumer Price Index for Urban Consumers (CPI-U), increased 12.3 percent over the period, as price increases seeped into Americans’ grocery bills.
In the first 4 months of the Russia-Ukraine war, food input prices continued to rise at every stage of goods production. Stage 3 input prices rose the most (17.2 percent higher through June 2022). This was followed by food input price rises at stage 1 (14.1 percent), stage 4 (10.8 percent), stage 2 (10.1 percent), and finished consumer foods (5.5 percent). Consumers paid 4.0 percent more for food and beverages in June 2022 than they did before the Russia-Ukraine war.23
The BLS Consumer Expenditure Survey reflects that spending on food at home also rose substantially over the period. After increasing at an average of 3.2 percent in the 2 years before the start of the COVID-19 pandemic, average annual consumer expenditures on food at home increased 6.3 percent in 2020 and 6.6 percent in 2021. Since the onset of the pandemic, home food expenses for consumers have a higher correlation with intermediate producer prices for foods than with the CPI-U for food and beverages (a correlation of 83.3 percent to 93.8 percent for PPI stages 1 through 4, compared with 76.4 percent for the CPI-U for food and beverages).
This is a reversal of spending patterns on food prior to the pandemic. From 2017 to 2019, the CPI-U for food and beverages had the highest correlation with expenditures on food at home, at 96.1 percent.24 During this period, the intermediate stages of food production had very low and even negative correlations with expenditures on food at home (between -15.5 percent and 33.2 percent). In other words, the CPI-U for food and beverages was a strong predictor of expenditures on food at home before the COVID-19 pandemic. But since the pandemic began, PPIs for intermediate demand are better predictors of food at home expenses.25
By autumn 2022, the large decrease in grain prices in July and August 2022 had not yet reached consumers.
Goods producers paid less for their food inputs in July and August 2022 than in the months prior, but they still paid more than before the Russia-Ukraine war. Prices for food inputs to stage 1 of goods production decreased 6.9 percent in July and August 2022 combined. The three consecutive latter stages of goods production saw food input costs decrease 4.3 percent, 7.1 percent, and 4.3 percent, respectively. In August 2022, the indexes for food inputs to goods production in the four stages of intermediate demand remained above their February 2022 levels (between 5.5 and 8.9 percent higher).
These input cost savings did not reach consumers by August 2022, as measured by the PPI for finished consumer foods and the CPI-U for food and beverages. In July and August 2022, the PPI for finished consumer foods increased 1.5 percent, 7.1 percent higher than in February 2022. The CPI-U for food and beverages increased 1.8 percent in July and August 2022. Since the beginning of the Russia-Ukraine war, the CPI-U for food and beverages was 5.9 percent above the levels of February 2022.
In total, consumers paid 18.9 percent more for food and beverages in August 2022 than they did in December 2019. Despite the sudden decline in grain prices in July and August 2022, goods producers still paid far more for food inputs in August 2022 than before the COVID-19 pandemic began. As anticipated, the largest increases were with stage 1, where food inputs were 57.3 percent higher than prior to the pandemic. For inputs to stage 4 goods producers, the advance was 37.1 percent.
In the 2 years before the COVID-19 pandemic, inflation for goods less food and energy had increased similarly to that of food. Yet, during the period from December 2019 to August 2022, prices for food outpaced prices for goods less food and energy as measured by both producer and consumer price indexes.
Chart 4 shows price inflation as measured by the PPI for final demand foods and for final demand goods less foods and energy. From December 2017 to January 2020, both indexes increased at a similar cumulative rate. After the start of the pandemic, price levels for final demand foods surpassed the PPI for final demand goods less foods and energy briefly in May 2020 and consistently from May 2021 to August 2022.
Chart 5 shows price inflation as measured by the CPI-U for food and beverages and for commodities less food and energy. The food and beverages index increased at a faster average monthly rate than the CPI-U for other non-food and non-energy goods starting in July 2018. After the start of the pandemic, the gap widened and the index for the food CPI-U remained at a higher level than the CPI-U for other goods less food and energy to August 2022.
Producer prices for grains increased dramatically after the start of the COVID-19 pandemic in January 2020. These grain prices increased at an even faster rate after the beginning of the Russia-Ukraine war in February 2022 disrupted both global grain supplies and demand. As a result, U.S. prices for grains that are heavily supplied by Ukraine, such as wheat and corn, rose substantially between February and June 2022.26
July and August 2022 brought some relief as grain prices reversed direction and decreased for the first time after the beginning of the Russia-Ukraine war. The PPIs for all six types of grain fell and returned some indexes, such as wheat, to below their prewar levels.
As raw grain prices rose over the 2.5-year period, U.S. producers increased prices throughout the various stages of production. Goods producers, especially those at the earliest stages, paid between 37.1 to 57.3 percent more for food inputs in August 2022 than they did in December 2019. At the end of the production line, consumers paid 18.9 percent more for food and beverages in August 2022 than they did 2.5 years earlier.
The grain price drops of July and August 2022 did not reverse the increased food expenses incurred by producers and consumers since the beginning of the Russia-Ukraine war or since the COVID-19 pandemic began. If falling grain prices are to drive down producer costs and consumer expenses, they still have a long way to go after August 2022.
Food inflation increased at a faster rate than inflation for final goods less food and energy, as measured by both producer prices and consumer prices. The Russia-Ukraine war exacerbated grain price inflation. In the months following the start of the war, food inflation increased at an even faster rate than it did during the previous two years.
Inflation experienced by consumers in the first half of 2022 was characterized by especially high food price inflation.27 While the impacts of the grain price shock, COVID-19 pandemic, and other price determinants are impossible to disentangle, these factors combine to create a unique inflationary environment, on which the PPI data can shed some light.28 It will be interesting to see how price movements for grains influence changes in producer costs and consumer expenses going forward.
This Beyond the Numbers article was prepared by Teresa Kroeger, an economist in the Office of Prices and Living Conditions, U.S. Bureau of Labor Statistics. Email: kroeger.teresa@bls.gov; telephone: (202) 691-7287. If you are deaf, hard of hearing, or have a speech disability, please dial 7-1-1 to access telecommunications relay services or the information voice phone at: (202) 691-5200. This article is in the public domain and may be reproduced without permission.
Teresa Kroeger, “High grain prices rippled throughout the economy,” Beyond the Numbers: Prices & Spending, vol. 12, no. 7 (U.S. Bureau of Labor Statistics, April 2023), https://www.bls.gov/opub/btn/volume-12/high-grain-prices-rippled-throughout-the-economy.htm
1 Rachel Wolfe and Sharon Terlep, “American consumers are shopping, traveling and working out like it’s 2019,” Wall Street Journal, May 4, 2022, https://www.wsj.com/articles/american-consumers-travel-gyms-shopping-11651673590?page=1.
2 Alexandre Tanzi, “Online U.S. inflation slows again, but groceries rise most of all,” Bloomberg, June 9, 2022, https://www.bloomberg.com/news/articles/2022-06-09/online-us-inflation-slows-again-but-groceries-rise-most-of-all?srnd=premium.
3 Susan Helper and Evan Soltas, “Why the pandemic has disrupted supply chains,” The White House, June 17, 2021, https://www.whitehouse.gov/cea/written-materials/2021/06/17/why-the-pandemic-has-disrupted-supply-chains/.
4 Jesse Newman and Patrick Thomas, “Recession fears, trade shifts whipsaw global grain markets,” Wall Street Journal, July 18, 2022, https://www.wsj.com/articles/recession-fears-trade-shifts-whipsaw-global-grain-markets-11658142001.
5 Newman and Thomas, 2022.
6 Roque Ruiz and Will Horner, “Ukraine is struggling to export its grain, and here’s why,” Wall Street Journal, June 5, 2022, https://www.wsj.com/articles/ukraine-is-struggling-to-export-its-grain-and-heres-why-11654421400?page=1.
7 Jerry Light and Thomas Shevlin, “The 1996 grain price shock: how did it affect food inflation?,” Monthly Labor Review (U.S. Bureau of Labor Statistics, August 1998), pp. 3-19, https://www.bls.gov/opub/mlr/1998/08/art1full.pdf.
8 All data in this article are not seasonally adjusted. Indexes are subject to revision for four months after their originally scheduled publication to incorporate late reports and corrections by survey respondents.
9 Helper and Soltas, 2021.
10 Jim Wiesemeyer, “Ukraine reports major drop in grain exports, Egypt refuses shipment of Ukrainian wheat,” Farm Journal, May 20, 2022, https://www.agweb.com/news/policy/politics/ukraine-reports-major-drop-grain-exports-egypt-refuses-shipment-ukrainian.
11 Tristan Bove, “‘It’s an almost grotesque situation.’ Nearly 25 million tons of grain are stuck in Ukraine, and the UN says it doesn’t know when it can be accessed,” Fortune, May 6, 2022, https://fortune.com/2022/05/06/un-warns-millions-tons-grain-stuck-ukraine-food-prices/.
12 Ana Swanson, “Ukraine invasion threatens global wheat supply,” New York Times, February 24, 2022, https://www.nytimes.com/2022/02/24/business/ukraine-russia-wheat-prices.html.
13 Natalia Zinets and Max Hunder, “Ukraine works to resume grain exports, flags Russian strikes as risk,” Reuters, July 24, 2022, https://www.reuters.com/world/europe/outraged-by-strike-odesa-ukraine-still-prepares-resume-grain-exports-2022-07-24/.
14 Yoonhee Macke, Foreign demand fuels U.S. corn and sorghum exports, (U.S. Department of Agriculture, June 2021), https://www.fas.usda.gov/data/foreign-demand-fuels-us-corn-and-sorghum-exports.
15 Keith Good, “Corn prices climb nearly 50% in 2021, as U.S. food makers contend with labor and ingredient shortages,” Farm Policy News, May 11, 2021, https://farmpolicynews.illinois.edu/2021/05/corn-prices-climb-nearly-50-in-2021-as-u-s-food-makers-contend-with-labor-and-ingredient-shortages/.
16 “Relative importance of commodities included in the producer price index, all levels, December 2021,” PPI Tables (U.S. Bureau of Labor Statistics, June 1, 2022), https://www.bls.gov/ppi/tables/home.htm. This document is found by selecting the XLSX link for the table titled “Commodities, all levels.”
17 Foreign Agricultural Service, Ukraine agricultural production and trade, (U.S. Department of Agriculture, March 2022), https://www.fas.usda.gov/sites/default/files/2022-03/Ukraine-Ag-Production-Trade.pdf.
18 “Relative importance of component series in the producer price Index for Intermediate demand by production flow, December 2021,” PPI Tables (U.S. Bureau of Labor Statistics, June 1, 2022), https://www.bls.gov/ppi/tables/home.htm. Readers can select the 2022 table titled “(IDPGROUPREL) Component series of intermediate demand by production flow relative importance tables” to obtain the relative weight of the grains index (PPI code 012) and the weight of total foods inputs to goods producers within each stage. The weight for the grains index within each stage is provided in the body of the table. Readers can scroll down to rows 4471 through 4621 for the weights of foods inputs to goods producers within each stage.
19 Light and Shevlin, 1998.
20 For more on this process, see Light and Shevlin, 1998.
21 “Relative importance of component series in the producer price index for intermediate demand by production flow, December 2021,” PPI Tables (U.S. Bureau of Labor Statistics, June 1, 2022), https://www.bls.gov/ppi/tables/home.htm. Rows 2551 through 2568 list the relevant information.
22 Light and Shevlin, 1998.
23 As measured by the CPI-U for food and beverages.
24 Consumer expenditures on foot at home rose 7.8 percent in 2017, a larger increase than in 2020 or 2021. This correlation analysis includes 2017 in the pre-pandemic period to compare the 2020 and 2021 changes with another large change pre-pandemic.
25 The PPI for finished consumer foods fell in-between these measures in both periods. From 2017 to 2019, it had a correlation of 67.2 percent with consumer expenditures on food at home. In 2020 and 2021, this correlation was 71.4 percent.
26 Foreign Agricultural Service, 2022.
27 Ana Swanson, “Food prices approach record highs, threatening the world’s poorest,” New York Times, February 3, 2022, https://www.nytimes.com/2022/02/03/business/economy/food-prices-inflation-world.html.
28 Lydia DePillis, “Is ‘greedflation’ rewriting economics, or do old rules still apply?,” New York Times, June 3, 2022, https://www.nytimes.com/2022/06/03/business/economy/price-gouging-inflation.html.
Publish Date: Wednesday, April 5, 2023