An official website of the United States government
An official website of the United States government
The .gov means it's official.
Federal government websites often end in .gov or .mil. Before sharing sensitive information,
make sure you're on a federal government site.
The site is secure.
The
https:// ensures that you are connecting to the official website and that any
information you provide is encrypted and transmitted securely.
More related articles and information on agricultural prices are available online at the following links:
In the summer of 2012, the United States experienced its worst drought since the 1980s.1 According to the U.S. Department of Agriculture (USDA), 80 percent of agricultural land in the United States experienced drought conditions in 2012. Extremely dry weather can lead to crop failure, which reduces supplies, and subsequently increases prices. This is important to consumers because higher crop prices typically lead to higher prices for groceries.
A previous Focus on Prices and Spending article examined the lag between an increase in agricultural prices and an increase in consumers’ grocery bills. The article found that changes in the Producer Price Index (PPI) for processed foods and feeds usually has an impact on the amount consumers pay for food at home 3 to 4 months later. However, periods of drought are considered unusual and may impose a different shock to our food costs, depending on the drought locations and severity.
According to the National Oceanic and Atmospheric Administration’s National Weather Service, the 2012 drought was similar to the 1988 drought, but was more widespread, affecting more states.2 Should the 2012 drought have a bigger impact on grocery prices than the 1988 drought?
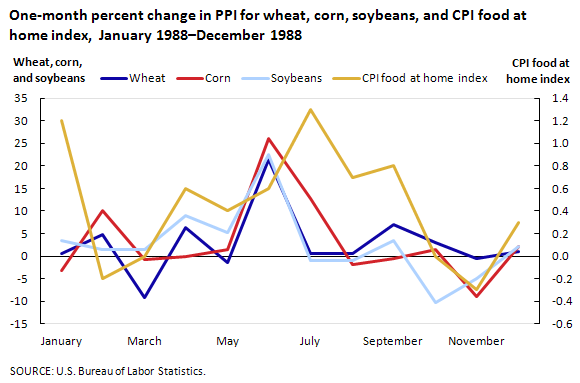
The June 1988 drought resulted in PPI increases of 21.3 percent for wheat, 26.0 percent for corn, and 22.5 percent for soybeans. The PPI for processed foods and feeds increased 2.1 percent in June, and in July, the CPI food at home index increased 1.3 percent—the largest monthly advances for both indexes that year. Charts 1 and 2 show how the drought in 1988 immediately caused a spike in prices for these major crops, and subsequently how much more consumers paid for food.
In July 2012, drought again caused a spike in the PPI for wheat (20.2 percent), corn (20.5 percent), and soybeans (13.0 percent). In August 2012, the processed foods and feeds index increased 1.1 percent—the largest rise since August 2011. In contrast, the CPI food at home index advanced only 0.2 percent, compared with the 1.3-percent increase that occurred in July 1988. (See charts 3 and 4.)
Though the 2012 drought appears more widespread than the 1988 drought, price movements in the indexes for PPI processed foods and feeds and for CPI food at home were not as volatile as they were in 1988. In 1988, processed foods and feeds prices increased immediately with the onset of the drought, but in 2012, there was a 1-month lag. In addition, prices for processed foods and feeds increased 2.1 percent from May 1988 to June 1988, compared with a 1.1-percent rise in prices from July 2012 to August 2012.
In 2012, consumers seem to be protected from extremely high prices because the farming sector is better equipped to withstand drought conditions. Agricultural productivity increased 50 percent between 1982 and 2012; from 1988 to 2012, farm income grew 147 percent, and crop insurance participation was up 60 percent.3 These factors have made farmers more resilient during times of drought and have reduced the amount of price inflation that a drought may cause.4
Although the monthly food price increases were not as severe in 2012 as they were in 1988, increases of over 20 percent for wheat and corn can seem quite alarming, especially considering that these commodities are the main ingredients in many popular food items. However, in order to put these price changes into perspective, an examination of the 12-month percent changes for these commodities is necessary.
From August 1987 to August 1988 prices of wheat increased 48.9 percent and corn prices jumped 90.9 percent. Between September 1987 and September 1988, soybean prices increased 67.4 percent. This means that the drought in 1988 significantly raised commodity prices. In the 2012 drought, the price of wheat increased 8.7 percent, the index for corn advanced 10.3 percent, and soybean prices rose 27.3 percent for the 12-months ended August 2012.
The 12-month percent changes were less extreme in 2012 than in 1988 because in 2012 the economy was experiencing very high commodity price levels just prior to the drought. Commodity prices were high in 2011 because of adverse weather conditions worldwide. Droughts in Russia, Ukraine, and Kazakhstan lowered the global supply of wheat.5 A La Niña weather pattern, characterized by unusually cold ocean temperatures (3-5 degrees Celsius lower than normal), prevailed in 2011 and affected crop yields in Argentina. 6, 7 La Niña also is blamed for Mexico’s crop freeze in 2011 and heavy rains in the United States that delayed planting for corn and soybean crops. Also in 2011, renewed income growth was increasing global food demand. This increase in demand, coupled with lower global supplies put upward pressure on prices of food commodities. These shocks increased prices of commodities well before the 2012 drought. Chart 5 shows that the historical average increase in consumer food prices was 3.0 percent between 2004 and 2011. The USDA forecasts that average annual food price inflation will remain at 3.0 percent in 2012 and inch up to 3.5 percent in 2013, which means that food price inflation should remain around its historical average, despite the 2012 drought.8
Although the summer 2012 drought was the worst since 1988, food price inflation had been relatively robust in the years leading up to 2012. As a result, grocery bills are forecast to be in line with average historical food price inflation. So, although there may have been more dry land and hardships for many farmers, consumers should not notice as severe an impact in their grocery bills as during the 1988 drought.
The PPI for finished goods increased 3.1 percent in the third quarter of 2012 after falling 1.1 percent for the 3 months ended in June.9 Most of this reversal can be attributed to prices for finished energy goods, which rose 10.9 percent for the 3 months ended in September following a 6.4-percent decrease in the preceding quarter. Also contributing to the turnaround, the indexes for finished consumer foods and for finished goods less foods and energy moved up at faster rates compared with the second quarter. At the earlier stages of processing, prices received by manufacturers of intermediate goods advanced 1.7 percent from June to September after declining 1.8 percent from March to June. As with finished goods, most of the upturn in prices for intermediate goods is attributable to the index for intermediate energy goods, which climbed 7.2 percent following a 6.2-percent drop in the second quarter. Prices for intermediate foods and feeds rose more in the third quarter than for the 3 months ended in June, while the intermediate core index fell at a slightly slower rate in the third quarter than in the previous quarter.10 Prices for crude materials for further processing increased 10.7 percent from June to September after decreasing 10.8 percent from March to June. Over half of this upturn was due to the crude energy materials index, which jumped 15.2 percent subsequent to a 16.5-percent decline in the second quarter. Prices for both crude foodstuffs and feedstuffs and for crude nonfood materials less energy also rose in the third quarter after falling in the prior quarter.
In the third quarter of 2012, higher prices for both crude petroleum and refined petroleum products led the upturn in producer inflation. Spot prices for West Texas Intermediate crude oil, which were nearly $110 per barrel in late February, dropped to roughly $77 by late June only to surge to nearly $100 in mid-September. Likewise, spot prices for New York Harbor Conventional gasoline dropped from $3.41 per gallon in early April to $2.44 on June 28, climbing back to $3.43 by mid-September.11 Domestic production of crude oil has expanded 11.6 percent in 2012, beginning the year at 5.844 million barrels per day (MBD) and ending the third quarter at 6.520 MBD.12 Total crude petroleum inputs to refineries, which include domestic production, as well as net imports and net changes in inventory, increased from 14.937 MBD at the start of the year to 15.796 MBD in mid-July. However, by late September crude oil inputs to refineries fell to 14.749 MBD, mostly due to declining imports. Net imports of crude oil, which mostly ranged from 8.5 to 9.5 MBD during the first half of 2012, dropped to as low as 8.1 MBD by the close of the third quarter. As a result, crude petroleum inventory decreased in the third quarter from particularly high levels earlier in the year.13
Paralleling the crude petroleum market, domestic production of finished motor gasoline grew in the first half of 2012, beginning the year at 8.739 MBD and peaking in early June at 9.551 MBD. However, by the close of the third quarter, domestic production of finished motor gasoline had fallen to 8.638 MBD. In addition, gasoline imports were down during much of the second and third quarters.14 As a result, stocks of finished motor gasoline, which began 2012 near the top of their 5-year historical range, declined in the second quarter to the lower end of their 5-year average range and remained at that level through the third quarter.15 A similar shift in inventory occurred for distillate fuel–heating oil and diesel fuel.16 Also impacting the petroleum market in the third quarter, hurricane Isaac threatened the U.S. Gulf Coast in late August, hindering production for a two-week stretch, while refinery and pipeline disruptions in California cut into inventory replenishment.17, 18 In terms of overall refinery capacity and utilization, operable capacity declined 2.9 percent from December 2011 to July 2012, while utilization of remaining capacity increased from 86.5 percent in December 2011 to 92.8 percent in July 2012.19
The PPI for finished goods turned up 3.1 percent for the 3-month period ended September 2012, subsequent to a 1.1-percent decline for the 3 months ended in June. Accounting for most of this turnaround, prices for finished energy goods jumped from June to September, after falling in the previous quarter. Also contributing to the rise in prices for finished goods, the indexes for both finished consumer foods and finished goods less foods and energy advanced more than they had in the 3 months ended in June. (See chart 6.)
From June to September, finished energy goods prices advanced 10.9 percent, compared with a 6.4-percent decline in the previous quarter. Prices for gasoline moved up 20.9 percent subsequent to a 9.0-percent decline in the second quarter. The indexes for liquefied petroleum gas, residential electric power, diesel fuel, and home heating oil also turned up in the third quarter of 2012. In contrast, prices for finished lubricants moved down 1.0 percent for the 3 months ended in September, after rising 0.7 percent in the prior quarter.
The index for finished consumer foods rose 1.6 percent in the third quarter after inching up 0.1 percent in the preceding quarter. Leading this acceleration, prices for dairy products turned up 7.3 percent from June to September after declining 1.7 percent for the 3 months ended in June. The indexes for soft drinks and grains also turned up after moving down in the previous 3 months. Prices for pork fell less than they had in the prior quarter. Conversely, the rise in the index for beef and veal slowed to 2.8 percent in the third quarter from 6.1 percent in the second quarter. Prices for prepared poultry declined in the third quarter after rising from March to June.
The index for finished goods less foods and energy advanced 0.7 percent for the 3-month period ended in September, following a 0.5-percent gain in the second quarter. From June to September, higher prices for light motor trucks, pharmaceutical preparations, cigarettes, alcoholic beverages, and passenger cars outweighed lower prices for electronic computers and commercial furniture.
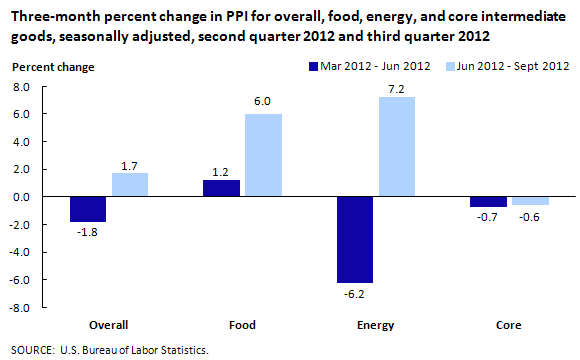
After falling 1.8 percent in the second quarter of 2012, the PPI for intermediate materials, supplies, and components increased 1.7 percent in the third quarter. Most of this upturn can be traced to prices for intermediate energy goods, which climbed from June to September following a drop for the 3 months ended in June. Contributing to lesser degrees, the index for intermediate foods and feeds moved up more in the 3 months ended in September than in the prior quarter and prices for intermediate goods other than foods and energy declined less than in the second quarter. (See chart 7.)
The index for intermediate energy goods rose 7.2 percent in the third quarter after falling 6.2 percent for the 3 months ended in June. Price movements for diesel fuel were a major factor in this reversal, surging 18.1 percent following a 14.3-percent drop in the preceding quarter. Prices for gasoline, jet fuel, lubricating oil base stocks, liquefied petroleum gas, and industrial electric power also turned up in the third quarter after decreasing in the second quarter. In contrast, the asphalt index declined 8.6 percent for the 3 months ended in September following a 5.5-percent increase in the previous quarter.
The index for intermediate foods and feeds climbed 6.0 percent for the 3 months ended in September after advancing 1.2 percent in the second quarter. About half of this acceleration can be traced to prices for prepared animal feeds, which jumped 15.5 percent following a 5.1-percent increase in the prior quarter. Prices for dairy products, processed eggs, and flour and flour-base mixes and doughs turned up in the third quarter. The index for pork products fell less than it did from March to June. In contrast, the index for beef and veal moved up 2.8 percent for the 3 months ended in September after rising 6.1 percent in the second quarter.
Following a 0.7-percent decline in the second quarter, the index for intermediate goods less foods and energy fell at a similar 0.6-percent rate for the 3 months ended in September. In the third quarter, lower prices for basic organic chemicals, steel mill products, plastic packaging products, synthetic rubber, and fabricated structural metal outweighed higher prices for drugs and pharmaceuticals as well as hardboard, particleboard, and fiberboard products.
The PPI for crude materials for further processing advanced 10.7 percent for the 3 months ended in September after falling 10.8 percent during the second quarter. The upturn in prices for crude materials was broad based as the indexes for crude energy materials, crude foodstuffs and feedstuffs and crude nonfood materials less energy all increased in the third quarter of 2012 following declines for the 3 months ended in June. (See chart 8.)
Prices for crude energy materials rose 15.2 percent from June to September compared with a 16.5-percent decrease in the prior 3-month period. Leading this upturn, the crude petroleum index climbed 21.2 percent in the third quarter after dropping 25.2 percent from March to June. Natural gas prices increased 12.7 percent, subsequent to a 2.9-percent decline for the 3 months ended in June. The coal index advanced 1.7 percent from June to September following a 0.9-percent gain in the second quarter.
The index for crude foodstuffs and feedstuffs moved up 11.8 percent in the third quarter after falling 7.0 percent from March to June. Prices for grains jumped 30.8 percent from June to September, subsequent to an 8.0-percent decrease in the previous quarter. The indexes for hay, hayseeds, and oilseeds, raw milk, slaughter steers and heifers, and slaughter chickens also turned up in the third quarter following declines in the previous 3-month period. In contrast, the index for slaughter hogs dropped 25.0 percent in the 3 months ended in September compared with a 2.4-percent gain from March to June.
Prices for crude nonfood materials less energy rose 2.6 percent for the 3 months ended in September, compared with a 6.9-percent decline in the preceding quarter. The index for nonferrous metals moved up 1.1 percent in the third quarter, subsequent to a 4.9-percent decrease in the 3 months ended in June. Similarly, prices for grains also advanced from June to September after moving down from March to June. The index for carbon steel scrap fell less in the third quarter, and prices for soybeans rose more than they had in the 3 months ended in June. Conversely, the index for wastepaper dropped 27.0 percent for the 3 months ended in September following a 5.4-percent decrease from March to June. Prices for raw cotton also fell more from June to September, compared with the prior quarter. The iron ores index declined in the third quarter after climbing in the 3 months ended in June, and prices for concrete ingredients and related products increased less than they had in the second quarter.
The Producer Price Index for the net output of total trade industries decreased 0.5 percent from June to September, after moving up 0.5 percent in the second quarter of 2012. (Trade industry PPIs measure changes in margins received by wholesalers and retailers.) For the 3 months ended in September, margins received by gasoline stations dropped 14.9 percent compared with a 12.7-percent increase from March to June. Indexes for clothing stores, fuel dealers, and electronics and appliance stores also turned down in the third quarter after rising in the previous 3-month period. Margins received by warehouse clubs and supercenters rose less from June to September than in the preceding quarter. In contrast, the margin index for wholesale trade industries turned up 1.3 percent subsequent to a 0.5-percent decline a quarter earlier.
The Producer Price Index for the net output of transportation and warehousing industries moved down 1.0 percent in the third quarter, subsequent to a 0.2-percent rise in the preceding 3-month period. For the 3 months ended in September, prices received by the scheduled air transportation industry group dropped 6.9 percent after advancing 0.2 percent in the second quarter. Similarly, the indexes for couriers and express delivery services and for line-haul railroads also turned down in the third quarter. Conversely, prices received by the truck transportation industry group increased 1.9 percent for the 3 months ended in September, compared with a 0.6-percent decline from March to June. The indexes for local specialized trucking of new goods, pipeline transportation of crude oil, and air transportation support activities also turned up from June to September.
The Producer Price index for the net output of total traditional service industries rose 0.4 percent for the 3 months ended in September, compared with a 0.3-percent advance in the previous quarter. From June to September higher prices received by portfolio managers, hospitals, and offices of certified public accountants outweighed decreases in the indexes for depository credit intermediaries, noncasino hotels and motels, and software publishers.
This Beyond the Numbers report was prepared by the Producer Price Index Staff, economists, in the Office of Prices and Living Conditions, Producer Price Index program. Email: ppi-info@bls.gov Telephone: 202-691-7705.
Information in this article will be made available to sensory-impaired individuals upon request. Voice phone: (202) 691-5200. Federal Relay Service: 1-800-877-8339. This article is in the public domain and may be reproduced without permission.
Producer Price Index program staff , “Will the 2012 drought have a bigger impact on grocery prices than the 1988 drought?” Beyond the Numbers: Prices & Spending, vol. 1, no. 18 (U.S. Bureau of Labor Statistics, November 2012), https://www.bls.gov/opub/btn/volume-1/will-the-2012-drought-have-a-bigger-impact-on-grocery-prices-than-the-1988-drought.htm
1 “U.S. Drought 2012: Farm and Food Impacts,” United States Department of Agriculture, September 25, 2012, www.ers.usda.gov/newsroom/us-drought-2012-farm-and-food-impacts.aspx.
2 “Drought 2012 vs. Drought 1988,” National Oceanic and Atmospheric Administration, National Weather Service, Wilmington, OH, July 8, 2012, www.erh.noaa.gov/iln/climo/summaries/1988_2012/1988_2012.php.
3 “Resilience of American Agriculture – Innovation, Diversity, and Growing Markets,” United States Department of Agriculture, as of October 2, 2012, www.usda.gov/documents/drought-infographic.pdf.
4 Ibid.
5 Amber Waves, “Why Another Food Commodity Price Spike?” United States Department of Agriculture, http://www.ers.usda.gov/amber-waves/2011-september/commodity-price-spike.aspx.
6 National Oceanic and Atmospheric Administration, National Weather Service: http://www.publicaffairs.noaa.gov/lanina.html.
7 Amber Waves, “Why Another Food Commodity Price Spike?”United States Department of Agriculture, http://www.ers.usda.gov/amber-waves/2011-september/commodity-price-spike.aspx.
8 “US Drought and Your Food Costs,” United States Department of Agriculture,” as of October 2, 2012, www.usda.gov/documents/drought-infographic-food-costs.pdf.
9 Price movements for PPIs described in this summary include preliminary data for June 2012 through September 2012. All PPI data are recalculated 4 months after original publication to reflect late data received from survey respondents. In addition, seasonally adjusted PPIs are recalculated on an annual basis for 5 years, to reflect more recent seasonal patterns.
10 Within the PPI stage-of-processing structure, the indexes for goods other than foods and energy commonly are referred to as the core indexes.
11 Weekly Petroleum Status Report, DOE/EIA-0208(2012-92), U.S. Energy Information Administration, (U.S. Department of Energy), October 11, 2012, Figure 7, page 24, http://www.eia.gov/pub/oil_gas/petroleum/data_publications/weekly_petroleum_status_report/historical/2012/2012_10_11/pdf/wpsrall.pdf.
12 The data that follow are from the database of the United States Department of Energy, Energy Information Administration (EIA). For crude oil domestic production figures, go to http://www.eia.gov/dnav/pet/pet_sum_sndw_dcus_nus_w.htm and select the “View History” option that corresponds with the “Domestic Production” entry. For total net inputs to refineries, select the “View History” option that corresponds with the “Crude Oil Inputs” entry. For weekly U.S. imports of crude oil, go to http://www.eia.gov/dnav/pet/pet_move_wkly_dc_NUS-Z00_mbblpd_w.htm and select the “View History” option that corresponds with the “Crude Oil” entry.
13 See note 11, Figure 1 on page 5.
14 To obtain data for finished motor gasoline production and for gasoline imports, link to the EIA Website at http://www.eia.gov/dnav/pet/pet_sum_sndw_dcus_nus_w.htm. For finished motor gasoline figures, select the “View History” option that corresponds with the “Finished Motor Gasoline” entry. For gasoline imports, select the “View History” option that corresponds with the “Imports, Total Motor Gasoline” entry.
15 See note 11, Figure 2 on page 7.
16 See note 11, Figure 3 on page 9.
17 See note 12 and extract data for “Crude Petroleum Inputs.”
18 Jim Carlton and Erica Orden, “California’s Gas Prices Expected to Ease,” The Wall Street Journal, section A, page 4, U.S. edition , October 9, 2012, on the Web at http://online.wsj.com/article/SB10000872396390444897304578044542000498504.html?KEYWORDS=petroleum+refinery+problems+california.
19 To obtain these data link to the EIA Website at http://www.eia.gov/dnav/pet/pet_pnp_unc_dcu_nus_m.htm and select the respective “View History” options for the “Operable Capacity (Calendar Day)” and “Operable Utilization Rate (%)” entries.
Publish Date: Tuesday, November 13, 2012