An official website of the United States government
An official website of the United States government
The .gov means it's official.
Federal government websites often end in .gov or .mil. Before sharing sensitive information,
make sure you're on a federal government site.
The site is secure.
The
https:// ensures that you are connecting to the official website and that any
information you provide is encrypted and transmitted securely.
More BLS articles and information related to consumer expenditures are available online at the following links:
Expenditures on travel for pleasure declined sharply in response to the recent recession, and had not yet fully recovered by 2011. In 2008, the first full year of the recent recession, consumers reported expenditures that were almost 3.5 percent lower than those reported in 2007. Reported expenditures declined another 9.8 percent in 2009, the year the recession officially ended.1 Although expenditures increased modestly (2.1 percent) in 2010, and more robustly (5.5 percent) in 2011, they were still lower than their 2007 peak. (See Table 1.)
Travel expenditures are important to the average consumer, and to the economy as a whole. For consumers reporting them, expenditures on travel for pleasure averaged $4,700 in 2011.2 This is 22 percent more than the average consumer unit3 spent on food at home that year ($3,838), and well over half of what the typical renter spent on housing that year ($8,548).4 At the same time, the leisure and hospitality industry accounted for about 10 percent of total employment each year between 2004 and 2011.5
As noted, the U.S. economy experienced a deep recession during this period, from which it has been slow to recover.6 In a period of high unemployment, it is reasonable to expect that many people who either become unemployed, or anticipate the prospect, will reduce their nonbusiness travel. If so, given the importance of leisure and hospitality in the U.S. economy, this reduction in travel spending could cause further economic contraction. Therefore, it is important to understand how consumer spending on nonbusiness travel changed both during and after the recession. To do so, this report examines data from the 2005 through 2011 Consumer Expenditure (CE) Quarterly Interview Surveys, which collected detailed information on travel expenditures from consumers across the United States.
How much consumers spent on travel. Starting at $1,293 in 2005, total travel expenditures peaked at $1,462 in 2007, then fell to a low of $1,273 in 2009. Although they rose again, to $1,372 in 2011, they were still down 6 percent from their peak. (See Table 1.) It is intriguing to note that the major components of travel expenditures—food and alcoholic beverages, transportation, lodging, and fees and admissions—follow patterns that are similar to one another. (See Chart 1.) However, most pronounced of these patterns is for transportation, which shows a parabolic pattern for the years before and during the recession ($538 in 2005; $643 in 2007; $543 in 2009), and a linear pattern afterward (rising to $570 in 2010, and to $603 in 2011).
| 2005 | 2006 | 2007 | 2008 | 2009 | 2010 | 2011 | |
|---|---|---|---|---|---|---|---|
|
Total trip spending |
$1,293 | $1,408 | $1,462 | $1,411 | $1,273 | $1,300 | $1,372 |
|
|
|||||||
|
Food and beverages |
320 | 329 | 332 | 327 | 313 | 309 | 329 |
|
Food prepared by consumer unit on out-of-town trips |
41 | 43 | 43 | 49 | 49 | 43 | 48 |
|
Food away from home |
236 | 243 | 246 | 238 | 223 | 223 | 236 |
|
Alcoholic beverages |
42 | 43 | 44 | 40 | 42 | 43 | 45 |
|
|
|||||||
|
Lodging |
294 | 321 | 343 | 329 | 300 | 299 | 315 |
|
|
|||||||
|
Transportation |
538 | 610 | 643 | 622 | 543 | 570 | 603 |
|
Airfare |
285 | 335 | 360 | 343 | 301 | 325 | 342 |
|
Train, bus, ship fare |
73 | 83 | 84 | 71 | 72 | 65 | 62 |
|
Car and truck rental |
27 | 28 | 28 | 27 | 25 | 26 | 23 |
|
Other vehicle rental |
(1) | (1) | (1) | (1) | (1) | (1) | (1) |
|
Local transportation (taxi, etc.) |
18 | 21 | 21 | 20 | 17 | 17 | 20 |
|
Gasoline and motor oil |
121 | 129 | 132 | 146 | 110 | 119 | 141 |
|
Parking fees and tolls |
10 | 10 | 10 | 10 | 11 | 11 | 10 |
|
Recreational vehicles |
4 | 5 | 7 | 4 | 6 | 7 | 5 |
|
|
|||||||
|
Fees and admissions |
141 | 148 | 145 | 134 | 116 | 122 | 125 |
|
Footnotes: |
|||||||
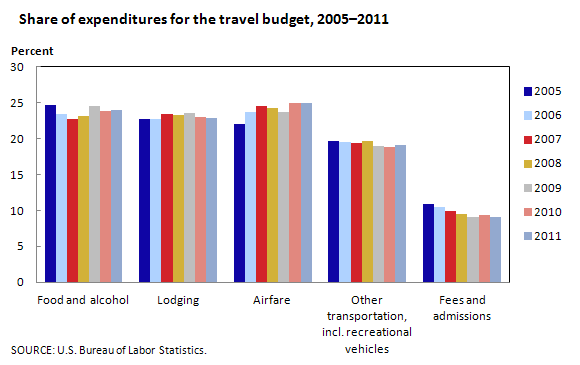
Allocating the travel dollar. Notably, while the level of travel dollars fluctuates during the 2005–2011 period, the allocation of those dollars is fairly stable. For example, lodging accounts for 23 to 24 percent, with transportation other than airline fares ranging between 18 and 19 percent. Airline fares account for between 24 and 25 percent of total travel expenditures for each year except 2005 (22 percent). Only fees and admissions exhibit a change in a consistent direction, falling from nearly 11 percent of travel expenditures to 9 percent from 2009 through 2011. (See Chart 2.)
The food and alcohol budget is particularly interesting to examine. Although stable in the aggregate, accounting for nearly one-fourth of all travel dollars each year, the composition of these expenditures change. While the share of expenditures allocated to alcoholic beverages is between 12 and 14 percent each year, the proportion allocated to food prepared by consumer unit on out-of-town trips—for example, food purchased at grocery stores—rises from less than 13 percent in 2005 to nearly 16 percent in 2009, with the share allocated to food away from home—that is, food at restaurants—declining from 74 percent to 71 percent in the same time period. (See Chart 3.) Consumers may have substituted grocery store spending for restaurant spending by purchasing more from grocery stores than restaurants.
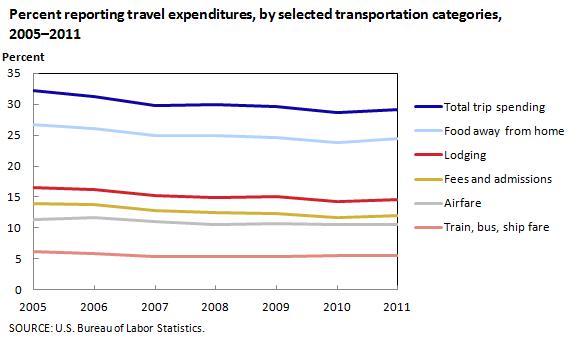
A closer look at consumers who travelled. An important item to consider is that the expenditures described so far represent the average for all consumer units, whether or not they travelled. To get a better idea of whether changes observed in expenditures reflect a change in travel patterns, as opposed to a change in something else (such as prices for travel), the percentage of consumers who reported spending money on travel is useful. The percent reporting any travel expenditure declined from 32 percent in 2005 to 30 percent in 2007, where it remained until 2009. Thereafter, it fell again, to 29 percent in 2010 and in 2011. (See Table 2.) Although a 3 percentage-point drop may not seem substantial, consider that this means that total numbers of consumer units travelling dropped by about 10 percent (3 out of 32 percent) during this period. It should be noted that the major components of travel show a similar pattern to total travel expenditures. (See Chart 4.) This indicates that travel in all forms is down equally. If one mode (for example, airline fares) had fallen much more sharply than another (for example, train, bus, or ship fares), this might indicate substitution of one mode of travel for the other.
| 2005 | 2006 | 2007 | 2008 | 2009 | 2010 | 2011 | |
|---|---|---|---|---|---|---|---|
|
Total trip spending |
32.2 | 31.3 | 29.8 | 29.9 | 29.7 | 28.7 | 29.2 |
|
|
|||||||
|
Food prepared by consumer unit on out-of-town trips |
11.3 | 10.9 | 10.5 | 11.2 | 10.9 | 10.1 | 10.6 |
|
Food away from home |
26.7 | 26.1 | 24.9 | 24.9 | 24.7 | 23.7 | 24.4 |
|
Alcoholic beverages |
13.2 | 13.1 | 12.3 | 12.4 | 12.5 | 12.1 | 12.9 |
|
|
|||||||
|
Lodging |
16.6 | 16.2 | 15.2 | 15.0 | 15.1 | 14.3 | 14.6 |
|
|
|||||||
|
Airfare |
11.3 | 11.7 | 11 | 10.6 | 10.7 | 10.6 | 10.6 |
|
Train, bus, ship fare |
6.2 | 5.9 | 5.4 | 5.4 | 5.4 | 5.5 | 5.5 |
|
Car and truck rental |
2.6 | 2.5 | 2.4 | 2.2 | 2.1 | 2.1 | 1.9 |
|
Other vehicle rental |
(1) | (1) | (1) | (1) | (1) | (1) | (1) |
|
Local transport (taxi, etc.) |
6.0 | 6.0 | 5.4 | 5.2 | 5.3 | 5.0 | 5.5 |
|
Gasoline and motor oil |
23.5 | 22.3 | 21.1 | 21.1 | 20.8 | 19.9 | 20.7 |
|
Parking fees and tolls |
10.2 | 10.0 | 9.0 | 8.6 | 9.2 | 8.4 | 9.0 |
|
Recreational vehicles |
0.4 | 0.4 | 0.5 | 0.4 | 0.5 | 0.5 | 0.5 |
|
|
|||||||
|
Fees and admissions |
13.9 | 13.8 | 12.8 | 12.4 | 12.2 | 11.6 | 12.0 |
|
Footnotes: |
|||||||
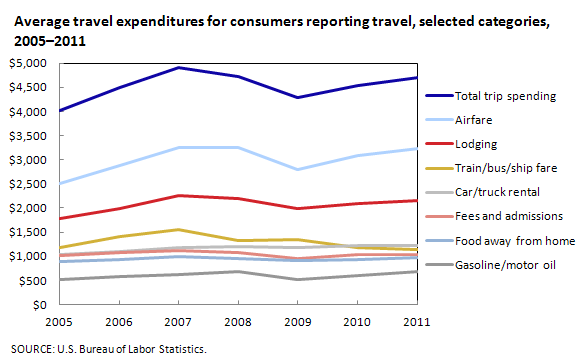
In addition, percent reporting is important because it allows one to examine expenditures for those who actually incurred them. For example, dividing average travel expenditures for all consumer units by percent reporting provides the average expenditure for those who actually travelled. Among travelers, expenditures rose nearly 20 percent—from $4,010 to $4,904—between 2005 and 2007. They fell nearly as quickly—to less than $4,300—by 2009, but started to recover thereafter. (See Chart 5.) No single expenditure appears to account for this, although airfares exhibit a similar pattern, as do lodging away from home, gasoline and motor oil expenditures, and to a lesser extent, fees and admissions and food away from home. Caution must be used in interpreting these figures, however, because the percent reporting only applies to the item in question. Therefore, means for similar categories (for example, food purchased by consumer unit on out-of-town trip, food away from home, and alcoholic beverages) cannot be added to get an average spent by those reporting.
Price change or quantity change? An expenditure consists of two components: price per unit and quantity purchased. Because of this, a change in dollars spent may not indicate a similar change in quantity purchased. For example, if prices rise sufficiently, expenditures will rise, even if quantity purchased stays the same or even falls. Therefore, as with percent reporting, it is useful to examine expenditures after adjusting for price change—that is, to examine expenditures in "real dollars." The Consumer Price Index (CPI), also published by the Bureau of Labor Statistics, is used to make these adjustments.7
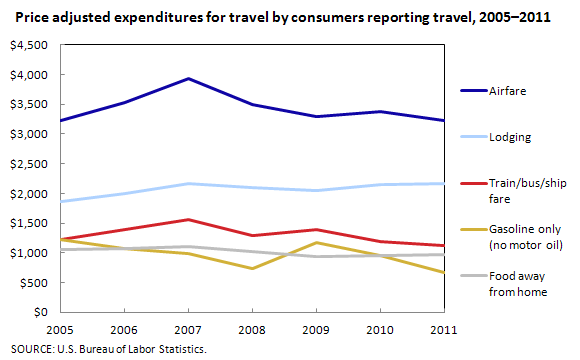
Chart 6 combines the percent-reporting and price-adjustment methods by showing selected expenditures, adjusted for price change, for those who reported these expenditures. Taken together, the data tell an interesting story. With the exception of gasoline, all expenditures shown (airfares, lodging away from home, train, bus, and ship fares, and food away from home) rise from 2005 to 2007, and dip to lower levels thereafter. Because these data are price adjusted, and for travel expenditure reporters only, they suggest that those who traveled took more trips each year from 2005 to 2007, and then fewer each year thereafter. For example, the airfares trend line is consistent with purchasers taking more flights each year from 2005 to 2007, and returning to 2005 numbers thereafter. Note that train, bus, and ship fares follow a similar pattern to airfares, but gasoline expenditures decline sharply each year up to, and especially in, 2008. Therefore, travelers may have been substituting flights or other modes of transportation for driving, consistent with a large increase in gasoline prices from 2005 through 2007—about 10 percent each year on average— a figure that was surpassed in 2008, when prices rose nearly 17 percent.8 If this theory is correct, the lodging trend line may not indicate that the number of trips increased, but that travelers took longer vacations in 2007 than in prior or subsequent years. The food away from home line is also consistent with both explanations—more trips or longer stays would each explain why these expenditures peak for consumers who reported in 2007.
For reference, the figures presented in Chart 6 are also included in Table 3. However, components of major expenditure categories (that is, food from grocery stores, food from restaurants, and alcoholic beverages) cannot be aggregated to compute price-adjusted expenditures for the aggregate category, because data presented are for expenditure reporters only.
| 2005 | 2006 | 2007 | 2008 | 2009 | 2010 | 2011 | |
|---|---|---|---|---|---|---|---|
|
Food and alcoholic beverages |
(1) | (1) | (1) | (1) | (1) | (1) | (1) |
|
Food prepared by consumer unit on out-of-town trips |
436 | 463 | 459 | 462 | 468 | 451 | 449 |
|
Food away from home |
1,061 | 1,079 | 1,104 | 1,023 | 936 | 962 | 968 |
|
Alcoholic beverages |
391 | 392 | 401 | 350 | 351 | 364 | 347 |
|
|
|||||||
|
Lodging |
1,858 | 1,996 | 2,159 | 2,095 | 2,046 | 2,141 | 2,158 |
|
|
|||||||
|
Transportation (selected items) |
(1) | (1) | (1) | (1) | (1) | (1) | (1) |
|
Airfare |
3,232 | 3,530 | 3,934 | 3,502 | 3,299 | 3,368 | 3,230 |
|
Train, bus, ship fare |
1,230 | 1,391 | 1,553 | 1,288 | 1,388 | 1,194 | 1,130 |
|
Car and truck rental |
1,196 | 1,245 | 1,292 | 1,267 | 1,148 | 1,221 | 1,223 |
|
Local transport (taxi, etc.) |
372 | 420 | 468 | 428 | 351 | 351 | 360 |
|
Gasoline |
1,229 | 1,079 | 994 | 744 | 1,168 | 948 | 673 |
|
Motor oil |
17 | 14 | 13 | 9 | 7 | 7 | 7 |
|
Footnotes: |
|||||||
Vacation home ownership rides the housing wave. Although not treated as expenditures on trips in the CE data, outlays for owned vacation homes are clearly related and interesting to examine in this report, given the changes that have taken place in U.S. housing markets in recent years.
Prior to the onset of the recession, housing prices rose rapidly in the United States, and the percentage of homeowners increased. Both figures fell thereafter.9 Interestingly, the CE data show that these phenomena were not limited to primary residences; owned vacation homes fit this pattern as well. From 2005 through 2009, the percent reporting expenditures for owned vacation homes rose substantially, from 3.0 percent to 5.8 percent.10 Similarly, the percentage reporting other costs associated with vacation homeownership, such as expenditures for utilities (from 3.0 to 4.1 percent) and payments for mortgage principal (from 0.8 to 1.8 percent), rose during this period. All figures declined in 2010 and again in 2011.
This article examines data on expenditures for travel from the 2005 through 2011 Consumer Expenditure Interview Surveys to ascertain how expenditures changed during the recent recession. Although levels of travel expenditures and the percentage of consumer units reporting them changed during the recession, the allocation of the travel budget for those who did travel did not change much. However, even here, there are indications that consumers who traveled attempted to minimize costs; for example, by allocating a larger portion of the food budget to purchases at grocery stores rather than restaurants. When adjusted for price change, there is evidence that those who traveled increased either length or frequency of travel before the recession, but cut back after its onset. There is also evidence that increases in gasoline prices, which peaked in 2008, spurred consumers to fly, or ride the train, rather than drive to their destinations. Furthermore, there is evidence that the rapid changes in housing markets experienced during this period affected not only primary residences, but vacation properties as well. The percentage of consumer units reporting expenditures related to owned vacation homes rose substantially until the middle of the period of study, and then fell again, consistent with the pattern exhibited in the primary residence market.
This Beyond the Numbers report was prepared by Geoffrey Paulin, Senior Economist, in the Office of Prices and Living Conditions, Consumer Expenditure Survey program. Email: Paulin.Geoffrey@bls.gov Telephone: 202-691-5132.
Information in this article will be made available to sensory-impaired individuals upon request. Voice phone: (202) 691-5200. Federal Relay Service: 1-800-877-8339. This article is in the public domain and may be reproduced without permission.
Geoffrey Paulin, “Travel expenditures, 2005–2011: spending slows during recent recession,” Beyond the Numbers: Prices & Spending, vol. 1, no. 20 (U.S. Bureau of Labor Statistics, December 2012), https://www.bls.gov/opub/btn/volume-1/travel-expenditures-2005-2011-spending-slows-during-recent-recession.htm
1 According to the National Bureau of Economic Research, the recession started in December 2007 and lasted until June 2009 (http://www.nber.org/cycles.html, accessed 9/25/2012).
2 Computed from microdata from the Consumer Expenditure Interview Survey for 2011. See https://www.bls.gov/cex/pumd.htm.
3 A consumer unit consists of any of the following: (1) all members of a particular household who are related by blood, marriage, adoption, or some other legal arrangement; (2) a person living alone, sharing a household with others, living as a roomer in a private home or lodging house, or in permanent living quarters in a hotel or motel, but who is financially independent; (3) two or more persons living together who use their incomes to make joint expenditure decisions. Financial independence is determined by spending behavior with regard to the three major expense categories: housing, food, and other living expenses. To be considered financially independent, the respondent must provide at least two of the three major expenditure categories, either entirely or in part. The terms consumer unit, family, and household are often used interchangeably for convenience. However, the proper technical term for purposes of the Consumer Expenditure Survey is consumer unit.
4 See https://www.bls.gov/cex/2011/Standard/tenure.pdf, accessed 9/25/2012. Both the food and rent figures appear on this table.
5 See data tables from the Bureau of Labor Statistics, Current Employment Statistics, data accessed 8/21/2012 from https://www.bls.gov/ces/#tables; “One-screen data search” tool, selecting “all employees, in thousands” for “leisure and hospitality” and “total nonfarm” industries for 2002 through 2011, and taking ratios.
6 The Bureau of Labor Statistics reports that the unemployment rate rose from 4.8 percent in December 2007 to 9.3 percent in June 2009, and never fell below 8.2 through December 2011, the last month for which Consumer Expenditure Survey data are examined in this report. For unemployment data, see https://www.bls.gov/cps/, accessed 8/21/2012, and get the monthly unemployment rate for 2007 through 2012.
7 The CPI program publishes price indexes for several specific goods and services, some of which are related to travel (for example, airline fares). The purpose of the index is to show how much the price for the good or service has changed since the base period against which it is measured; values larger than 100 indicate an increase in price, while smaller values indicate a decrease in price. To obtain real dollar expenditures for a specific good or service, the price-adjustment factor is computed by dividing the index for that good or service in the year of interest by the index for that good or service in the year of purchase. The average expenditure for that good or service in the year of purchase is then multiplied by the price-adjustment factor to obtain the real expenditure for the good or service. For example, table 1 shows $325 for average annual expenditures for airfare in 2010. However, prices may have been different in the year of interest, 2011. Indeed, data from the CPI program show that the price index for airline fares in 2011 was 304.026, while for 2010, the price index was 278.186 (https://www.bls.gov/cpi/tables/detailed-reports/home.htm), last accessed 12/10/2012; see also https://www.bls.gov/cpi/#tables, and click "ONE-SCREEN DATA SEARCH" under "CPI Databases, All Urban Consumers (Current Series)" for data from other years). Therefore, in 2010, expenditures in real 2011 dollars were $325*(304.026/278.186), or about $355. This is larger than the $342 reported in 2011, indicating that quantity purchased decreased from 2010 to 2011. Table 2 shows that percent reporting was about 10.6 percent in both years; taken together, this suggests that the same number of consumers traveled by plane each year, but that those who did took fewer trips by plane in 2011 than in 2010. Regarding the results presented above, the values in the tables are rounded from computations made with both expenditures and percent reporting carried out to several decimal places. Therefore, if performing the computations suggested above using the data presented in tables 1 and 2, the results may be substantially different from those shown in table 3 because of rounding prior to computation instead of after. In addition, it should be noted that the CPI does not collect prices in rural areas, where travelers may vacation, and does not distinguish between items purchased on trips and items purchased at home, except for the obvious cases (for example, airline fares and lodging away from home; note that even intercity train fares may not be expenditures for trips, but for commuting costs).
8 The annual CPI for gasoline rose from 194.7 in 2005 to 237.959 in 2007. (See https://www.bls.gov/cpi/#tables, and click "ONE-SCREEN DATA SEARCH" under "CPI Databases, All Urban Consumers (Current Series)." The format changed from one to three decimal places in 2007.) Solving for r in the formula At = Ao*exp(rt), where At = 237.959, Ao = 194.7, r is the annual change in CPI, and t = 2 (for two years of change), prices rose on average 10 percent from 2005 to 2006 and 2006 to 2007. In 2008, the index rose to 277.457, an increase of 16.6 percent from 2007.
9 Housing prices: According to the U.S. Census Bureau, median housing prices rose from $171,300 in January 2001 to a peak of $262,600 in March 2007, an increase of 53 percent. They then reached a minimum of $204,200 in October 2010, rebounding to $212,300 one year later, in October 2011, the last date from which these data are available. Although always higher, the same data show that mean housing prices followed a similar trend during these years, https://www.census.gov/const/uspricemon.pdf. In comparison, the Consumer Price Index rose only 17 percent from January 2001 to March 2007, and another 10 percent by October 2011 (computed from ftp://ftp.bls.gov/pub/special.requests/cpi/cpiai.txt).
Homeownership rates: According to the U.S. Census Bureau’s Current Population Survey (CPS), homeownership rates rose from 67.5 percent in first quarter of 2001 to 68.4 percent in first quarter of 2007, and dropped to 65.4 in first quarter of 2012, Table 14, “Homeownership Rates for the U.S. and Regions: 1965 to Present,” https://www.census.gov/housing/hvs/data/histtabs.html. More dramatically, according to the Gallup Poll, homeownership rates rose from 67 percent in 2001 to 73 percent in 2007, and then fell sharply, reaching a low of 62 percent in 2012, http://www.gallup.com/poll/154124/u.s.-homeownership-hits-decade-low.aspx. However, the Gallup Poll has a four-percentage point margin for error, and this may explain the differences in estimates from the CPS. Nevertheless, both show similar trends.
10 Expenditures in this category are: mortgage interest, property taxes, maintenance, and repairs.
Publish Date: Wednesday, December 12, 2012