An official website of the United States government
An official website of the United States government
The .gov means it's official.
Federal government websites often end in .gov or .mil. Before sharing sensitive information,
make sure you're on a federal government site.
The site is secure.
The
https:// ensures that you are connecting to the official website and that any
information you provide is encrypted and transmitted securely.

More BLS articles and information related to time use and consumer spending are available online at the following links:
The time pressures faced by working wives have led economists to predict that market goods and services would be substituted for those produced at home. Earlier research using Consumer Expenditure data found that a wife’s employment status (full time, part time, or not employed) had some influence on her family’s purchases of market goods and services, but other factors, such as family income and the wife’s education, were more influential.1
Current Population Survey data show that, among married-couple families with children under 18 in 2009, both the wife and the husband worked for pay in 58.9 percent of these families.
This article examines weekday resource allocation decisions of married couples with a husband employed full time and with children under 18. These decisions relate, among other things, to working for pay; doing unpaid household work; purchasing services such as childcare, laundry and drycleaning, and food away from home; and eating out. Information about spending decisions was obtained from the 2009 Consumer Expenditure Survey (CE) and information about time use was obtained from the 2009 American Time Use Survey (ATUS).2
Results show that,
Table 1 presents ATUS data on the average number of hours per weekday that married fathers spend in primary activities, such as work, travel, childcare, various household activities, and purchasing consumer goods and services.4 The table also shows the percentage of married fathers who engage in these primary activities. Married fathers’ hours per weekday and percentages are presented by the wives’ employment status. Table 2 provides similar data on married mothers. Table 3 provides CE spending data on goods and services that one might expect to vary with a wife’s employment status.
| Activity | Average percent engaged in the activity per weekday | Average hours per weekday for those engaged in the activity | ||||||
|---|---|---|---|---|---|---|---|---|
| All | Wife employed full time | Wife employed part time | Wife not employed | All | Wife employed full time | Wife employed part time | Wife not employed | |
|
Household activities |
66.0 | 72.6 | 61.9 | 60.7 | 1.32 | 1.43 | 1.35 | 1.18 |
|
Housework |
15.1 | 18.5 | 14.4 | 11.6 | 1.13 | 1.11 | 0.93 | 1.38 |
|
Housekeeping |
11.8 | 13.3 | 11.9 | 10.5 | 1.22 | 1.18 | 1.00 | 1.41 |
|
Laundry, drycleaning, and alterations |
5.4 | 7.9 | 4.6 | 2.2 | 0.52 | 0.61 | (2) | (2) |
|
Food preparation and cleanup |
43.8 | 50.2 | 44.5 | 36.0 | 0.63 | 0.64 | 0.54 | 0.67 |
|
Maintenance and repair (interior and exterior) |
13.1 | 13.3 | 14.7 | 11.3 | 1.68 | 1.98 | 1.82 | 1.29 |
|
Purchase of consumer goods and services |
32.2 | 31.4 | 32.5 | 34.2 | 0.73 | 0.75 | 0.70 | 0.73 |
|
Childcare (for household children) |
56.3 | 59.1 | 60.4 | 51.4 | 1.43 | 1.20 | 1.71 | 1.55 |
|
Working |
88.9 | 87.7 | 91.5 | 90.2 | 8.63 | 8.86 | 7.90 | 8.77 |
|
Travel |
96.1 | 97.1 | 97.0 | 95.1 | 1.50 | 1.45 | 1.54 | 1.55 |
|
Eating and drinking |
97.7 | 98.1 | 98.2 | 96.9 | 1.11 | 1.07 | 1.23 | 1.10 |
|
Eating and drinking at home |
81.3 | 82.5 | 79.6 | 81.3 | 0.71 | 0.68 | 0.73 | 0.73 |
|
Eating and drinking at a restaurant or bar |
17.4 | 16.1 | 23.7 | 15.3 | 1.00 | 1.03 | 1.02 | 0.95 |
|
Footnotes: |
||||||||
|
SOURCE: U.S. Bureau of Labor Statistics. |
||||||||
| Activity | Average percent engaged in the activity per weekday | Average hours per weekday for those engaged in the activity | ||||||
|---|---|---|---|---|---|---|---|---|
| All | Employed full time | Employed part time | Not employed | All | Employed full time | Employed part time | Not employed | |
|
Household activities |
92.6 | 88.3 | 95.8 | 97.0 | 2.72 | 1.69 | 2.77 | 4.01 |
|
Housework |
60.2 | 44.9 | 65.4 | 78.9 | 1.75 | 1.13 | 1.57 | 2.33 |
|
Housekeeping |
47.2 | 28.7 | 52.8 | 70.1 | 1.50 | 1.07 | 1.35 | 1.82 |
|
Laundry, drycleaning, alterations |
34.1 | 27.9 | 40.5 | 39.3 | 1.01 | 0.73 | 0.78 | 1.42 |
|
Food preparation and cleanup |
84.6 | 78.7 | 89.0 | 90.3 | 1.25 | 1.02 | 1.17 | 1.58 |
|
Maintenance and repair (interior and exterior) |
8.9 | 4.1 | 14.4 | 12.5 | 1.68 | 1.11 | 1.94 | 1.77 |
|
Purchase of consumer goods and services |
54.1 | 49.6 | 59.1 | 57.5 | 0.92 | 0.74 | 1.02 | 1.07 |
|
Childcare (for household children) |
86.8 | 81.0 | 89.8 | 93.2 | 2.41 | 1.65 | 2.82 | 3.11 |
|
Working(2) |
57.6 | 92.9 | 62.4 | 4.8 | 7.03 | 7.83 | 4.86 | 1.69 |
|
Travel |
92.9 | 97.2 | 96.3 | 84.9 | 1.42 | 1.45 | 1.42 | 1.39 |
|
Eating and drinking |
97.7 | 96.8 | 99.1 | 98.4 | 1.01 | 0.96 | 1.05 | 1.07 |
|
Eating and drinking at home |
87.0 | 82.7 | 88.3 | 92.4 | 0.75 | 0.61 | 0.81 | 0.89 |
|
Eating and drinking at a restaurant or bar |
14.4 | 12.5 | 16.7 | 15.8 | 1.04 | 1.06 | 1.08 | 0.99 |
|
Footnotes: |
||||||||
|
SOURCE: U.S. Bureau of Labor Statistics. |
||||||||
| Item | Percent reporting | Average annual expenditures for those reporting | ||||||
|---|---|---|---|---|---|---|---|---|
| All | Wife employed full time | Wife employed part time | Wife not employed | All | Wife employed full time | Wife employed part time | Wife not employed | |
|
Food at home |
99.7 | 99.7 | 100.0 | 99.4 | $6,653 | $6,569 | $6,810 | $6,683 |
|
Food away from home |
86.7 | 89.8 | 89.5 | 79.4 | 2,915 | 3,092 | 2,869 | 2,606 |
|
Childcare |
23.7 | 27.5 | 25.6 | 15.7 | 5,538 | 6,864 | 4,320 | 2,962 |
|
Household maintenance and repair services |
25.6 | 25.6 | 27.8 | 23.9 | 3,018 | 3,427 | 2,971 | 2,300 |
|
Housekeeping services |
7.0 | 8.3 | 7.6 | 4.3 | 2,529 | 2,336 | 2,266 | 3,504 |
|
Laundry and drycleaning services |
27.8 | 26.1 | 29.1 | 29.7 | 475 | 484 | 455 | 476 |
|
Transportation and vehicle maintenance and repairs |
98.5 | 98.8 | 98.3 | 98.0 | 2,941 | 3,094 | 2,971 | 2,652 |
|
Personal care services |
69.9 | 72.8 | 75.1 | 61.2 | 555 | 573 | 560 | 515 |
|
SOURCE: U.S. Bureau of Labor Statistics. |
||||||||
Among those engaged in work activities, married fathers, all of whom were employed full time, averaged 8.63 hours per weekday (table 1) compared with 7.83 hours for full-time working wives and 4.86 hours for part-time working wives (table 2).
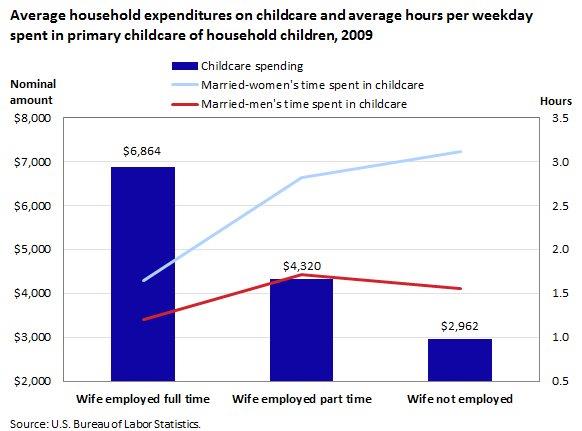
The proportion of families5 reporting childcare expenses and the annual amount spent by those reporting were lowest for families with wives not employed for pay (15.7 percent and $2,962) and highest for families with full-time working wives (27.5 percent and $6,864). (See table 3.) Conversely, the proportion of wives providing childcare and the average time spent were highest for wives not employed for pay and lowest for full-time working wives. Nearly 26 percent of part-time working-wife families reported childcare expenses, but the average expense was $4,320, possibly reflecting the fact that a lower proportion of part-time employed wives were engaged in work activities on weekdays and spent less time working than full-time employed wives. Almost 90 percent of this group provided an average of 2.82 hours of childcare per weekday. About three-fifths of husbands of full-time working wives and the same fraction of husbands of part-time working wives also provided childcare on weekdays, compared with 51 percent of husbands of wives not employed for pay. The time spent providing childcare ranged from 1.20 hours for husbands of full-time working wives to 1.71 hours for husbands of part-time working wives. (See chart 1.)
The ATUS defines household activities as activities performed by individuals to maintain their households. Among these activities are housework, food preparation and cleanup, and maintenance and repair of the dwelling (interior and exterior).
Housework. Full-time working wives were less likely than other wives to spend time in housework (housekeeping; laundry, drycleaning, and alterations). For example, 28.7 percent of full-time working wives did some housekeeping on weekdays, compared with 52.8 percent of part-time working wives and 70.1 percent of wives not employed for pay. Also, 27.9 percent of full-time working wives did laundry, drycleaning, and alterations, compared with 40.5 percent of part-time working wives and 39.3 percent of wives not employed for pay. In contrast, 12 percent of all husbands spent time on weekdays in housekeeping, and 5.1 percent did laundry, drycleaning, and alterations.
CE data indicate that the differences in time spent in housework on weekdays were not due to the substitution of paid services for time in working-wife families. For example, only 7 percent of all families reported spending on housekeeping services, with a range of 4.3 percent for families with wives not employed for pay to 8.3 percent for families with full-time working wives. The amounts spent by families with full-time and part-time working wives were similar ($2,336 versus $2,266) and were significantly lower than the $3,504 reported by families of wives not employed for pay. Using housekeeping services is often seen as a timesaving strategy for working-wife families, but previous research has found that income, not a wife’s employment status, is positively associated with spending on housekeeping services.6
In contrast to families reporting spending on housekeeping services, a greater proportion of families (27.8 percent) reported spending on laundry and drycleaning services. The proportion ranged from 26.1 percent for families of full-time working wives to 29.7 percent for families of wives not employed for pay. Dollar amounts spent ranged from $455 for families of part-time working wives to $484 for families of full-time working wives, but none of the differences was statistically significant. These findings are consistent with previous research which found that, after controlling for income and other factors, a wife’s employment status was not related to the purchase of laundry and drycleaning services.7
Food preparation and cleanup. On an average weekday, 43.6 percent of all husbands spent time in food preparation and cleanup, ranging from 36 percent of husbands of wives not employed for pay to about half of husbands of full-time working wives. About 85 percent of all wives spent time in food preparation and cleanup, ranging from 78.7 percent of full-time working wives to 90.3 percent of wives not employed for pay. The time spent ranged from about an hour for full-time working wives to 1.58 hours (1 hour and 35 minutes) for wives not employed for pay, more than the .54 to .67 of an hour (32 to 40 minutes) for husbands.
About 90 percent of working-wife families reported spending on food away from home, compared with 79.4 percent of families of wives not employed for pay. Families of full-time working wives spent $3,092, significantly more than the amounts reported by both families of part-time working wives ($2,869) and families of wives not employed for pay ($2,606). There was no significant difference between the latter two groups in the amount spent on food away from home. (See chart 2.)8
Contrary to what might be expected, only 12.5 percent of full-time employed wives and 16.1 percent of husbands of full-time employed wives spent time eating and drinking at a restaurant or bar, compared with 16.7 percent of part-time employed wives and 23.7 percent of husbands of part-time employed wives. Differences in spending on food away from home between families of full-time working-wives and other families may be related to differences in the proportion reporting and differences in the amount of time spent in food preparation and cleanup. It is possible that families of full-time working wives purchase items in the food-away-from-home category that reduce time spent in meal preparation and cleanup.
As a group, married fathers spent more time working on an average weekday than did married mothers, while married mothers spent more time in household activities and childcare. These findings reflect the fact that all husbands in the sample were employed full time, wives were less likely to be employed, and, regardless of employment status, wives were more likely than husbands to engage in unpaid household activities.9
When the data were broken down by a wife’s employment status, however, differences were uncovered. Full-time employed wives were less likely to provide primary childcare on weekdays and spent less time providing childcare than did part-time employed wives and wives not employed for pay. Married fathers, regardless of their wives’ employment status, were less likely to engage in primary childcare on weekdays and spent less time providing childcare than married mothers did. These time-use patterns may explain why childcare expenses were the highest for families of full-time employed wives.
Because most employed people work on weekdays, additional analysis is being conducted to determine if working wives and husbands of working wives spend more time in household activities on weekends compared with wives who are not employed for pay and husbands whose wives are not employed for pay.10
The CE sample included husband-and-wife families with at least one child under 18 and with a husband employed full time. In these families, half of all wives were employed full time, 21 percent were employed part time, and 29 percent were not employed for pay. Average family size was 4.0 for families of full-time working wives, 4.1 for families of part-time working wives, and 4.3 for families of wives not employed for pay. In 2009, average annual expenditures were $59,325 for families of full-time working wives and $61,803 for families of part-time working wives, significantly higher than the $53,565 spent by families in which the wife was not employed for pay. The expenditure difference between families of full-time working wives and families of part-time working wives was not statistically significant.
Two ATUS samples were analyzed. One was made up of married fathers employed full time and with at least one child under 18. The other was composed of married mothers with a husband employed full time and with at least one child under 18. The two samples were similar to the CE sample, in that families of full-time working wives made up the greatest proportion and families of part-time working wives the smallest proportion. Also, family size was smallest for families of full-time working wives and greatest for families of wives not employed for pay.11
This BEYOND The NUMBERS article was prepared by Ann C. Foster and Craig J. Kreisler, economists in the Office of Prices and Living Conditions, Bureau of Labor Statistics. Email: foster.ann@bls.gov, telephone: (202) 691-5174, or email: kreisler.craig@bls.gov, telephone: (202) 691-5123.
Acknowledgment: The authors thank Rachel Krantz-Kent, Branch Chief, American Time Use Survey (ATUS), for her helpful comments and suggestions, as well as additional ATUS staff who provided support during the preparation of this article.
Information in this article will be made available to sensory-impaired individuals upon request. Voice phone: (202) 691-5200. Federal Relay Service: 1-800-877-8339. This article is in the public domain and may be reproduced without permission.
Ann C. Foster and Craig J. Kreisler, Consumer Expenditure Survey, “How parents use time and money ,” Beyond the Numbers: Prices & Spending, vol. 1, no. 11 (U.S. Bureau of Labor Statistics, August 2012), https://www.bls.gov/opub/btn/volume-1/how-parents-use-time-money.htm
1 For more information, see Ann C. Foster and Sheila Mammen, “Impact of wife’s employment on service expenditures,” Journal of Consumer Studies and Home Economics, March 1992, pp. 9–18; Ann C. Foster, “Wife’s employment and family expenditures,” Journal of Consumer Studies and Home Economics, March 1988, pp. 15–27; and Don Bellante and Ann C. Foster, “Working wives and expenditure on services,” Journal of Consumer Research, September 1984, pp. 700–707, available online at http://www.jstor.org/stable/pdfplus/2488976.pdf.
2 A more detailed description of the Consumer Expenditure Survey may be found in BLS Handbook of Methods, Bureau of Labor Statistics, Chapter 16, ”Consumer Expenditures and Income,” available online at https://www.bls.gov/opub/hom/pdf/homch16.pdf.
For more information on the American Time Use Survey, see “American Time Use Survey—2009 Results,” USDL-10-0855 (U.S. Bureau of Labor Statistics, July 22, 2010), available online at https://www.bls.gov/news.release/archives/atus_06222010.pdf.
3 Full-time workers are those who usually work 35 or more hours per week, and part-time workers are those who usually work less than 35 hours per week. For the purpose of this research, an individual is considered not employed for pay if unemployed, retired, a student, taking care of children or other family members, or neither working nor seeking work.
4 A primary activity is the main activity an ATUS respondent was engaged in at a specific time. A secondary, or simultaneous, activity is an activity done at the same time as a primary activity. Except for care of children under 13, ATUS does not systematically collect information on secondary activities. All ATUS estimates in this research are for primary activities only.
5 Although consumer unit is the proper technical term for the purposes of the CE, it is often used interchangeably with household or family for convenience. In this study, family is used instead of consumer unit. See BLS Handbook of Methods, Chapter 16, for more information.
6 For more information, see Foster and Mammen, ”Impact of wife’s employment”; Sharon Y. Nickols and Karen D. Fox, “Buying time and saving time: strategies for managing household production,” Journal of Consumer Research, September 1983, pp. 197–208, available online at http://www.jstor.org/stable/2488924; and Bellante and Foster, ”Working wives.”
7 Family income was positively associated with spending on laundry and drycleaning services, and households living in urban areas spent more on these services than rural households did. For more information, see Foster and Mammen, “Impact of wife’s employment”; and Nickols and Fox, ”Buying time and saving time.”
8 Food away from home is made up of school meal purchases, as well as meals, snacks, and nonalcoholic beverages purchased at full-service restaurants, fast-food outlets, cafeterias, vending machines, concession stands, and mobile vendors, whether the food is eaten onsite, carried out, or delivered.
9 For a detailed analysis of time spent in unpaid household work, see Rachel Krantz-Kent, “Measuring time spent in household work: results from the American Time Use Survey,” Monthly Labor Review, July 2009, pp. 46–59, https://www.bls.gov/opub/mlr/2009/07/art3full.pdf.
10 ATUS data indicate that, in 2009, 89.2 percent of all men employed full time worked on an average workday, compared with 35.8 percent who worked on an average weekend day. Nearly 87 percent of married mothers employed full time worked on an average workday, compared with nearly 36 percent who worked on an average weekend day; for women employed part time, these proportions were 60.2 percent and 35.7 percent, respectively. For more information, see “American Time Use Survey—2009 Results.”
11 ATUS data on married fathers revealed that the greatest proportion (42 percent) had a full-time working wife while 21 percent had a wife who worked part time and 37 percent had a wife who was not employed for pay. Average family size was 4.0 for husbands of full-time working wives and 4.3 for both husbands of part-time working wives and husbands of wives not employed for pay. ATUS data on married mothers showed that the greatest proportion (48 percent) worked full time, while 21 percent worked part time, and 32 percent was not employed for pay. For married mothers, average family size was 4.1 for full-time working wives, 4.3 for part-time working wives, and 4.4 for wives not employed for pay.
Publish Date: Monday, August 20, 2012