
An official website of the United States government
An official website of the United States government
The .gov means it's official.
Federal government websites often end in .gov or .mil. Before sharing sensitive information,
make sure you're on a federal government site.
The site is secure.
The
https:// ensures that you are connecting to the official website and that any
information you provide is encrypted and transmitted securely.

More BLS articles and information related to veterans are available online at the following links:
In 2007, nearly 1.5 million veterans had served in the United States Armed Forces since September 2001. 1 By the end of 2007, the United States began a long recession, in which young workers faced particularly large employment losses. 2 This analysis focuses on labor market, educational, and training experiences of young male veterans and nonveterans during the January 2008-to-June 2009 time period. This period coincides with the recent recession that began in December 2007 and continued through June 2009.3
Data in this article are from the National Longitudinal Survey of Youth 1997 (NLSY97). The NLSY97 is a nationally representative sample of 8,984 men and women, who were born in the years 1980 to 1984 and were living in the United States at the time of the initial survey. Survey participants were first interviewed in 1997 when they were ages 12 to 17 and have been interviewed annually. Survey participants turned 24 to 28 years old in 2008. Veterans in the analysis are defined as those who had served in the military and were not on active duty at any point during the January 2008-to-June 2009 period. 4 Nonveterans are defined as those who never served in the military.
The NLSY97 includes detailed employment, schooling, and training histories, as well as a cognitive test score based on the Armed Services Vocational Aptitude Battery (ASVAB). 5 A summary percentile score created by NLS staff provides a math and verbal aptitude score similar to the Armed Forces Qualifying Test (AFQT) score used in the military to help determine enlistment qualifications.
Table 1 provides descriptive statistics of U.S. male veterans who were not active in the military from January 2008 to June 2009 and descriptive statistics of two comparison groups of nonveterans. 6 The first comparison group is all male nonveterans with no military service. The second group consists of all male nonveterans with no military service, but the nonveteran sample is reweighted, so that it is comparable to the veteran sample in terms of year of birth and educational attainment. 7 Looking at the sample statistics for veterans compared with nonveterans allows one to see why the second comparison group was created. Compared with nonveterans, veterans had a lower percentage of young men who had less than a high school education (and equivalency), and a lower percentage of young men with a bachelor’s degree or more. In addition, a lower percentage of veterans were born in the years 1983 and 1984, because many of the younger NLSY97 respondents with military experience were still on active duty in the military in the January 2008-to-June 2009 period and, thus, are excluded from the analysis. Veterans’ math-verbal percentile scores average more than 4 percentage points higher than the reweighted nonveterans sample’s average percentile score.
| Characteristic | Veterans (no military service in January 2008 through June 2009) | All nonveterans | All nonveterans (reweighted to veterans sample in terms of education and birth year) |
|---|---|---|---|
| White, non-Hispanic | 69.6 | 69.8 | 68.4 |
| Black, non-Hispanic | 14.7 | 15.4 | 15.4 |
| Hispanic or Latino | 15.7 | 13.4 | 14.7 |
| Less than high school | 0 | 10.4 | 0 |
| GED | 8.3 | 11.1 | 8.5 |
| High school diploma | 40.7 | 26.4 | 41.3 |
| Some college | 40.0 | 26.4 | 39.1 |
| Bachelor's degree or more | 11.0 | 25.7 | 11.2 |
| Math-verbal percentile score | 51.9 | 49.7 | 47.6 |
| Born in 1980 | 28.1 | 20.2 | 27.7 |
| Born in 1981 | 34.1 | 19.0 | 34.7 |
| Born in 1982 | 19.8 | 20.5 | 19.3 |
| Born in 1983 | 8.4 | 19.3 | 8.2 |
| Born in 1984 | 9.6 | 21.0 | 10.1 |
| Source: U.S. Bureau of Labor Statistics, National Longitudinal Survey of Youth 1997. | |||
Chart 1 displays monthly employment rates for veterans, nonveterans, and the reweighted sample of nonveterans. The vertical axis shows the percent of each group employed each month. 8 The horizontal axis shows month and year, from January 2008 through June 2009. Monthly employment during the recession is shown by the dashed red line for veterans, the light blue line for nonveterans, and the dark blue line for the reweighted nonveteran sample.
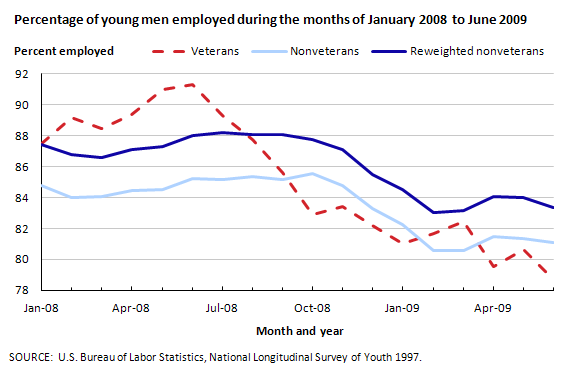
In January 2008, the percent of veterans employed is similar to that of the full and reweighted samples of nonveterans (87 percent, 85 percent, and 87 percent, respectively). Veteran employment then trended upwards to peak at about 91 percent in June 2008. The nonveteran and reweighted nonveteran employment rates were 85 and 88 percent, respectively, in June 2008. After June 2008, the veteran’s line sharply declined until the fall of 2008, after which it gradually trended downward and reached a low point of 79 percent in June 2009. The nonveteran trends generally moved together, with the reweighted nonveteran sample’s line lying above the nonveteran sample’s line. Both lines remained fairly flat from January 2008 to October 2008, after which they trended downward to a low in February 2009 and remained fairly flat from there until June 2009.
The G.I. Bill provides education benefits for veterans to help further their schooling and training after leaving active military duty. 9 The combination of benefits from the G.I. Bill for veterans and the likelihood that nonveterans in their mid 20s had completed much of their college-going years, make the findings in the next two charts not surprising—veterans engaged in more schooling and training over the January 2008-to-June 2009 period than did nonveterans. Chart 2 shows monthly college enrollment from January 2008 to June 2009 for veterans and the two comparison groups of nonveterans. During non-summer months, between 20 percent and 23 percent of veterans were enrolled in college in a given month. The incidence of college enrollment for nonveterans is significantly lower. From January 2008 to June 2009, between 9 percent and 14 percent of nonveterans were enrolled in a given month. The reweighted nonveteran sample, which adjusts this group toward respondents in birth years 1980–1982, shows college enrollment rates of about 8 percent to 11 percent, in a given month over this time period.
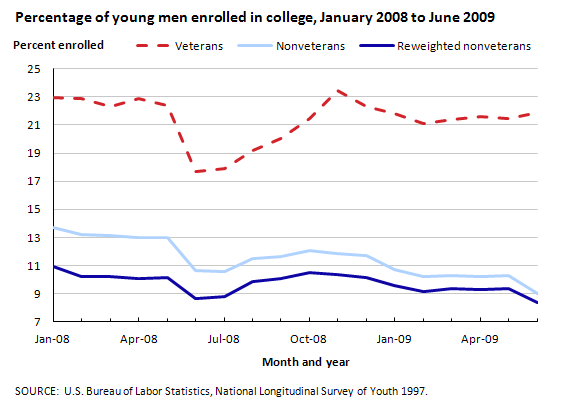
Chart 3 displays the percentage of young men enrolled in training during the months of January 2008 to June 2009. The monthly incidence of training was created using the start and stop dates of training spells, so they do not depict training intensity or type of training enrollment. 10 In January 2008, almost 9 percent of veterans were enrolled in a training program. After a dip in June and July of 2008, monthly enrollment in training mostly trended upwards to a peak of 13 percent in April of 2009. As with college enrollment, training enrollment was lower for nonveterans than for veterans from January 2008 to June 2009. Trend lines for both sets of nonveterans remained fairly flat over the January 2008-to-June 2009 period, with a maximum in September 2008 of 6 percent for the sample of nonveterans and 7 percent for the reweighted sample of nonveterans.
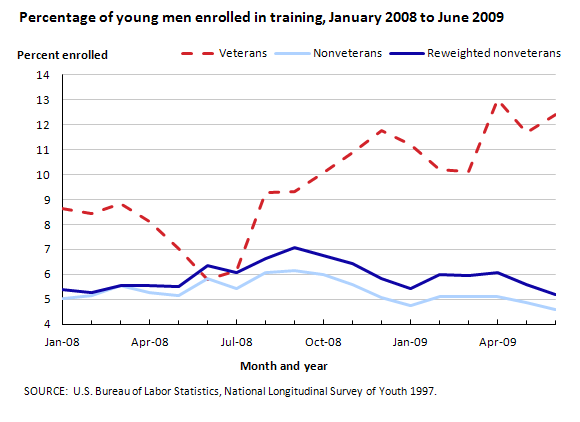
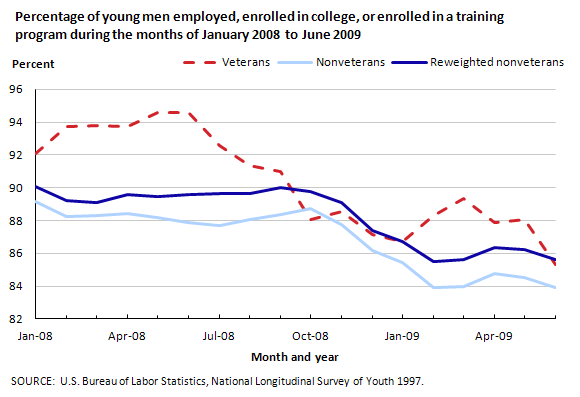
Chart 4 combines the prior three charts by showing the percentage of each group of men who were working, in college, or in training from January 2008 through June 2009. The trend line for veterans lies above the trend lines for nonveterans and the reweighted sample of nonveterans from January 2008 through September 2008, although it declines over time whereas the nonveteran lines remain mostly flat. After September 2008, the three trend lines generally move together in a downward trend until January 2009, when the veterans trend line rises, and the nonveteran trend lines remain fairly flat. Veterans generally were more likely than nonveterans to be enrolled in college or a training program over the January 2008-to-June 2009 period, as shown in charts 2 and 3. Chart 4 indicates that many of the veterans were employed and enrolled in school or engaged in training simultaneously.
In summary, male veterans and nonveterans both experienced a decline in employment as the recession wore on from January 2008 to June 2009—with the decline in veterans’ employment exceeding that of nonveterans’ employment. Over this same time, a substantial percentage of veterans were enrolled in college or a training program. A smaller percentage of nonveterans were engaged in skill accumulation through college enrollment or formal training. This was likely because the majority of nonveterans’ schooling occurred at earlier ages. Much of the veterans’ additional education and training was embarked on while they were employed. As the NLSY97 youth age—and more respondents exit the military—researchers will be able to investigate longer term employment of a larger sample of veterans and a comparable group of nonveterans.
This BEYOND THE NUMBERS summary was prepared by Donna Rothstein, a research economist in the Office of Employment and Unemployment Statistics, National Longitudinal Surveys, U.S. Bureau of Labor Statistics. Email: rothstein.donna@bls.gov; telephone: (202) 691-7529.
Information in this article will be made available to sensory-impaired individuals upon request. Voice phone: (202) 691- 5200. Federal Relay Service: 1-800-877-8339. This article is in the public domain and may be reproduced without permission.
2 See Steven F. Hipple, “The Labor Market in 2009: Recession Drags On,” Monthly Labor Review 133, no.3 (March 2010), pp. 3–22. https://www.bls.gov/opub/mlr/2010/03/art1full.pdf.
3 The National Bureau of Economic Research (NBER) generally is recognized as the arbiter of recessions in the United States.
4 They also report that they are not on active duty at the date of the 2009 interview.
5 From the summer of 1997 through the spring of 1998, a little less than 80 percent of NLSY97 respondents participated in the administration of the computer-adaptive form of the ASVAB.
6 Data are weighted to be nationally representative, using 2009 survey weights.
7 Weights are developed sequentially for birth year and educational attainment, rather than for educational attainment by birth-year cells.
8 Employment data in the NLSY97 are available on a weekly basis. To form the monthly measure, someone is counted as employed if they work at least 1 week during a 4-week period during the given month. The percentage of each group employed is calculated by dividing the number of employed by the number who are employed, unemployed, or not in the labor force.
9 For more information about the G.I. Bill, see http://gibill.va.gov/.
10 In the training section of the NLSY97 questionnaire, respondents are asked to report any schooling, courses, or training programs designed to help people find a job, improve their job skills, or learn a job.
“Employment, college enrollment, and training of young male veterans and nonveterans during the recent recession,” Beyond the Numbers: Employment & Unemployment, vol. 1, no. 4 (U.S. Bureau of Labor Statistics, June 2012), https://www.bls.gov/opub/btn/volume-1/employment-college-enrollment-and-training-of-young-male-veterans-and-nonveterans-during-the-recent-recession.htm
Publish Date: Saturday, June 2, 2012