An official website of the United States government
An official website of the United States government
The .gov means it's official.
Federal government websites often end in .gov or .mil. Before sharing sensitive information,
make sure you're on a federal government site.
The site is secure.
The
https:// ensures that you are connecting to the official website and that any
information you provide is encrypted and transmitted securely.

More BLS related articles and information related to occupational employment and wages are available online at the following links:
People who work in community and social service occupations are concerned with improving society and the lives of individuals. These workers perform a diverse array of duties that may include counseling individuals with substance abuse and behavioral problems, providing social assistance to improve the social and psychological functioning of families, and offering spiritual and moral guidance to members of a faith.
This issue of Beyond the Numbers will give a broad overview of employment and wages in community and social service occupations.
There were 1.9 million community and social service occupations jobs in 2011, accounting for less than 1.5 percent of U.S. employment. It was one of the smaller major occupational groups, with fewer jobs for the group as a whole than some single occupations had in 2011 (such as registered nurses, which had employment of 2.3 million). (For more information on occupational groups, see the U.S. Bureau of Labor Statistics Occupational Employment Statistics website: https://www.bls.gov/oes/current/oes_nat.htm.) The largest occupations in the community and social service occupations group were social and human service assistants, with employment of 359,860; child, family, and school social workers (276,510); and educational, guidance, school, and vocational counselors (244,560). Religious workers, all other (7,660); directors, religious activities and education (17,560); and counselors, all other (27,140) were the smallest community and social service occupations. (See chart 1.)
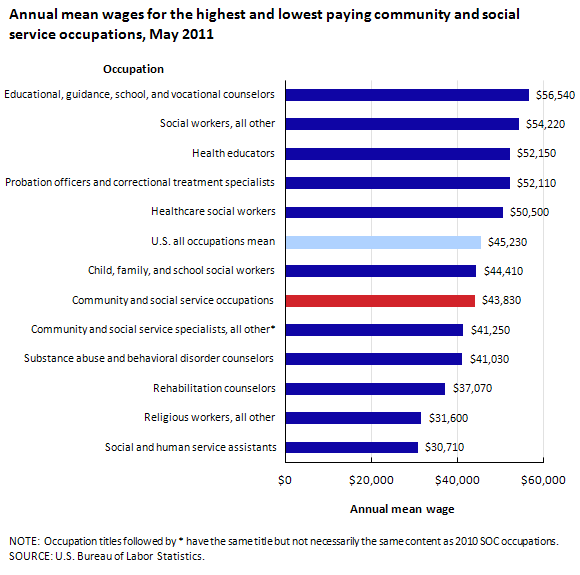
Community and social service occupations had an annual mean wage of $43,830, which was just below the U.S. all-occupations mean wage of $45,230. Out of the 17 occupations in the community and social service group, 7 had a mean wage above the U. S. average and 10 had a mean wage below average. Some of the highest-paying occupations in the community and social service group were educational, guidance, school, and vocational counselors ($56,540); health educators ($52,150); and probation officers and correctional treatment specialists ($52,110). Two of the lowest-paying occupations, social and human service assistants ($30,710) and religious workers, all other ($31,600), had the highest (359,860) and lowest (7,660) employment, respectively, in the occupational group. (See chart 2.)
Although the private sector accounted for 83 percent of jobs across all occupations in 2011, the private sector made up only 60 percent of community and social service jobs. In the community and social services occupational group, one-quarter of private sector employment was found in one industry: individual and family services (employment of 282,360). Other large private industries with high numbers of jobs in community and social services were residential mental retardation, mental health, and substance abuse facilities (124,930); outpatient care centers (116,880); vocational rehabilitation services (81,960); and religious organizations (45,320). Local government, including schools and hospitals, had the highest employment in the public sector, with a total of 439,040 community and social service jobs. State government, including schools and hospitals, had the next highest employment with 291,480. The federal government had far fewer community and social service jobs, with a total of 16,980. Finally, three large industries had community and social services jobs in both the private and public sectors: elementary and secondary schools (employment of 199,170); general medical and surgical hospitals (95,910); and colleges, universities, and professional schools (57,680). For those jobs in community and social services, elementary and secondary schools had private employment of 20,410 (10 percent) and public employment of 178,750 (90 percent); general medical and surgical hospitals had private employment of 80,230 (84 percent) and public employment of 15,670 (16 percent). (See table 1.)
| Industry | Type of ownership | Employment |
|---|---|---|
Total private employment | Private | 1,142,900 |
Local government | Local government | 439,040 |
State government | State government | 291,480 |
Individual and family services | Private | 282,360 |
Elementary and secondary schools | Private, state, and local government | 199,170 |
Residential mental retardation, mental health and substance abuse facilities | Private | 124,930 |
Outpatient care centers | Private | 116,880 |
General medical and surgical hospitals | Private, state, and local government | 95,910 |
Vocational rehabilitation services | Private | 81,960 |
Colleges, universities, and professional schools | Private, state, and local government | 57,680 |
Religious organizations | Private | 45,320 |
Community food and housing, and emergency and other relief services | Private | 44,370 |
Other residential care facilities | Private | 38,510 |
Social advocacy organizations | Private | 34,520 |
Psychiatric and substance abuse hospitals | Private, state, and local government | 32,400 |
Offices of other health practitioners | Private | 29,470 |
Home healthcare services | Private | 28,020 |
Nursing care facilities | Private | 26,560 |
Federal government | Federal | 16,980 |
| Source: U.S. Bureau of Labor Statistics |
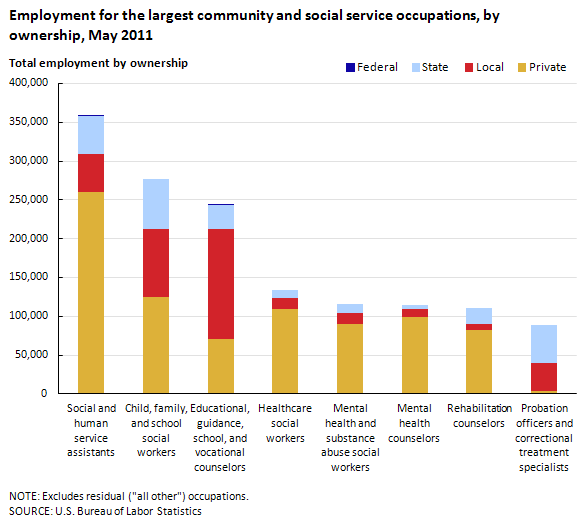
Chart 3 lists the largest occupations in the community and social service group by ownership. Federal employment of social and human service assistants and educational, guidance, school, and vocational counselors accounted for less than 1 percent of the total employment for each occupation. The other occupations listed in chart 3 did not have any federal employment. Probation officers and correctional treatment specialists had the highest percentage of workers employed by state government, with 55 percent of the occupation’s total employment; this occupation also had the lowest percentage of private employment of those shown in chart 3, at 5 percent. The occupation with the highest local employment (141,603 jobs) and percentage of total employment in local employment (58 percent) was educational, guidance, school, and vocational counselors. The occupation with the highest concentration in the private sector was mental health counselor, with 86 percent of all jobs in this occupation owned by the private sector.
Map 1 shows the location quotients for the community and social service occupations by state. Location quotients are useful for analyzing occupational employment while controlling for the size of the state. They are useful for comparing the composition of jobs in an area relative to the average or for finding areas that have high concentrations of jobs in certain occupations. As measured here, a location quotient shows the occupation’s share of an area’s employment relative to the national average. For example, a location quotient of 2.0 indicates that an occupation accounts for twice the share of employment in the area than it does nationally, and a location quotient of 0.5 indicates the area’s share of employment in the occupation is half the national share. Generally, the more populous a state or metropolitan area is, the higher the employment of occupations in community and social services will be. For example, California had the highest employment of all occupations (14,038,950) and also had the highest employment of community and social service occupations (207,000). However, from the perspective of location quotients, California is ranked 25th out of the 50 states, with a location quotient of 1.0 for the community and social service occupations.
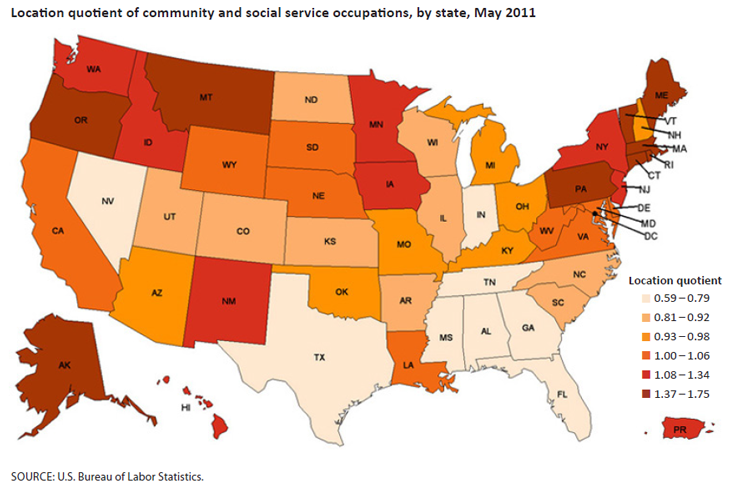
Although it only had an employment of 7,510 in the community and social service group, Vermont had the highest overall location quotient (1.75). This was because multiple occupations in the state had high location quotients, including mental health and substance abuse social workers (3.52), social and human service assistants (2.62), mental health counselors (2.33). Other states with high location quotients were Rhode Island (1.51), Massachusetts (1.49), Connecticut (1.45), and Alaska (1.44). In contrast, Nevada had the lowest location quotient (0.59) for the community and social service group. Nevada had a few occupations with low location quotients, which contributed to the low overall quotient: marriage and family therapists (0.33), clergy (0.36), and substance abuse and behavioral disorder specialists (0.37). Some other states with low location quotients were Alabama (0.61), Texas (0.70), Indiana (0.72), and Tennessee (0.76). Table 2 has a list of all the occupations in community and social services and their respective highest and lowest state location quotients.
| Occupation | State with highest LQ | High LQ | State with lowest LQ | Low LQ |
|---|---|---|---|---|
Substance abuse and behavioral disorder counselors | Pennsylvania | 2.90 | Nevada | 0.37 |
Educational, guidance, school, and vocational counselors | Louisiana and Missouri | 1.43 | Michigan | 0.61 |
Marriage and family therapists | New Jersey | 5.64 | Georgia | 0.08 |
Mental health counselors | Pennsylvania | 3.11 | Hawaii | 0.18 |
Rehabilitation counselors | Idaho | 3.97 | Hawaii | 0.26 |
Counselors, all other | Kansas | 4.32 | Missouri | 0.09 |
Child, family, and school social workers | Kentucky | 2.05 | New Hampshire | 0.40 |
Healthcare social workers | Massachusetts | 3.02 | Wyoming | 0.53 |
Mental health and substance abuse social workers | Vermont | 3.52 | Georgia | 0.27 |
Social workers, all other | New Mexico | 3.33 | Minnesota | 0.26 |
Health educators | Alaska | 2.37 | New Jersey | 0.37 |
Probation officers and correctional treatment specialists | New Mexico | 2.30 | Massachusetts and Hawaii | 0.18 |
Social and human service assistants | Vermont | 2.62 | Tennessee | 0.33 |
Community and social service specialists, all other* | Hawaii | 2.62 | Alabama | 0.14 |
Clergy | Oregon | 7.38 | New Hampshire | 0.28 |
Directors, religious activities and education | Oregon | 7.34 | Massachusetts | 0.09 |
Religious workers, all other | Oregon | 5.52 | Texas | 0.16 |
| Source: U.S. Bureau of Labor Statistics |
A few states have occupations listed in both the highest and lowest location quotient columns in table 2. Massachusetts had the highest location quotient for healthcare social workers (3.02) and had the lowest location quotients for directors, religious activities and education (0.09), and probation officers and correctional treatment specialists (0.18). Hawaii had the highest location quotient for community and social services, all other (2.62), and had the lowest location quotients for mental health counselors (0.18), rehabilitation counselors (0.26), and probation officers and correctional treatment specialists (0.18). Even Vermont, the state with the highest overall location quotient for the occupational group, had an occupation that was below the national average: healthcare social workers (0.93).
Map 2 shows the location quotients for every state for child, family, and school social workers. The states with the highest location quotients were Kentucky (2.05), Rhode Island (1.89), South Dakota (1.84), Hawaii (1.67), Iowa (1.60), Connecticut (1.58), Alaska (1.56), and West Virginia (1.56). Out of these states, Kentucky also had the highest employment (7,640). Annual wages vary greatly between states with high location quotients, from West Virginia, which had the lowest average annual wage of any state ($29,910), to Connecticut, which had the highest annual average wage of any state ($62,200).

Map 3 shows the highest and lowest location quotients for child, family, and school social workers in metropolitan and nonmetropolitan areas. Kentucky had the highest location quotient of any state for this occupation, and had high location quotients for many of its metropolitan and nonmetropolitan areas. Elizabethtown had the second-highest location quotient (4.26) out of all the metropolitan areas in Kentucky, with an average annual wage of $34,690, and employment of 410 child, family, and school social workers. Owensboro had the fifth-highest location quotient (2.51), an average annual wage of $26,450, and an employment of 260. There are four nonmetropolitan areas in Kentucky and three of them appear in the top five of all nonmetropolitan areas having the highest location quotients for child, family, and school social workers in the United States. The East Kentucky nonmetropolitan area had the highest location quotient (4.02) out of any nonmetropolitan area in the country, with an average annual wage of $37,340 and employment of 1,010 child, family, and school social workers. The third-highest location quotient (2.66) for a nonmetropolitan area was in South Central Kentucky, which had an average annual wage of $37,070 and an employment of 950. Finally, the fifth-highest location quotient (2.56) for a nonmetropolitan area belonged to West Central Kentucky, which had an average annual wage of $38,110 and an employment of 830.

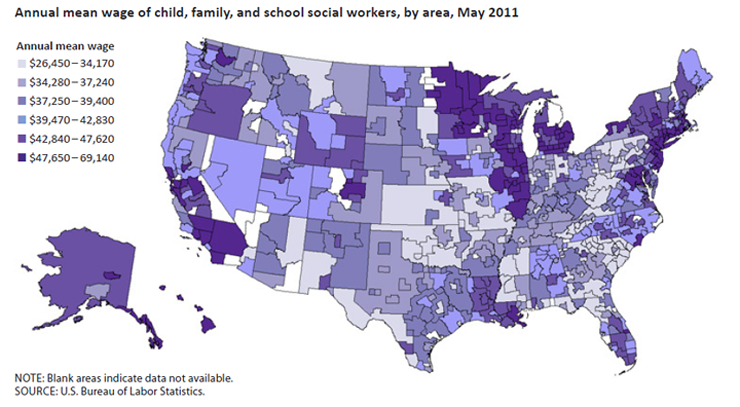
Map 4 shows the annual wages for child, family, and school social workers by metropolitan and nonmetropolitan areas. Connecticut had some of the highest annual average wages in the community and social services occupations. With an employment of 430 community and social service workers and a high location quotient (1.54), Norwich-New London, CT-RI, had an annual average wage of $58,130, the lowest wage for this group out of the metropolitan areas in Connecticut, but still well above average. Waterbury, the metropolitan area with the highest location quotient (2.41) in Connecticut, had one of the highest average annual wages ($64,270) and employment of 330 for community and social service occupations. Hartford-West Hartford-East Hartford had the highest employment of any metropolitan area in Connecticut (2,370). The area had the 14th-highest location quotient (2.00) out of all U.S. metropolitan areas and an annual average wage of $61,980. The state of Connecticut has two nonmetropolitan areas, Eastern and Northwestern. The Eastern nonmetropolitan area had the second-highest annual average wage ($68,880) out of all U.S. nonmetropolitan areas, the fourth-highest location quotient (2.63) out of all nonmetropolitan areas, and an employment of 150 for community and social service occupations. The Northwestern nonmetropolitan area had the third-highest annual average wage ($65,510) out of all nonmetropolitan areas, the 21st-highest location quotient (1.84), and an employment of 140.
Generally, the wages of community and social services occupations followed the overall wage patterns for all occupations in an area, but wages for the group were also strongly influenced by the mix of occupations in each area. Higher levels of skill typically lead to higher wages. For example, social and human service assistants, who are usually required to have a high school diploma or equivalent to work in the field and typically receive short-term on-the-job training, had a national annual average wage of $30,710. In contrast, educational, guidance, school and vocational counselors require a master’s degree for an entry-level job and had a national annual average wage of $56,540. Because the detailed occupations in this group have different skill levels, those areas with more employment in higher-skilled occupations had higher wages compared with areas with more employment in the lower-skilled occupations.
This Beyond the Numbers article was prepared by John I. Jones, economist in the Occupational Employment Statistics program. For more information, please contact the OES program at www.bls.gov/oes/home.htm#contact. Occupational profiles for each occupation in the community and social service group are available at Community and Social Service Occupations . Complete May 2011 OES data are available from the OES home page at www.bls.gov/oes.
Information in this article will be made available to sensory-impaired individuals upon request. Voice phone: (202) 691- 5200. Federal Relay Service: 1-800-877-8339. This article is in the public domain and may be reproduced without permission.
John I. Jones, Occupational Employment Statistics program, “Employment and wages in community and social service occupations,” Beyond the Numbers: Employment & Unemployment, vol. 1, no. 16 (U.S. Bureau of Labor Statistics, October 2012), https://www.bls.gov/opub/btn/volume-1/employment-and-wages-in-community-and-social-service-occupations.htm
Publish Date: Wednesday, October 31, 2012