An official website of the United States government
An official website of the United States government
The .gov means it's official.
Federal government websites often end in .gov or .mil. Before sharing sensitive information,
make sure you're on a federal government site.
The site is secure.
The
https:// ensures that you are connecting to the official website and that any
information you provide is encrypted and transmitted securely.

More articles and information related to Consumer Price Index data are available online at the following links:
The Consumer Price Index (CPI) is an estimate of the average change in prices over time paid by urban consumers for a market basket of consumer goods and services in the United States. The CPI is used extensively in many different ways, including three major uses: to adjust historical data, to escalate federal payments and tax brackets, and to adjust rents and wages. It directly affects the lives of Americans, so it must be as accurate as possible. But how accurate is it? If, for example, the CPI measures annual inflation as 2.3 percent, how confident can we be in that estimate?
This issue of Beyond the Numbers looks at some different ways the U.S. Bureau of Labor Statistics (BLS) has responded to questions about the accuracy and precision of the CPI. The first section examines the sampling error of the CPI, and the second section discusses possible sources of bias in the index.
The CPI measures price changes based on a representative sample of items (goods and services), so the published indexes differ from estimates based on actual records of all retail purchases by everyone in the index population. The CPI collects around a million prices per year, but this is only a tiny fraction of all the prices in the economy. Like other surveys that make estimates based on samples of data, the CPI is subject to sampling error. In the case of the CPI, we can think of this error as the difference between the CPI estimate and what the estimate would be if the CPI was able to collect all prices. Sampling error is really a measure of uncertainty; the level of uncertainty can be measured by a statistic known as standard error. The precision of the CPI estimate is limited by sampling error. The CPI publishes measurements of sampling error for all of its indexes.
The sampling error is quite small for the CPI for All Urban Consumers (CPI-U), U.S. City Average, All Items index, which is the broadest measure of inflation. The median standard error for 1-month price changes is 0.03 percent. For example, if the all items index increases 0.4 percent in a month, it can be said with 95 percent confidence that the actual rate of inflation is between 0.34 and 0.46 percent (that is, 0.4 plus or minus two times the standard error).
The sampling error for 12-month changes in the all items CPI is also small, with a median standard error of 0.07 percent. So, for example, if prices rise 2.3 percent, it can be said with 95 percent confidence that the actual rate of inflation lies between 2.16 percent and 2.44 percent.
However, it is important to note that sampling errors are typically larger (and often much larger) for smaller geographic regions and smaller CPI item categories. For example, the 12-month median standard error for the Northeast all items CPI is 0.17 percent, more than twice as large as the 0.07 percent standard error for the United States as a whole. Standard errors for local metropolitan areas, such as Boston or Philadelphia, would typically be even larger.
Similarly, CPI item categories usually have larger standard errors than the all items index. For example, the 12-month standard error for the food index is 0.14 percent—twice as high as that for the all items index. For some index series, the standard errors are significantly higher. For example, the 12-month standard error for apparel is 0.95 percent, meaning that a 12-month increase of 1.9 percent would have a 95-percent confidence interval of between 0.0 percent and 3.8 percent.1 For this reason, BLS encourages users to employ broader indexes when using the CPI for purposes of escalation. The broadest index, with the lowest standard error, is the all items U.S. city average, which is widely used even when more specific indexes might be considered.
Sampling error greatly influences the precision of the CPI, but the issue of bias may be of greater concern to the accuracy of the indexes. Bias is defined as the difference between the expected value of an estimator and the true value being estimated. This is a different and perhaps more serious issue than sampling error. In general, sampling error tends to even out in the long run, but if the CPI is persistently understating or overstating inflation because of a bias, a growing gap between true price change and the CPI measure will occur.
The CPI has been criticized for having both an upward bias (overstating inflation) and a downward bias (understating inflation). Much of the criticism asserting an upward bias comes from the academic community. In 1995, Congress, aware of such criticism, commissioned a group of academic economists, led by Michael Boskin, to study and report on the CPI. The resulting study, titled "Toward A More Accurate Measure Of The Cost Of Living" (but often referred to as the Boskin Report), summarized the viewpoint that the CPI was upwardly biased.2 The report asserted that the CPI overstated inflation because of three main reasons: it omitted consumer substitution, did not fully account for quality change, and failed to properly reflect the addition of new goods. BLS has introduced some methodological changes since the report came out in 1996. Although these changes were intended to make the CPI more accurate, some think that they have introduced a downward bias.
The financial community has criticized the CPI for having a downward bias, and this view is prevalent in the general public, especially among those who receive annual cost-of-living adjustments (COLAs) tied to the CPI. Some think the changes made in the CPI after the Boskin Report were a deliberate attempt to lower the CPI and result in a downward bias. Many consumers observe that price increases are sometimes hidden in the form of quantity or size decreases, and they incorrectly presume that the CPI fails to capture this phenomenon.
Substitution bias. Substitution bias arises if consumers change their purchasing behavior in response to relative price changes. Economic theory predicts that an increase in a good’s price will cause consumers to reduce their purchases of that good and instead purchase a substitute with a relatively lower price. The Boskin Report asserted that this was another important source of bias in the CPI, which at the time assumed no substitution. In 1999, BLS changed the way it calculated the CPI for many of the basic indexes, moving from a Laspeyres formula to a geometric means formula. (A basic index is an index for a particular item category and location; these basic indexes are the building blocks that are aggregated into the broader CPI measures, such as the all items index.) This new formula effectively presumes modest consumer substitution within item categories, correcting for what the Boskin Report termed “lower-level substitution bias.” That is, it assumes that consumers will substitute away from one brand or type of item, such as a steak or a car, as that brand or type becomes relatively more expensive compared with other brands or types of that product. It does not assume, however, substitution between steak and chicken or between cars and bus fare.
The geometric means formula does not correct for “upper-level substitution bias,” or substitution across item categories. Some argue that this omission is a reason that the CPI is still biased upward; others argue that the CPI should not assume any substitution at all. In any case, the use of geometric means for most categories has had the effect of lowering the CPI by 0.2 or 0.3 percent per year. (Some categories for which substitution is unlikely, such as shelter, utilities, and most medical care, are excluded.)
The Chained Consumer Price Index (C-CPI-U), a supplemental index introduced in 2002, uses updated expenditure weights; rather than make any assumptions about substitution, it derives it weights from expenditure measures both before and after a price change. It is thus free of upper-level substitution bias. As would be expected, it tends to run slightly lower than the regular CPI-U. Therefore, those who believe that upper-level substitution bias is important can focus on this measure.3
Quality change bias. The Boskin Report asserted there was an upward bias in the CPI from insufficient quality adjustment, and some argue that an upward bias still exists. Others believe that CPI quality adjustment procedures, particularly those adopted recently, create a downward bias. However, the idea that the CPI fails to capture price change disguised by size and quantity change is not correct. CPI procedures are designed to capture and reflect all sorts of changes.
To understand these issues, it is helpful to look at how the CPI responds to changes in the goods it prices. Operationally, the CPI measures quality change in several different ways. To price a given item, the CPI economic assistant in the field determines if the item has changed in any way (that is, if the item has been replaced with a new version). If there is a new version and the two are essentially the same, a commodity expert may deem them directly comparable and use the price comparison as if no quality change had occurred. If the versions are substantially different, then some sort of quality adjustment procedures must be used—either imputation procedures or direct quality adjustments. Although there are different types of imputation procedures, such procedures essentially mean that the price is assumed to change at the same rate as other similar items that month.
The simplest type of direct quality adjustment can be made when the difference is easily quantifiable, such as a size decrease. For example, if a new version of a candy bar is the same price as the old one, but it is now 1.8 ounces instead of 2.0 ounces, an 11-percent price increase will be recorded. (The per-ounce price increased about 11 percent.)
In other cases, direct quality adjustment may be used when the change is not simply a matter of a different size or quantity. In some cases, a technique called hedonic adjustment is used, which involves using regression techniques to estimate the value of specific bundles of characteristics, such as the sleeve link and fabric design of a shirt or the capacity and number of cycles of a dryer. Hedonic adjustment has generated a fair amount of attention and is sometimes criticized as being intentionally designed to lower the CPI. However, it is used on a fairly small part of the total index, and research suggests that the effect of hedonic techniques on the all items index is very small; hedonic adjustments result in faster price increases in some categories and slower increases in others, with the net effect close to zero.4
Because the CPI seeks to approximate a cost of living index (COLI), the CPI is, conceptually, a constant-quality index. Thus, when the quality of goods and services in the market basket changes, the CPI must make some estimate of the value of such changes. This is a source of controversy in the CPI, but disagreement over the valuation of changes in goods and services is expected when consumers have such widely varying preferences. Economists will continue to debate whether the CPI appropriately adjusts for quality or whether there is an upward or downward bias, though objective evidence suggests the effect is relatively small.
The market basket and new goods bias. The CPI reflects prices for a market basket of goods and services based on the spending of all urban consumers (for the CPI-U) or all urban wage earners and clerical workers (for the CPI-W). Each person has an individual market basket based on his or her own unique purchases. Those consumers whose market baskets are different from the average basket will probably experience inflation that is different from the CPI measure. In recent years, someone with high expenditures on gasoline and medical care experienced much higher inflation than someone who spent heavily on furniture, apparel, and electronics. The CPI cannot capture the inflation experience of individuals, but it is designed to be accurate for the population as a whole.
There is nonetheless a concern that the CPI should more accurately capture the inflation experience of certain groups that are disproportionately affected by the measure, such as the elderly. (Social Security payments are indexed by the CPI-W.) The CPI could conceivably create many different measures for subgroups of the population, but this is operationally difficult. For instance, the CPI-E, an experimental index based on the spending patterns of the elderly, captures the fact that the elderly spend more on prescription drugs. However, the sample of outlets, drugs, and prices used in the experimental CPI-E is the same as the sample used in the CPI-U and therefore may not represent the shopping habits of older Americans. To capture the inflation experience of the elderly and make the CPI-E more accurate, new surveys and procedures would have to be created.
The CPI includes frequently purchased “everyday” goods, such as food and gasoline, and also durable goods, such as cars, furniture, and appliances. Durable goods typically do not increase in price as fast as more frequently purchased goods, and this may lead to an incorrect perception that the CPI is inaccurate. Some may argue that the CPI should exclude durable goods and focus only on frequently purchased goods, but this has more to do with a fundamental disagreement over the purpose of the CPI than with any perceived improvement in accuracy.
A different problem is that the CPI market basket may not perfectly reflect what is being purchased in real time and may be slow to include new goods. The Boskin Report asserted this as an important source of bias because new goods often move down in price after they are introduced (think of DVD players, computers, and e-readers). BLS now updates the CPI market basket based on a new survey of consumer expenditures every 2 years, and rotates its sample of items every 4 years. These procedures are designed to keep the CPI market basket as up to date as possible.
Measurement of price change in a large economy is sufficiently complex that the accuracy of an estimate is difficult to gauge and is likely to be debated. The CPI cannot claim to be a completely precise measure of inflation and publishes the variance of its estimates. Several potential sources of bias have been identified in the CPI and addressed, though there continues to be debate over to what extent and in what direction bias may still exist and the ways in which BLS can continue to increase accuracy.
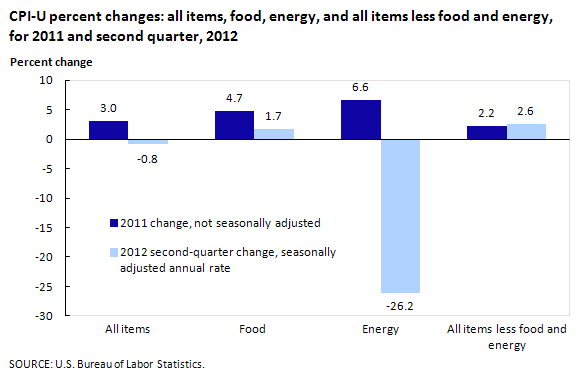
The U.S. all items Consumer Price Index for all Urban Consumers (CPI-U) decreased 0.8 percent during the second quarter of 2012. This follows an increase of 3.7 percent during the first quarter of 2012. During the 12 months ended in June 2012, the all items CPI-U increased 1.7 percent. From June 2007 to June 2012, the 5-year annualized increase in this index was 2.0 percent.
Quarterly price movements in the U.S. energy index explain the decrease in the all items CPI-U. From March 2012 through June 2012, the energy index decreased 26.2 percent. In contrast, the food index increased 1.7 percent. Excluding food and energy, the U.S. CPI-U increased 2.6 percent during the second quarter of 2012. (See chart 1.)
A trend in energy price movements has emerged with the most recent quarterly movement: beginning with the third quarter of 2011, the energy index has alternated from increasing one quarter, then decreasing the following quarter, and increasing again thereafter. Price movements continued this pattern when second quarter 2012 energy prices decreased by 26.2 percent, reversing the increase of 18.3 percent from the previous quarter. Annually, the energy index decreased 3.9 percent from June 2011 to June 2012. The index has increased at a 2.0-percent annualized rate from June 2007 to June 2012.
Both the household energy component and the motor fuel component of the energy index decreased during the second quarter of 2012. The household energy index decreased 7.3 percent during the quarter. The fuel oil and other fuels index was the main contributor in this movement, with a decrease of 37.7 percent. The motor fuel index decreased 37.1 percent, with the different grades of gasoline decreasing fairly uniformly during the quarter. The other motor fuels index, however, exhibited an even greater quarterly decrease, falling 52.6 percent from March 2012 to June 2012.
The gasoline index continues to strongly influence the quarterly price trends of the energy index. Like the energy index, second-quarter gasoline price movements reversed from the previous quarterly trend by decreasing 37.3 percent. Gasoline quarterly price movements have now reversed direction for three consecutive quarters, beginning with the quarterly decrease in the fourth quarter of 2011. For the second successive month, the gasoline index decreased annually for the month since the previous year, decreasing 4.3 percent since June 2011. Since June 2007, gasoline has increased at a 3.2-percent annualized rate.
The natural gas index has exhibited three consecutive quarters of price declines by decreasing 15.8 percent during the second quarter of 2012. Year-over-year, the index decreased 13.6 percent since June 2011. The last 12-month increase occurred in October 2010. From June 2007 to June 2012, the natural gas service index has decreased at annualized rate of 6.4 percent.
Retail food price inflation remained moderate through the second quarter of 2012, increasing 1.7 percent from March to June. This follows a similar increase of 1.5 percent during the first quarter of 2012. From June 2011 to June 2012, the food index increased 2.7 percent. The 5-year annualized change in this index from June 2007 to June 2012 was 2.9 percent.
An increase in the prices for food purchased for consumption away from home was the primary contributor to the quarterly increase in the aggregate food index. The food away from home index increased 3.0 percent during the second quarter, whereas the food at home index slightly increased 0.8 percent during the same period. The food away from home index has had a higher rate of quarterly inflation of more than 2 percentage points than the food at home index for two consecutive quarters. The food away from home index has increased 2.9 percent since June 2011, as well as since June 2007 on a 5-year annualized basis.
Offsetting price movements in the subcategories of the food at home index explain the muted quarterly price increase of this index. The fruits and vegetables and other food at home indexes increased 11.2 and 1.2 percent, respectively, during the second quarter. In contrast, the dairy and related products component decreased 6.5 percent, nonalcoholic beverages and beverage materials decreased 1.0 percent, meats, poultry, fish, and eggs decreased 0.7 percent, and the cereals and bakery products index decreased 0.5 percent from March 2012 to June 2012. Although the food at home index is little changed from the previous quarter, this index increased 2.6 percent between June 2011 and June 2012, and similarly has risen 2.9 percent since June 2007.
During the second quarter, the coffee index continued to decrease after the run-up in prices in the index in 2011, decreasing 11.1 percent from March 2012 to June 2012. The past quarter was also the third consecutive quarter in which the milk index decreased, falling 5.5 percent. Of the meats, poultry, fish, and eggs components, the eggs index was the only category increasing during the second quarter, reversing the price trend of the previous two quarters, with an increase of 23.3 percent.
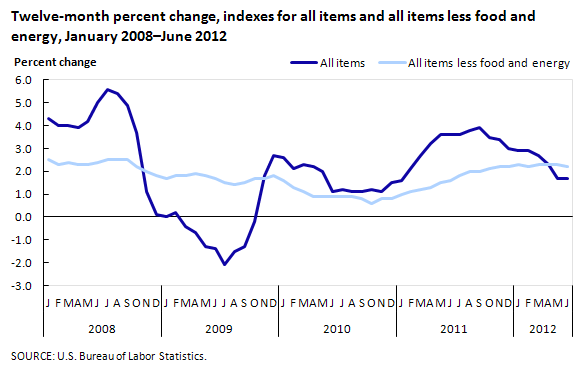
Excluding food and energy, the U.S. CPI-U increased 2.6 percent during the second quarter of 2012. “Core” inflation accelerated slightly over the first 6 months of 2012, increasing 2.4 percent, compared with a 2.0-percent increase over the 6 months ended in December 2011. For the 12 months ended in June 2012, this index increased 2.2 percent. (See chart 2.) From June 2007 to June 2012, the all items less food and energy index increased at an annualized rate of 1.8 percent, remaining below 2.0 percent since the fourth quarter of 2010.
Increases in the housing index continued to slow during the second quarter of 2012, with an increase of 0.8 percent during the 3 months ended in June. This is the third consecutive reduction in the quarterly rate of housing inflation, beginning with the fourth quarter of 2011. This is principally due to the persistent quarterly decreases in the household fuels and utilities index since the fourth quarter of 2011.
The shelter component of the housing index increased 1.8 percent during the second quarter of 2012, following an increase of 2.2 percent during the first quarter. The rent of primary residence component continued to exhibit a reduction in the rate of increase, which began in the fourth quarter of 2011, rising 2.1 percent in second quarter of 2012. During the 6 months ended in June 2012, the rent index increased 2.2 percent, compared with 3.2 percent during the second half of 2011. The owners’ equivalent rent of primary residence also increased at a slower rate during the second quarter, with an increase of 1.5 percent. This also corresponds with a reduced rate of inflation for the first half of 2012 compared with the second half of 2011.
The transportation index decreased by 12.4 percent during the second quarter of 2012, and like the housing index, this is largely explained by the energy components of the transportation index. Aside from the various motor fuel indexes, the only other components that exhibited quarterly price decreases were the leased cars and trucks index and the state motor vehicle registration and license fees index.
The medical care index increased 5.2 percent during the 3 months ended in June 2012. This is due in large part to the medical care services component of the index, which increased 6.9 percent during the same period. Medical care commodities, however, were nearly unchanged from the previous quarter, with an increase of only 0.2 percent. Despite the contrast in price movements during the second quarter, both the commodities and services components of the medical care index exhibited an acceleration of inflation during the first half of 2012 compared with the second half of 2011. Year-over-year, the medical care index increased 4.0 percent since June 2011.
The rate of inflation for apparel, which had been declining for three consecutive quarters, exhibited an uptick to 5.1 percent during the second quarter of 2012. The men’s, women’s, girls’, and infants’ and toddlers’ apparel indexes, and the footwear index, increased during the quarter. In contrast, the boys’ apparel and jewelry and watches indexes decreased over the period.
The recreation index increased 1.3 percent during the second quarter of 2012. The televisions index continued to exhibit considerable decreases from quarter to quarter, with a decrease of 23.9 percent. Furthermore, the recreational books index has also begun to exhibit a downward trend from quarter to quarter. Since 2010, this index has decreased or remained unchanged on a quarterly basis for 8 of the 10 quarters during this period. During the second quarter, the recreational books index decreased 4.3 percent.
Personal computers and peripheral equipment, a component of the communication index, recorded a rare quarterly increase during the second quarter of 2012, increasing 2.5 percent. Since 2005, this index has decreased each quarter except for the third quarter of 2010 and this most recent increase.
The communication index recorded a slight increase of 0.8 percent during the second quarter of 2012. The education index also rose, increasing 3.9 percent, with all education subcomponents increasing except for the technical and business school tuition and fees index. In aggregate, the education and communication category increased 2.3 percent during the quarter.
The other goods and services index increased 2.0 percent during the 3 months ended through June 2012. The financial services component recorded a considerable quarterly increase, mainly due to an increase in the tax return preparation and other accounting fees index, increasing 14.4 percent from March 2012 to June 2012.
In conclusion, four of the eight major U.S. CPI-U index groups exhibited slower rates of growth compared with the first quarter of 2012. The transportation index decreased during the second quarter, due to a decrease in the motor fuel index. The quarterly decrease of 0.8 percent in the all items index resulted because of the considerable quarterly decrease in the energy index; excluding energy, the all items less energy index increased 2.5 percent during the second quarter of 2012.
Price movements described in this text reflect data released on July 17, 2012. All percent changes of 12 months or greater reflect data that are not seasonally adjusted. Data are annualized if the period covered is greater than a year. Percent changes covering less than a year are based on seasonally adjusted annual rates, unless otherwise noted. CPI seasonally adjusted indexes and percent changes are subject to annual revision.
This BEYOND the NUMBERS summary was prepared by Stephen B. Reed and Darren A. Rippy, economists in the Office of Prices and Living Conditions, U.S. Bureau of Labor Statistics. Email: rippy.darren@bls.gov. Telephone: (202) 691-5377.
Information in this article will be made available to sensory-impaired individuals upon request. Voice phone: (202) 691-5200. Federal Relay Service: 1-800-877-8339. This article is in the public domain and may be reproduced without permission.
Stephen B. Reed and Darren A. Rippy, Consumer Price Index program, “Consumer Price Index data quality: how accurate is the U.S. CPI?” Beyond the Numbers: Prices & Spending, vol. 1, no. 12 (U.S. Bureau of Labor Statistics, August 2012), https://www.bls.gov/opub/btn/volume-1/consumer-price-index-data-quality-how-accurate-is-the-us-cpi.htm
1 See Owen J. Shoemaker, “Variance Estimates for Price Changes in the Consumer Price Index January–December 2011,” CPI Detailed Report, February 2012, https://www.bls.gov/cpi/tables/variance-estimates/2011.pdf.
2 Michael J. Boskin, E. Dulberger, R. Gordon, Z. Griliches, and D. Jorgenson, “Toward a More Accurate Measure of the Cost of Living,” Final Report to the Senate Finance Committee, December 4, 1996, http://www.ssa.gov/history/reports/boskinrpt.html/.
3 Information about the C-CPI-U is available here: https://www.bls.gov/cpi/additional-resources/chained-cpi.htm.
4 David S. Johnson, Stephen B. Reed, and Kenneth J. Stewart, “Price measurement in the United States: a decade after the Boskin Report,” Monthly Labor Review, May 2006, pp. 10–19, https://www.bls.gov/opub/mlr/2006/05/art2full.pdf.
Publish Date: Tuesday, August 21, 2012