An official website of the United States government
An official website of the United States government
The .gov means it's official.
Federal government websites often end in .gov or .mil. Before sharing sensitive information,
make sure you're on a federal government site.
The site is secure.
The
https:// ensures that you are connecting to the official website and that any
information you provide is encrypted and transmitted securely.

More BLS articles and information related to international prices are available online at the following links:
In recent years, there has been much attention paid to the ability of U.S. industries, and manufacturers in particular, to compete with foreign imports. With that attention has come the corresponding need for additional data to provide further insights into globalization. For the past 20 years, the Bureau of Labor Statistics (BLS) has provided price indexes for imports from a limited set of countries and regions. Until now, however, the usefulness of the data as a potential measure of competitiveness has been limited by the lack of any locality of origin data by industry sector.
To help fill this data gap, the International price Program of BLS has expanded the existing import price indexes by locality of origin to include more detail below the “all import” level of aggregation. Beginning on August 10, 2012, there will be 249 new indexes, in addition to the locality of origin indexes previously published. These indexes cover select industry sectors across the 15 currently published localities, including 31 new price indexes covering imports from China and 20 for imports from the European Union. Prior to the expansion, the only price indexes published below the all import level were the broad groupings for manufactured and non-manufactured goods. The new Locality of Origin price indexes are published using the North American Industrial Classification System (NAICS), the same classification system used to aggregate the Producer Price Indexes (PPI). Having more detailed price data available for imports from different countries and regions will improve the analysis of price trends between domestic and imported goods.
BLS began publishing import price indexes by locality of origin in 1992. Initially, the indexes covered developed countries, developing countries, Canada, the European Economic Community, Japan, and the Asian Newly Industrialized Countries (ANIC).1 Those localities were chosen because they represented the major U.S. import trade partners at the time. By 2004, however, trade patterns had changed, leading BLS to expand the list of published import price indexes by locality of origin to include new countries and regions. Starting in 2005, price indexes were added for imports from China, Mexico, Germany, France, the United Kingdom, the Pacific Rim countries, the Association of Southeast Asian Nations (ASEAN), and the countries from the Asia/Near East region.2 A number of criteria were used to determine which new localities to publish including areas of public interest, dollar value of import trade, statistical goodness-of-fit tests, and tests for statistical variance.3 For the most recent expansion, although no new countries or regions were added to the list of published indexes, the existing locality of origin indexes were expanded to include greater industry level data. The expanded list of published indexes now includes select indexes at the 2-, 3-, and 4-digit NAICS classification levels. For this expansion also, indexes were chosen primarily based on the dollar value of trade, with consideration given to the statistical goodness-of-fit of the sample for each index, and the sample variance.
Producing price indexes based on where goods imported from are useful for two reasons 1) the U.S. dollar’s fluctuation against foreign currencies has an impact on internationally traded products; and 2) the types of products being traded differ across localities. Therefore, price indexes across localities should exhibit different trends that could not otherwise be observed from the world goods price indexes.
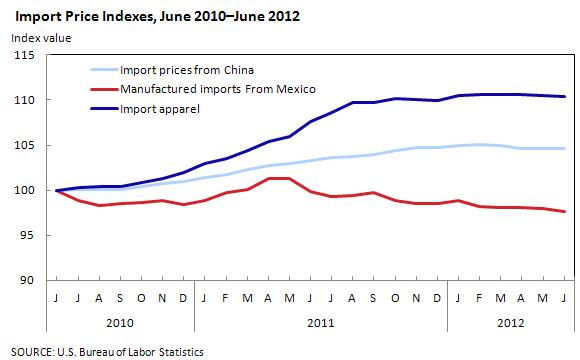
An example of the first reason is import apparel prices. The United States imports apparel from many countries, including China and Mexico. Some factors impacting price movement, such as the large run-up in raw cotton prices in 2010 and 2011, are true regardless of where the goods are imported from. But other factors, such as exchange rate changes, will impact only items imported from a specific country or region. The Chinese yuan appreciated following the decision by the Chinese central bank in June 2010 to let their currency float versus the U.S. dollar. The purchasing power of the U.S. dollar to buy Chinese imports subsequently fell, which is considered a major factor in an increase in import prices from China. Import prices from China increased 4.6 percent between June 2010 and June 2012, after recording virtually no change from the time the China locality of origin index was first published in December 2003. The impact of the appreciation of the yuan against the U.S. dollar put upward pressure on apparel prices coming from China, compared with other countries, such as Mexico.
Over the past 2 years, all import prices for apparel rose at a much higher rate than the price of overall imports from China. (See chart 1.) However, in the case of Mexico, import prices fell.4 Alternatively, import apparel prices from China and Mexico may have advanced less than the price of imported apparel from the rest of the world. The new locality of origin indexes will allow for further analysis of price changes, not only by country, but by industry sector.
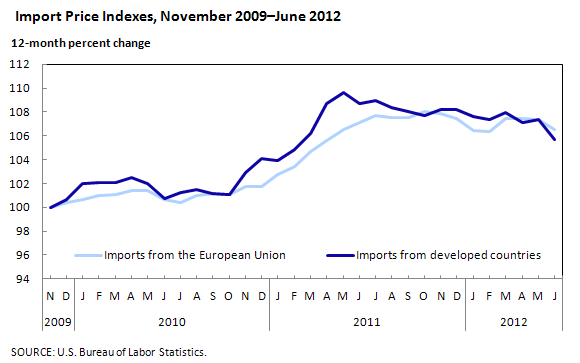
Another recent event that helps illustrate the second usefulness of locality of origin indexes is the European debt crisis. The 2-½ year-old crisis has hurt both the European economy and damaged the viability of the euro, which has lost value against most major currencies, including the U.S. dollar. The sharp depreciation in the value of the euro against the dollar should have led to lower import prices, as the purchasing power of the dollar rose relative to the euro. The economic slowdown in Europe reduced the domestic demand for European goods, which also should have put downward pressure on the price of imports from the European Union.
On the contrary, as seen in chart 2, prices of imports from the European Union have risen 6.5 percent, compared with a 5.7-percent increase in the price of imports coming from all industrialized countries.5
Why did import prices from the European Union rise slightly more than from imports from all industrialized countries? One factor may be the different mix of items that are imported from Europe, compared with other areas. Comparing the European Union and Canada (another industrialized country that is an important trade partner of the United States), the manufacture of intermediate goods, such as the mining and wood industries are more important import components from Canada, whereas imports from the European Union are dominated by finished goods. Breaking out key industry sectors now will be a better way to analyze the impact of debt crises and other economic events on import prices.
The new locality of origin indexes begin in June 2012, and can be accessed through a number of methods on the BLS homepage. Indexes will appear in both the historical tables (www.bls.gov/web/ximpim/coor.htm) and the index and percent change tables (www.bls.gov/web/ximpim/ippsloor.htm). The data also can be accessed using the MXP databases utility (www.bls.gov/mxp/#data).
Import prices The price index for overall imports decreased 4.0 percent in the second quarter of 2012, following a 1.4-percent increase in the first quarter of the year. Driving up the price index for overall imports was a 14.9-percent decline in the index for imports of fuels and lubricants. The price index for nonfuel imports also declined in the second quarter of 2012, decreasing 0.2 percent. The largest movements occurred in the final month of the quarter.
Fuel import prices.The drop in the index for imports of fuels and lubricants followed a 4.1-percent increase in the first quarter. The quarterly decline was the largest since the index fell 55.6 percent in the fourth quarter of 2008. Although the index decreased in all 3 months, the quarterly decline was brought about by decreases of 4.6 percent and 10.1 percent in the final 2 months.
The drop in petroleum prices during the second quarter, falling 15.1 percent, was the major contributor to the overall decrease in the price index for fuels and lubricants. Although petroleum prices declined in all 3 months of the quarter, the most significant decreases occurred in May and June, when the price index for petroleum fell 4.7 percent and 10.5 percent, respectively. Petroleum prices are now at their lowest point in over a year. The decline in June was attributed to economic news from China, which is the world’s second largest oil consumer. The country reported a sharp decline in both investment growth and industrial production growth, giving rise to fears that China’s economy was slowing down.6 Fiscal worries in Europe were also reported to have contributed to the May decline. The recapitalization of Spain’s fourth largest bank stoked fears that the nation’s economic troubles, as well as those of Greece, Portugal, and Italy, would spark a recession in Europe and possibly worldwide, thus curtailing the demand for oil.7 Signs of a slowdown of manufacturing in the United States also reportedly contributed to the drop in oil prices. For example, the U.S. Federal Reserve Bank of Philadelphia reported a 16.6-percent drop in its regional manufacturing index.8
The price index for natural gas decreased 11.0 percent in the second quarter of 2012, the fourth consecutive quarter the index has fallen. In April and May the index declined 14.3 percent and 3.3 percent, respectively. A production boom in the United States has kept the nation’s stockpiles at high levels, while a mild winter brought about a decrease in demand.9 In June, however, the price index for natural gas increased 7.4 percent. Above normal temperatures across much of the United States resulted in an increase in electricity usage, which drove up natural gas prices.10
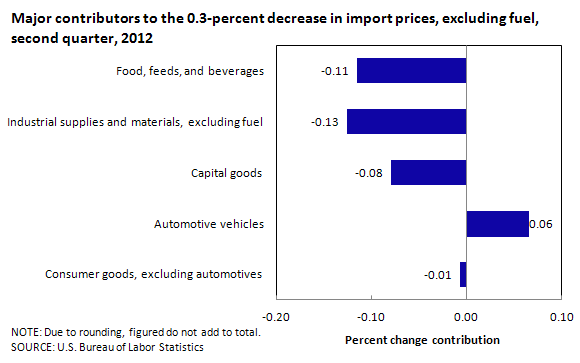
Nonfuel import prices. The price index for imports excluding fuels and lubricants fell 0.2 percent in the second quarter of 2012, with the quarterly decrease largely the result of a 0.3-percent decline in the month of June. As seen in chart 3, falling prices for industrial supplies and materials, excluding fuel; foods, feeds, and beverages; and capital goods drove the overall decline. The price index for consumer goods had a negligible contribution to the decline, while the automotive vehicles index increased for the quarter.
Industrial supplies and materials, excluding fuel declined 0.7 percent in the quarter, with all of the decrease occurring in the month of June, when the index fell 1.3 percent. Decreasing prices for nonmonetary gold and other precious metals were the primary contributors to the decline. The price index foods, feeds, and beverages was driven down by falling prices for food oils and oilseeds as well as fruit and fruit preparations.
The other import price indexes had much less significant impact on the overall movement of imports excluding fuel. Capital goods prices decreased 0.3 percent, consumer goods remained unchanged, and automotive vehicles rose 0.4 percent.
Export prices In the second quarter of 2012, the price index for overall exports decreased 1.8 percent, following a 1.5-percent increase in the first quarter of the year. Prices for agricultural commodities declined 1.4 percent in the first quarter, after rising 3.2 percent the previous quarter, while nonagricultural exports fell 1.8 percent between March and June, after increasing 1.3 percent during the preceding 3 months.
Agricultural export prices The 1.4-percent quarterly decrease in export agricultural prices during the second quarter of 2012 was due largely to a 4.0-percent decline in the month of June, and more than offset a 2.0-percent increase in April. The advance in April was due to a 7.4-percent increase in soybean prices, which was brought about by a perceived tightening in supplies. The U.S. Department of Agriculture announced that U.S. farmers intended to sow 1.4 percent fewer acres in soybeans than the previous year.11 Falling prices for soybeans and corn, which decreased 9.0 percent and 8.3 percent, respectively, were largely responsible for the index decline in June. Despite the dry weather that persisted through much of the agricultural heartland of the United States, soybean and corn prices fell, apparently, due to concerns about a slowdown of the global economy and a resulting softening in demand.12
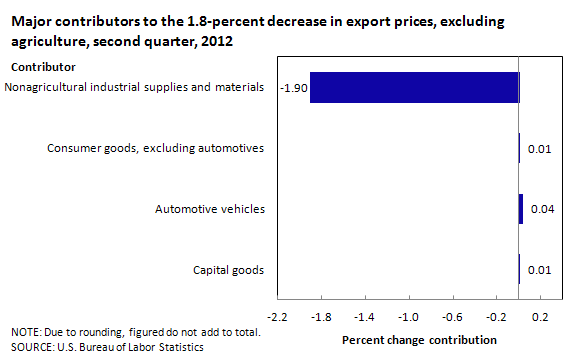
Nonagricultural export prices The price index for nonagricultural exports decreased 1.8 percent in the second quarter of 2012, after increasing 1.3 percent in the previous quarter. As seen in chart 4, nonagricultural industrial supplies and materials was the primary contributor to the index’s movement, while the other indexes had a negligible impact on nonagricultural exports.
Prices for nonagricultural industrial supplies and materials declined 5.1 percent during the second quarter. Falling prices for fuels and lubricants were the major contributors to the declines in each of the months. As with imports, the drop in oil prices was attributable to growing concerns regarding the state of the global economy and the demand for petroleum.
The price index for automotive vehicles increased 0.4 percent during the second quarter. Consumer goods rose 0.1 percent in the second quarter of 2012, while capital goods remained unchanged.
This BEYOND THE NUMBERS report was prepared by Edwin Bennion, an economist, and David Mead, a supervisory economist, both in the International Price Program, Office of Prices and Living Conditions. Email: MXPinfo@bls.gov. Telephone: 202-691-7101.
Edwin Bennion and David Mead, International Price Program, “Bureau of Labor Statistics introduces new locality of origin import price indexes by industry sector,” Beyond the Numbers: Global Economy, vol. 1, no. 7 (U.S. Bureau of Labor Statistics, August 2012), https://www.bls.gov/opub/btn/volume-1/bureau-of-labor-statistics-introduces-new-locality-of-origin-import-price-indexes-by-industry-sector.htm
1 The developed and developing countries were later renamed the industrialized and other countries. The European Economic Community became the European Union in 1993, and the index title was changed to reflect that.
2 A price index for imports from Latin America had been added in 2002.
3 For more information on the various tests done to determine which locality of origin indexes to publish, see McCulley, Helen and Swartz, Melissa, “IPP introduces additional Locality of Origin Indexes,” BLS Monthly Labor Review, December 2005, www.bls.gov/opub/mlr/2005/12/progrpt.pdf.
4 For Mexico, the comparison is with all manufactured imports from Mexico, rather than all imports, to factor out the volatile petroleum industry. Petroleum is a major import from Mexico, but not from China.
5 In addition to the European Union, the industrialized countries are Canada, Japan, Australia, New Zealand, and South Africa.
6 “Oil Price Declines on Slower China Growth” The Associated Press, May 11, 2012.
7 Steve Hargreaves, “Oil Prices Drop Below $88 to 7-Month Low” Money, May 30, 2012, http://money.cnn.com/2012/05/30/investing/oil_prices/index.htm.
8 Emily Jane Fox, “Oil Prices Continue Their Slide” Money, June 21, 2012, http://money.cnn.com/2012/06/21/investing/oil_prices/index.htm.
9 Chris Kahn, “Natural Gas Drops 2.4 Percent; Oil Back Above $103” Businessweek April 5, 2012, www.businessweek.com/ap/2012-04/D9TV058G0.htm<.
10 Christine Buurma, “Natural Gas Climbs to Five-Month High on Outlook for Hot Weather” Businessweek, June 27, 2012, www.businessweek.com/news/2012-06-27/natural-gas-climbs-to-five-month-high-on-outlook-for-hot-weather.
11 “Oil Crops Outlook” U.S. Department of Agriculture, April 11, 2012, www.ers.usda.gov/media/512526/ocs-04-11-2012_1_.pdf.
12 Julie Ingwersen, “GARINS-Corn, Soy, Wheat Fall on Global Growth Worries” Reuters, June 22, 2012.
Publish Date: Thursday, August 9, 2012