An official website of the United States government
An official website of the United States government
The .gov means it's official.
Federal government websites often end in .gov or .mil. Before sharing sensitive information,
make sure you're on a federal government site.
The site is secure.
The
https:// ensures that you are connecting to the official website and that any
information you provide is encrypted and transmitted securely.

More BLS articles and information related to air transportation are available online at the following links:
Air transportation1 is a popular form of travel in the United States and a thriving industry in the Atlanta metropolitan area, primarily Fulton County. Fulton County’s employment concentration for air transportation is higher than any other industry, and pays higher wages than the Fulton County average for all private industry. A major reason for the prominence of air transportation within Fulton County is that it houses the world’s busiest airport, Hartsfield-Jackson Atlanta International. Overall, the airport serves more than 150 domestic destinations and 80 international destinations in 52 countries,2 along with being the state of Georgia’s largest employer. It has been the world’s busiest passenger airport3 since 1998 and the world’s busiest operations airport4since 2005. The local air transportation industry has faced several significant challenges over a recent 20-year period (1990–2010) including the interplay of rising fuel costs, the 9/11 attacks, and fewer passengers due to three economic recessions. These events have contributed to numerous airline bankruptcies and consolidations, which have reshaped the industry. Meanwhile, airport improvements at Hartsfield-Jackson have greatly improved efficiency.
This issue of Beyond the Numbers uses data from the Bureau of Labor Statistics Quarterly Census of Employment and Wages (QCEW) for the air transportation industry to compare employment in Fulton County, Georgia, (Hartsfield-Jackson Airport), with employment in Cook County, Illinois,5 (O’Hare International Airport), and Los Angeles County, California, (Los Angeles International Airport). After Fulton County, Cook and Los Angeles Counties housed the next busiest airports in the United States. This article compares total passengers and aircraft operations among the busiest airports in the United States using data from Airports Council International.6
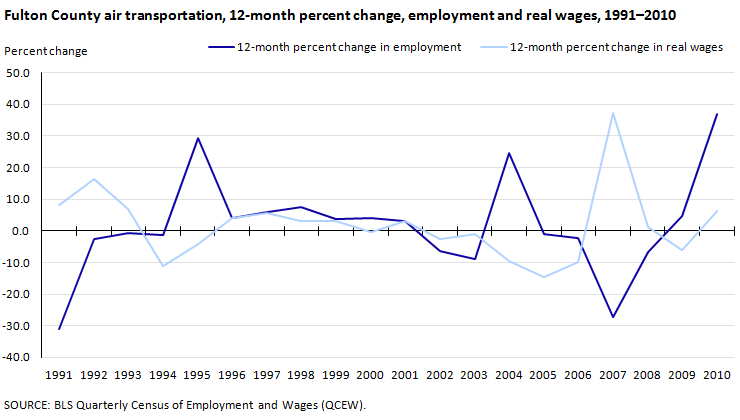
In 1990, there were 14,887 people employed in the air transportation industry in Fulton County, Georgia. (See table 1.) Over the 20 years, employment recorded an annual average low of 9,776 in 1994 and a high of 17,643 in 2004. Large over-the-year employment increases were experienced in 1995 (29.4 percent), 2004 (24.4 percent), and 2010 (36.9 percent). (See chart 1.) However, large over-the-year employment decreases were experienced in 1991 (31.0 percent) and 2007 (27.4 percent). In 2010, 16,594 people were employed in the air transportation industry in Fulton County, reflecting an 11.5-percent increase over the 20-year period. This compares with a 22.2-percent increase in all private industry. In 2010, Hartsfield-Jackson Airport serviced more than 89 million passengers and performed more than 950,000 aircraft operations, ranking it first among U.S. airports in those categories. (See table 3.) While Fulton County’s air transportation employment increased over 20 years, the industry sustained losses in Los Angeles County (48.1 percent), Cook County (17.4 percent), and the United States as a whole (11.9 percent) over the same period. Despite these employment declines, O’Hare and Los Angeles International ranked second and third, respectively, among U.S. airports for total passengers and aircraft operations in 2010.
| Area | 1990 | 2010 | Change, 1990-2010 | |
|---|---|---|---|---|
| Number | Percent | |||
|
United States |
||||
|
All private industry employment |
90,855,141 | 106,201,232 | 15,346,091 | 16.9 |
|
Air transportation employment |
508,818 | 448,145 | -60,673 | -11.9 |
|
Air transportation share of total private employment |
0.6% | 0.4% | ... | ... |
|
Air transportation location quotient |
1.0 | 1.0 | ... | ... |
|
All private industry average annual salary |
$23,262 | $46,455 | $23,193 | 99.7 |
|
Air transportation average annual salary |
$35,421 | $60,114 | $24,693 | 69.7 |
|
Fulton County, Georgia |
||||
|
All private industry employment |
498,659 | 609,266 | 110,607 | 22.2 |
|
Air transportation employment |
14,887 | 16,594 | 1,707 | 11.5 |
|
Air transportation share of total private employment |
3.0% | 2.7% | ... | ... |
|
Air transportation location quotient |
5.3 | 6.5 | ... | ... |
|
All private industry average annual salary |
$27,611 | $63,438 | $35,827 | 129.8 |
|
Air transportation average annual salary |
$34,408 | $73,681 | $39,273 | 114.1 |
|
Cook County, Illinois |
||||
|
All private industry employment |
2,280,163 | 2,041,915 | -238,248 | -10.4 |
|
Air transportation employment |
37,324 | 30,842 | -6,482 | -17.4 |
|
Air transportation share of total private employment |
1.6% | 1.5% | ... | ... |
|
Air transportation location quotient |
2.9 | 3.6 | ... | ... |
|
All private industry average annual salary |
$27,648 | $55,185 | $27,537 | 99.6 |
|
Air transportation average annual salary |
$36,331 | $67,956 | $31,625 | 87.0 |
|
Los Angeles County, California |
||||
|
All private industry employment |
3,762,779 | 3,293,535 | -469,244 | -12.5 |
|
Air transportation employment |
33,205 | 17,217 | -15,988 | -48.1 |
|
Air transportation share of total private employment |
0.9% | 0.5% | ... | ... |
|
Air transportation location quotient |
1.6 | 1.2 | ... | ... |
|
All private industry average annual salary |
$27,642 | $52,027 | $24,385 | 88.2 |
|
Air transportation average annual salary |
$37,983 | $59,664 | $21,681 | 57.1 |
|
Source: U.S. Bureau of Labor Statistics' Quarterly Census of Employment and Wages (QCEW) |
||||
For Fulton County, several factors have contributed to changes in employment over the 20-year period. The United States experienced three economic recessions during the years covered by this report: July 1990–March 1991; March 2001–November 2001; and December 2007–June 2009.7 The air transportation industry is sensitive to declines in economic activity as individuals and businesses tend to scale back travel during recessions. This was reflected by over-the-year employment declines in air transportation in 1991, 2002–2003, and 2007–2008. The 9/11 attacks harmed the entire air transportation industry by grounding several aircraft, depriving airlines of cash for operations, and shaking travelers’ confidence; these led to a reduction in the number of flyers, intensifying losses to an industry already experiencing financial hardship. Starting in 2001, Arrow Air, Midway Airlines, Swiss Air, and Sabena Airlines all ceased operating out of Atlanta. Bankruptcies followed for several airlines operating out of Hartsfield-Jackson.8 United and Vanguard Airlines both filed chapter 11 bankruptcies in 2002, Air Canada, in 2003, and U.S. Airways, in 2004. Delta Airlines, with its primary hub at Hartsfield-Jackson, declared bankruptcy in September 2005 and emerged from it April 2007.9 In October 2008, Delta merged with Northwest Airlines to form a new enterprise, Delta, the world’s largest airline according to several different measures. Pilots of both airlines agreed to a common union contract and the two airlines began flying as a single carrier in January 2010.10
Location quotients measure the employment concentration of an industry for different areas, and show whether the employment share of an industry in the local economy is greater or less than that in the United States as a whole. A location quotient below 1.0 indicates that an industry is less concentrated in the local area than the United States, while a location quotient greater than 1.0 indicates that an industry is more concentrated in the local area. Air transportation in Fulton County recorded a location quotient of 5.3 in 1990. In 2010, that number grew to 6.5, the largest location quotient of any industry in Fulton County.11 (See chart 2.) By comparison, air transportation in Cook County recorded a location quotient of 2.9 in 1990 and 3.6 in 2010. Los Angeles County air transportation registered a location quotient of 1.6 in 1990 and 1.2 in 2010. The industry’s rising profile in the Atlanta area is due in part to several capacity-adding construction projects at Hartsfield-Jackson. An international concourse was opened in September 1994, in part to accommodate visitors coming to the 1996 Summer Olympic Games, but having the lasting effect of increasing capacity for international flights. In addition, the city of Atlanta began construction on a fifth runway in May 2001 that was completed in May 2006. The 9,000-foot runway, the first runway constructed since 1984, increased capacity for takeoffs and landings by 40 percent, thereby increasing the average number of flights per hour from 184 to 237.12 To complement the runway, the city of Atlanta and the Federal Aviation Administration (FAA) built a 398-foot control tower, the tallest in North America.
Workers in Fulton County earned an average of $34,408 in the air transportation industry in 1990; by 2010, wages had more than doubled to $73,681. After deflating these wages to account for rising prices, real wages for air transportation in Fulton County grew 28.3 percent over the 20-year period. (See table 2.) Real wages in Fulton County’s air transportation industry saw their largest over-the-year gains in the early 1990s and 2007.13 The greatest declines occurred during 1994 and the mid-2000s. The average annual salary for workers in the air transportation industry in Cook County was $36,331 in 1990, increasing to $67,956 in 2010. After applying the deflator, air transportation wages in Cook County increased 12.1 percent over 20 years. Wages for air transportation workers in Los Angeles County increased from $37,983 in 1990 to $59,664 in 2010. Real wages for air transportation in Los Angeles County declined 5.9 percent from 1990 to 2010. Over the 20-year period, real wages in the air transportation industry have grown at a slower pace than wages for all private industry in each of the geographical areas. There are several factors that affect wages in the air transportation industry. Unions represent various worker groups, particularly pilots and flight attendants, in the air transportation industry and wage changes can be partially attributed to the negotiations between unions and the airlines.14 Wages and jet fuel are the two largest operating expenses to airlines, with jet fuel representing a larger share of the total over the last several years of this report.15 Jet fuel costs spiked in the fourth quarter of 1990 but dropped and remained steady for the rest of the decade. Fuel costs rose throughout the 2000s, peaked in 2008, and declined the following 2 years, still high by historical standards. Higher operating costs along with poor economic conditions have combined to put more pressure on wages. In spite of these factors, wage gains were experienced in Fulton County’s air transportation industry in 2010.
| Area | 1990 | 2010 | Percent Change |
|---|---|---|---|
|
United States |
|||
|
All Private |
$17,798 | $21,300 | 19.7 |
|
Air Transportation |
$27,101 | $27,563 | 1.7 |
|
Percent Difference |
52.3 | 29.4 | ... |
|
Fulton County, Georgia |
|||
|
All Private |
$21,125 | $29,087 | 37.7 |
|
Air Transportation |
$26,326 | $33,783 | 28.3 |
|
Percent Difference |
24.6 | 16.1 | ... |
|
Cook County, Illinois |
|||
|
All Private |
$21,154 | $25,303 | 19.6 |
|
Air Transportation |
$27,797 | $31,158 | 12.1 |
|
Percent Difference |
31.4 | 23.1 | ... |
|
Los Angeles County, California |
|||
|
All Private |
$21,149 | $23,855 | 12.8 |
|
Air Transportation |
$29,061 | $27,356 | -5.9 |
|
Percent Difference |
37.4 | 14.7 | ... |
|
Source: BLS Quarterly Census of Employment and Wages (QCEW) |
|||
Air transportation is a vital industry to the economies of metropolitan Atlanta and Fulton County, Georgia. Air transportation’s share of total employment is more than 6 times greater in Fulton County than it is in the United States and salaries paid to workers in the industry are 16 percent higher than the county average. Hartsfield-Jackson’s position as the world’s busiest airport has broad economic effects for the Atlanta metropolitan area.
Despite the challenges that the airline industry has faced between 1990 and 2010, flying continues to be a popular form of travel in the Atlanta metropolitan area, the United States, and throughout the world. This has allowed Hartsfield-Jackson Airport to make several significant investments, ensuring that Atlanta will continue to be a major player in the world of air transportation for years to come.
| Airport | Total passengers | U.S. rank | 12-month percent change | Aircraft operations | U.S. rank | 12-month percent change |
|---|---|---|---|---|---|---|
|
Hartsfield-Jackson International Airport |
89,331,622 | 1 | 1.5 | 950,119 | 1 | -2.1 |
|
O'Hare International Airport |
66,774,738 | 2 | 4.1 | 882,617 | 2 | 6.6 |
|
Los Angeles International Airport |
59,070,127 | 3 | 4.5 | 666,938 | 3 | 4.8 |
|
Source: Airports Council International North America |
||||||
This Beyond the Numbers report was prepared by Matthew Dotson, an economist in the Information Office, U.S. Bureau of Labor Statistics. Email: dotson.matthew@bls.gov ; telephone: (404) 893-4225
Information in this article will be made available to sensory-impaired individuals upon request. Voice phone: (202) 691-5200. Federal Relay Service: 1-800-877-8339. This article is in the public domain and may be reproduced without permission.
Matthew Dotson, “Atlanta’s thriving air transportation industry: employment and wages, 1990–2010,” Beyond the Numbers: Regional Economies, vol. 1, no. 10 (U.S. Bureau of Labor Statistics, August 2012), https://www.bls.gov/opub/btn/volume-1/atlantas-thriving-air-transportation-industry-employment-and-wages-1990-2010.htm
1 The air transportation industry refers to the 3-digit North American Industry Classification System (NAICS) code 481 Air Transportation.
2 Information about Hartsfield-Jackson Atlanta International Airport is from the airport’s main website: http://www.atlanta-airport.com.
3 A passenger is defined as someone who arrives in, departs from, or transfers through the airport on a given day.
4 Aircraft operations or traffic movements include the landing and takeoff of an aircraft.
5 Chicago O’Hare and Chicago Midway International Airports are both located in Cook County, Illinois, although data for both airports are included in the data for Cook County, Midway does not rank among the busiest airports in the United States.
6 Airports Council International (ACI) is the association of the world’s airports. The ACI produces the World Airport Traffic Report, which is considered the most comprehensive source of global airport traffic data available on the market based on traffic data from over 1,350 airports worldwide.
7 The National Bureau of Economic Research’s Business Cycle Dating Committee maintains a chronology of alternating peaks and troughs of economic activity for U.S. business cycles. The committee defines the period between a peak and a trough as recessionary or non-recessionary, by examining and comparing the behavior of various measures of broad economic activity and applies its judgment when defining recessions.
8 Triphenya Bailey, “Atlanta Airport Continues Operating during Airline Bankruptcies,” Hartsfield-Jackson News, March 2006, http://www.atlanta-airport.com/hjn/2006/03/fa2.htm.
9 Dean Foust, “How Delta Climbed out of Bankruptcy,” Bloomberg Businessweek, May 14, 2009, http://www.businessweek.com/magazine/content/09_21/b4132036798289.htm.
10 Jad Mouawad, “Delta-Northwest Merger’s Long and Complex Path,” The New York Times, May 18, 2011, http://www.nytimes.com/2011/05/19/business/19air.html.
11 A comparison of industry location quotients in Fulton County, Georgia was conducted at the 3-digit NAICS level for those industries with data available in 2010.
12 “Atlanta International Airport: Benchmark Results” from the FAA.
13 Wages were deflated using the Bureau of Labor Statistics’ Consumer Price Index, CPI-U, and numbers for all urban consumers in the United States for each year corresponding to that year’s Quarterly Census of Employment and Wages annual average salary data.
14 Union membership varies by airline and worker group and is in no way standard across the industry or by airport.
15 Operating expenses data is from the Bureau of Transportation’s Research and Innovative Technology Administration and filings with the Securities and Exchange Commission.
Publish Date: Sunday, August 19, 2012