An official website of the United States government
An official website of the United States government
The .gov means it's official.
Federal government websites often end in .gov or .mil. Before sharing sensitive information,
make sure you're on a federal government site.
The site is secure.
The
https:// ensures that you are connecting to the official website and that any
information you provide is encrypted and transmitted securely.

More BLS related articles and information related to are available online at the following links:
Since the 1980s, school systems in the United States have made efforts to increase the rigor of high school coursework. Following the 1983 report, “A Nation at Risk,” which decried the status of primary and secondary education in the United States, most states instituted tougher graduation requirements.1 Recent reforms have made higher level courses mandatory for graduation.2 Over the same period, the value of a college education has increased substantially.3 The importance of college may have caused more high school students to choose rigorous coursework in order to be better prepared for college.
This analysis examines how the relationship between high school courses and college attendance may have changed between the late 1970s and the late 1990s. The article uses two data sources: the National Longitudinal Survey of Youth 1979 (NLSY79), a nationally representative sample of 12,686 men and women born from 1957 to 1964 and living in the United States at the time of the initial survey, and the National Longitudinal Survey of Youth 1997 (NLSY97), a nationally representative sample of 8,984 men and women born from 1980 to 1984 and living in the United States at the time of the initial survey.
Participants in the NLSY79 were first interviewed in 1979 when they were ages 14 to 22. Interviews for the NLSY79 were conducted annually through 1994 and biennially since 1994, with the most recent survey having taken place in 2010, when the respondents were ages 45 to 53. Typically, high school graduation would have occurred between 1975 and 1983 for this cohort. Participants in the NLSY97 were first interviewed in 1997, when they were ages 12 to 17. The sample members have been interviewed annually through 2011. Respondents are ages 25 to 29 in the most recent round of data available. Typically, high school graduation would have occurred between 1998 and 2003 for the NLSY97 cohort. By design, the two surveys collect similar information, including high school transcripts and detailed education histories.
Both the NLSY79 and the NLSY97 collected high school transcripts for about 70 percent of sample members. The transcripts provide information on the specific courses taken and the grade earned in each course. Based on National Center for Educational Statistics (NCES) standards, the transcript data in the NLSY79 and NLSY97 are used to create variables that measure how far the student has progressed in a subject. Based on the rigor of the student’s coursework, each student is classified into one curriculum category per subject. In general, the curriculum categories indicate the highest level of coursework taken by each student. This analysis shows the course-taking patterns across the two cohorts in mathematics, science, and foreign language. These subjects are examined because progression in these subjects can be measured. Five categories are used to describe the rigor of math curriculum taken during high school:
Five categories are used to describe how far the youth progresses in high school science:
Progress in foreign language is described by three categories:
Chart 1 shows that students in the NLSY97 took more rigorous coursework than did students in the NLSY79. The data are displayed based on the curriculum categories described above. For instance, among students who took the advanced academic 1 or 2 and advanced academic 3 math curriculum, the percentage rose from about 10 percent in the NLSY79 cohort to approximately 35 percent in the NLSY97 cohort. (See chart 1, top panel.) The percentage of students in the lowest category of math curriculum—(general math, consumer math, and pre-algebra) fell by more than half, from 26 percent in the NLSY79 to 10 percent in the NLSY97. For almost half of the youth in the NLSY79 the highest level of science taken in high school was general biology, biology 2, or advanced biology. (See chart 1, middle panel.) For the NLSY97, this level of science remains the modal category for the most rigorous science class, but the percentage of this cohort who took general biology, biology 2, or advanced biology fell to 31 percent. The percentage of youth who took science classes that put them in the highest category (at least chemistry 1 and physics 1) was just 3 percent in the NLSY79 cohort, compared with 27 percent in the NLSY97. The pattern of coursework in foreign language reverses itself between the two generations. In the NLSY79 cohort, over half of youth took no foreign language credits, almost 20 percent took up to 2 years of credits, and 30 percent took 2 years or more of a foreign language. (See chart 1, bottom panel.) In the NLSY97, about 30 percent of youth took no foreign language, almost 20 percent took up to 2 years of a foreign language, and about half took at least 2 years of a foreign language.
College attendance has increased markedly between the two generations. College attendance is defined as having been enrolled in college by age 21. Overall, college attendance increased by 26 percent between the two cohorts, from an attendance rate of 53 percent in the NLSY79 to 67 percent in the NLSY97.
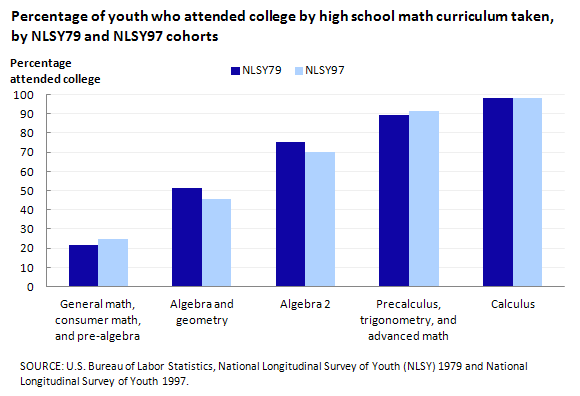
A more rigorous high school math curriculum is associated with a higher probability of attending college, and this positive association has grown stronger in the time between the two generations. This analysis focuses on math because research shows strong effects of high school math coursework on higher education and earnings.4 Chart 2 shows the percentages of youth who attended college, by high school math curriculum. For both the NLSY79 and NLSY97, the percentage of youth who attended college increases with the rigor of high school math curriculum. For the two intermediate math curriculum categories (algebra, geometry, and algebra 2), a greater percentage of youth in the NLSY79 attended college. The difference in attendance rates by curriculum diminishes with the rigor of the math curriculum with comparable percentages from the top two math curriculum categories going on to college. The increase in attendance at college reflects the increase in the percentage of students taking more rigorous math curricula, which outweighs the lower attendance rates for the lower math curricula.
Chart 3 shows composition based on high school math curriculum of the youth who attended college for the NLSY79 and NLSY97. In the NLSY79, youth who take one of the mid-academic curricula (algebra, geometry, or algebra 2) make up about 70 percent of the youth who go to college. In the NLSY97, the math curricula taken in high school by those who go on to college is different. In the NLSY97, approximately half of the youth who go to college took an advanced academic curriculum, compared with less than 20 percent in the NLSY79.
Whether the result of the mandated state requirement or recent reforms, students’ expectations about what courses they need to be prepared for college and the workplace, or a combination of factors, high school course-taking patterns have clearly changed between the two cohorts. Youth in the NLSY97 took more rigorous courses in math, science, and foreign language. The percentage of students following the most rigorous curricula in math has quadrupled; in science, it has increased nine fold. In addition, youth in the NLSY97 are more likely to attend college. The connection between rigorous course taking and college is stronger for the NLSY97 cohort compared, with the NLSY79 cohort.
This Beyond the Numbers report was prepared by Alison Aughinbaugh, economist, Office of Employment and Unemployment Statistics. Email: Aughinbaugh.alison@bls.gov Telephone: 201-691-7520.
Information in this article will be made available to sensory-impaired individuals upon request. Voice phone: (202) 691-5200. Federal Relay Service: 1-800-877-8339. This article is in the public domain and may be reproduced without permission.
Alison Aughinbaugh, “A comparison of college attendance and high school coursework from two cohorts of youth,” Beyond the Numbers: Special Studies & Research, vol. 1, no. 14 (U.S. Bureau of Labor Statistics, October 2012), https://www.bls.gov/opub/btn/volume-1/a-comparison-of-college-attendance-and-high-school-coursework-from-two-cohorts-of-youth.htm
1 See Digest of Education Statistics: 1980 and 1993 (IES National Center for Educational Statistics, 1995), table 151, “Minimum High School Graduation Requirements: Standard Diplomas, 1980 and August 1993,” http://nces.ed.gov/programs/digest/d95/dtab151.asp.
2 See Closing the Expectations Gap 2011: Sixth Annual 50-State Progress Report on the Alignment of High School Policies with the Demands of College and Careers, http://www.achieve.org/files/AchieveClosingtheExpectationsGap2011.pdf.
3 See Olivier Deschenes, "Unobserved Ability, Comparative Advantage, and the Rising Return to Education in the United States 1979-2000," Economics Working Paper Series (Department of Economics, University of California at Santa Barbara, 2001); C. Goldin, and L. F. Katz, “Long-Run Changes in the U.S. Wage Structure: Narrowing, Widening, and Polarizing,” NBER Working Paper No. 13568 (National Bureau of Economic Research, November 2007); L. F. Katz, and D. H. Autor, “Changes in the Wage Structure and Earnings Inequality,” in O. Ashenfelter and D. Card, eds., Handbook of Labor Economics, vol. 3A (Amsterdam, Elsevier Science), pp. 1463–1555; and T. Lemieux, “Postsecondary Education and Increasing Wage Inequality,” http://ideas.repec.org/a/aea/aecrev/v96y2006i2p195-199.html American Economic Review, 2006, vol. 96, no. 2, pp. 195–199, http://ideas.repec.org/s/aea/aecrev.html.
4 See Goodman, and J. S. Joensen and H.S. Nielsen, 2009, “Is there a Causal Effect of High School Math on Labor Market Outcomes?” Journal of Human Resources, 2009, vol. 44 no. 1.
Publish Date: Monday, October 1, 2012