An official website of the United States government
An official website of the United States government
The .gov means it's official.
Federal government websites often end in .gov or .mil. Before sharing sensitive information,
make sure you're on a federal government site.
The site is secure.
The
https:// ensures that you are connecting to the official website and that any
information you provide is encrypted and transmitted securely.

More articles and information related to the Consumer Expenditure Survey are available online at the following links:
Between 1986 and 2010, homeowners and renters dramatically changed their spending habits in response to changes in the economy, although the amount they spent on overall expenditures remained roughly the same. A comparison of spending by homeowners and renters in the major expenditure categories shows many differences, but one thing remains constant: housing is the largest expenditure for U.S. consumers.
This issue of Beyond the Numbers uses data from the Consumer Expenditure Survey (CE) to compare expenditures of homeowners with those of renters, from 1986 through 2010. The analysis of CE data helps to shed light on the effects that recent housing crises had on consumer spending, revealing many interesting shifts in spending on housing and other expenses, changes in household size and demographics, and movement among geographic areas.
In 1986, the unemployment rate declined to an annual average of 7.0 percent, down from a peak of 9.7 percent in 1982.1 The housing boom of the early 1980s was slowing down,2 and construction employment leveled off after increasing by 30 percent between 1982 and 1986. There were 94 million consumer units (CUs) in 1986. Of those sampled, 62 percent were homeowners, spending $28,172 ($56,049 in 2010 dollars)3 on average for all expenditures over the year. Renters made up 38 percent of those sampled, spending $16,850 ($33,524 in 2010 dollars) on average for all expenditures. Housing was the largest share of consumers’ expenditures for both owners and renters. Sixty percent of homeowners carried a mortgage and those who did paid $3,889 ($7,737) in mortgage interest and charges4 (a subcategory of housing), on average, over the year. Renters paid $3,350 ($6,665) in rent over the year, on average.
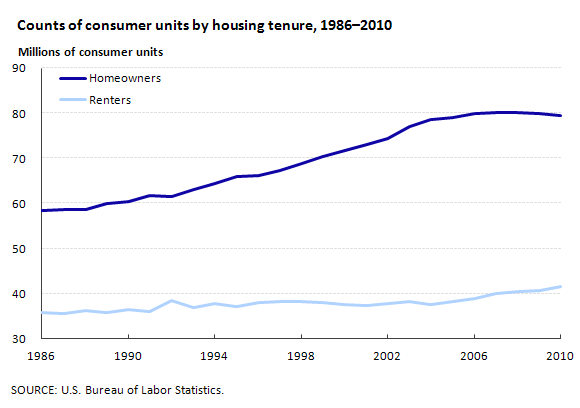
In 2010, however, the economy was still experiencing adverse effects from the collapse of the recently booming housing market. Unemployment reached an annual average of 9.6 percent, remaining above 9 percent for 2 years in a row for the first time since 1983. Construction employment plummeted –27.6 percent from its record high in January 2007 to just under 5.6 million.5 By 2010, the number of CUs was just over 121 million, an increase of 29 percent since 1986. The number of homeowners dropped off slightly, from a peak of 80.3 million in 2008 to just under 80 million in 2010. (See chart 1.) From 2000 to 2010, the CE data showed that approximately 66 to 67 percent of CUs were homeowners, up from 62 percent in 1986. This growth represents a 36-percent increase in the number of homeowners over a 25-year span. The number of renters also continued to increase, but at a slower rate. With a smaller share of the market, renters increased their numbers by 17 percent, from 36 million in 1986 to 42 million in 2010.
Several noteworthy data highlights emerge when comparing consumer expenditures by homeowners with those by renters, from 1986 to 2010:
| Expenditure | Homeowners | Renters |
|---|---|---|
|
Housing |
$18,503 | $12,843 |
|
Mortgage interest and charges (reporters only) |
8,202 | — |
|
Rent (reporters only) |
— | 8,798 |
|
Maintenance, repairs, insurance, and other expenses |
1,689 | 82 |
|
Utilities |
4,314 | 2,413 |
|
Natural gas |
538 | 237 |
|
Electricity |
1,654 | 952 |
|
Fuel oil and other fuels |
195 | 35 |
|
Telephone services |
1,289 | 965 |
|
Residential telephone/pay phones |
485 | 241 |
|
Cellular phone service |
789 | 704 |
|
Water and other public services |
631 | 219 |
|
Household operations |
1,230 | 582 |
|
Housekeeping supplies |
741 | 362 |
|
Household furnishings and equipment |
1,817 | 796 |
|
NOTE: Dash indicates data not available or not applicable. |
||
In 2010, homeowners spent, on average, nearly $6,000 more than renters for all housing expenditures. (See table 1.) However, in 2010, those reporting rent paid more in annual rent ($8,798) than homeowners reported paying in mortgage interest and charges ($8,202).6 In the last 25 years of CE data, this has only happened twice: in 2010 and in 2004. (See chart 2.) Chart 2 shows the slow, steady rise of rent over the years as well as the more erratic fluctuation of mortgage interest and charges since 1986. These fluctuations are largely caused by the changes in interest rates set by the Federal Reserve in response to varying economic environments. For example, the dip in 2004 in mortgage interest and charges was largely a response to the drop in interest rates following the 2001 recession. The decrease in interest rates in 2004 and again in 2010 had no discernable effect on rent.
For nearly all subcategories of housing, homeowners spent much more on average than renters in 2010. Homeowners ($1,689) paid 20 times more for maintenance, repairs, and insurance than renters ($82), reflecting the direct payment of renters’ maintenance costs by many landlords. Homeowners ($4,314) spent almost twice as much as renters ($2,413) on utilities over the year. Electricity was the largest utility bill for both parties. The discrepancy in utility payments can be traced to differences in housing structures between the groups,7 contracted utilities paid indirectly by renters through rent (CE does not allocate a portion of rent to these utilities), and the larger average number of people living in owned housing units. (See “Demographics” section.)
Homeowners and renters reported different total expenditures on telephone services ($1,289 and $952, respectively), but there were some similarities within the telephone services category. In 2010, homeowners spent $789, on average, on cellular phone service, and renters averaged $704 for the year. Homeowners are more likely to have a residential telephone (75 percent reporting for homeowners, 39 percent for renters), but cellular phone service is more evenly distributed between the two demographics (65 percent reporting for homeowners, 64 percent for renters).8 As cell phones gained popularity, renters’ expenditures increased to nearly match those of homeowners.
When 1986 dollars are converted to 2010 dollars, there is a negligible difference in overall expenditures for both homeowners and renters in the last 25 years.9 (See table 2.) However, though overall spending has changed very little, how CUs are choosing to spend their money has changed dramatically.
| Expenditure | Homeowners | Renters | ||||
|---|---|---|---|---|---|---|
| 1986 | 2010 | Percent change | 1986 | 2010 | Percent change | |
|
Annual expenditures |
$56,050 | $55,780 | 0 | $33,524 | $33,460 | 0 |
|
Food |
7,907 | 6,820 | -14 | 5,169 | 4,802 | -7 |
|
Food at home |
4,580 | 4,000 | -13 | 2,972 | 2,902 | -2 |
|
Food away from home |
3,327 | 2,820 | -15 | 2,196 | 1,900 | -13 |
|
Housing |
16,637 | 18,503 | 11 | 11,038 | 12,843 | 16 |
|
Apparel and apparel services |
3,030 | 1,781 | -41 | 2,111 | 1,544 | -27 |
|
Transportation |
11,609 | 9,056 | -22 | 6,408 | 5,046 | -21 |
|
Gasoline and motor oil |
2,147 | 2,458 | 15 | 1,285 | 1,511 | 18 |
|
Healthcare |
2,837 | 4,016 | 42 | 1,313 | 1,518 | 16 |
|
Health insurance |
943 | 2,314 | 145 | 406 | 909 | 124 |
|
Entertainment |
2,775 | 3,088 | 11 | 1,486 | 1,390 | -6 |
|
Personal insurance and pensions |
5,368 | 6,665 | 24 | 2,374 | 2,907 | 22 |
|
NOTE: For comparison, 1986 dollars were converted to 2010 dollars. |
||||||
Since 1986, both owners and renters have shifted their spending habits away from transportation, food, and apparel and apparel services and spent more on housing, personal insurance and pensions, and healthcare. Homeowners directed relatively more of their money toward entertainment in 2010 than they did 25 years ago, while renters spent less on average on entertainment in 2010 than they did in 1986.
In 2010, housing remained the largest expenditure item for both owners and renters. (See chart 3.) Renters have historically spent a higher proportion on housing than owners, but this difference has become more pronounced over the last 25 years. Owners increased their share of expenditures on housing from 30 percent in 1986 to 33 percent in 2010, and renters made the jump from 33 percent in 1986 to 38 percent in 2010.
Table 2 shows that from 1986 to 2010, homeowners decreased their spending on food (–$2,100, –14 percent), apparel and apparel services (–$1,300, –41 percent), and transportation (–$2,600, –22 percent). These decreases were offset by increases in expenditures on housing ($1,900, 11 percent), healthcare ($1,200, 42 percent), entertainment ($300, 11 percent), and personal insurance and pensions ($1,300, 24 percent).
Renters had similar, though less volatile, changes in expenditures between 1986 and 2010. Renters spent less money on food (–$300, –7 percent), apparel and apparel services (–$600, –27 percent), transportation (–$1,400, –21 percent), and entertainment (–$100, –6 percent). Renters increased their spending on housing ($1,700, 16 percent), healthcare ($200, 16 percent), and personal insurance and pensions ($500, 22 percent).
Since 1986, both homeowners and renters have been steadily increasing the amount of money they spend on nonproperty insurance. Both groups increased their spending on personal insurance and pensions by almost 25 percent, respectively. However, a more pronounced increase occurred in health insurance (a subcategory of healthcare). Both homeowners and renters spent more on healthcare in 2010 than they did in 1986, and the increases can be traced to rising expenditures on health insurance. In the years since 1986, homeowners increased their average annual expenditure on health insurance from $943 to $2,314 (145 percent). The same is true for renters, who spent $406, on average, on health insurance in 1986 and more than doubled their healthcare expenditure by 2010, spending $909 (an increase of 124 percent). The increase in health insurance is more than the increase in overall healthcare for both homeowners and renters, indicating that expenditures on some other aspects of healthcare decreased.
Transportation, the second largest component of overall expenditures, decreased substantially for both homeowners (–22 percent) and renters (–21 percent). Despite this overall decline, however, both homeowners and renters increased their spending on gasoline and motor oil. The drop in transportation spending is likely because CUs purchased fewer vehicles in 2010 and fewer CUs owned cars in 2010 than they did 25 years ago.
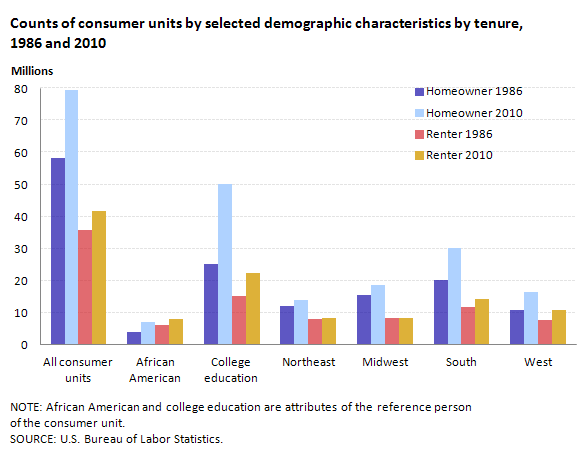
Over the last 25 years, the average number of children living in owner-occupied households has fallen steadily. In 1986, homeowners had, on average, 0.7 children under the age of 18 living in the CU, whereas renters averaged slightly less at 0.6. In 2010, those values reversed and homeowners had fewer children under the age of 18 (0.6) compared with renters (0.7). The changing numbers of children in CUs have contributed to closing the gap between the average number of people per CU between homeowners and renters. In 1986, CUs who owned their home had an average of 2.8 people living there, but by 2010, this number had dropped to 2.6. For renters in 1986, the number of people per CU was 2.2. This number increased over time to 2.3 people per CU in 2010. Although these changes are small, they make a big difference when data are presented by individual consumer units. From 1986 to 2010, the number of CUs renting increased 17 percent, but the number of individuals living in rented units increased 22 percent. Conversely, although the number of CUs owning their home increased 36 percent between 1986 and 2010, the number of individuals living in owned homes increased by only 26 percent. When analyzing the data at the CU level, one can see that the rapid increase in homeowners compared with renters from 1986 to 2010 is dramatic, but the increase is less so when looking at the data by individuals.
The number of African American reference persons within CUs increased modestly since 1986, though the percentage changes were large. (See chart 4.) In 2010, the homeownership rate among African American CUs was 46 percent, up from 42 percent in 1986. The number of African American CUs who owned their home was just over 7 million, an increase of 75 percent from 1986. There were just under 8 million African American CUs renting in the CE in 2010, an increase of 30 percent since 1986.
The number of Hispanic reference persons also increased. Since 1994, when the CE first began recording Hispanic origin, the number of Hispanic CUs who are homeowners more than doubled, from 3.2 million in 1994 to 7.1 million in 2010. The homeownership rate among Hispanic CUs in the CE increased from 42 percent in 1994 to 48 percent in 2010. The number of Hispanic CUs who rent increased to about 7.6 million in 2010.
In 2010, the homeownership rate increased across all four regions: Northeast, Midwest, South and West.10 The largest rate increase occurred in the South (63 percent in 1986 to 68 percent in 2010), where the number of CUs owning homes doubled. The West region had the lowest number of CUs who owned homes in 1986, but moved into third place in 2010, though its rate of homeownership remained the lowest at 60 percent. The Northeast region experienced an increase of only 2 million homeowners between 1986 and 2010. The Midwest and Northeast witnessed very little movement in the number of CUs renting between 1986 and 2010. In those years, the Northeast added 255,000 renters, while the Midwest region registered an even smaller increase of 85,000. Conversely, both the South and West regions showed significant gains in renters since 1986. The South region had 3.5 million more renters in 2010 than in 1986, and the West added 2.5 million renters. Although none of the regions decreased in population, it is clear that the steadily increasing population of the United States is migrating toward the South and West.
In 1986, the United States was coming to the end of a period of strong economic growth following the recession of the early 1980s. Twenty-five years later, the country was beginning to recover from another, more severe recession, which caused similar lags in the housing market. Despite the faltering markets, housing remained the largest expenditure for both homeowners and renters. Although homeowners spent more on housing than renters, renters devoted a much larger share of their spending to housing. CE data show that both homeowners and renters changed their expenditures to adapt to changes in the economy, shifting their expenditures among different categories but spending relatively the same amount overall.
This Beyond the Numbers report was prepared by Adam Reichenberger, economist in the Office of Prices and Living Conditions, Washington, DC. Email: reichenberger.adam@bls.gov. Telephone: 202-691-6872. For more information on the Consumer Expenditure Survey, please see www.bls.gov/cex.
Information in this article will be made available to sensory-impaired individuals upon request. Voice phone: (202) 691- 5200. Federal Relay Service: 1-800-877-8339. This article is in the public domain and may be reproduced without permission.
Adam Reichenberger, Consumer Expenditure Survey, “A comparison of 25 years of consumer expenditures by homeowners and renters,” Beyond the Numbers: Prices & Spending, vol. 1, no. 15 (U.S. Bureau of Labor Statistics, October 2012), https://www.bls.gov/opub/btn/volume-1/a-comparison-of-25-years-of-consumer-expenditures-by-homeowners-and-renters.htm
1 Susan E. Shank and Steven E. Haugen, “The employment situation during 1986: job gains continue, unemployment dips,” Monthly Labor Review, (U.S. Bureau of Labor Statistics, February 1987), https://www.bls.gov/opub/mlr/1987/02/art1full.pdf.
2 Todd Sinai, “House Price Moments in Boom-Bust Cycles,” National Bureau of Economic Research, April 2012, http://www.nber.org/chapters/c12619.pdf.
3 All dollar amounts are nominal values taken from the year of analysis being discussed, with 2010 nominal dollars following in parentheses. Values were adjusted using the CPI-U. https://www.bls.gov/cpi/tables.htm.
4 Payments toward mortgage principal are not included in these figures. The CE does not categorize payments toward mortgage principal as an expenditure, but instead captures them as a change in total liabilities, making it difficult to extract these payments for analysis.
5 See the U.S. Bureau of Labor Statistics publication series Employment and Earnings Online: https://www.bls.gov/opub/ee/. See also: Adam Haid, “Construction employment peaks before the recession and falls sharply throughout it,” Monthly Labor Review, (U.S. Bureau of Labor Statistics April 2011), https://www.bls.gov/opub/mlr/2011/04/art4full.pdf.
6 Because these two expenditures are often paid in monthly installments, they are frequently compared to one another when analyzing cost-of-living differences of homeowners and renters.
7 According to the American Community Survey, in 2010, 82 percent of owner-occupied housing units were detached versus only 27 percent of renter-occupied housing units. 54 percent of renter-occupied housing units had at least 3 different units within the structure compared to only 4 percent of owner-occupied housing units.
8 For more on the rise of cellular phone expenditures coupled with the fall of expenditures for residential phones, see “Consumer Spending in 2010,” Focus on Prices and Spending, vol.2, no. 12, (U.S. Bureau of Labor Statistics, December 2011), https://www.bls.gov/opub/btn/archive/consumer-spending-in-2010.pdf.
9 All expenditures in this section are converted to 2010 dollars for comparative purposes, using the CPI-U.
10 Consumer units are classified by region, according to the address at which the family was residing during the time of their participation in the survey. The regions comprise the following states: Northeast—Connecticut, Maine, Massachusetts, New Hampshire, New Jersey, New York, Pennsylvania, Rhode Island, and Vermont; Midwest—Illinois, Indiana, Iowa, Kansas, Michigan, Minnesota, Missouri, Nebraska, North Dakota, Ohio, South Dakota, and Wisconsin; South—Alabama, Arkansas, Delaware, District of Columbia, Florida, Georgia, Kentucky, Louisiana, Maryland, Mississippi, North Carolina, Oklahoma, South Carolina, Tennessee, Texas, Virginia, and West Virginia; West—Alaska, Arizona, California, Colorado, Hawaii, Idaho, Montana, Nevada, New Mexico, Oregon, Utah, Washington, and Wyoming.
Publish Date: Thursday, October 11, 2012