
An official website of the United States government
An official website of the United States government
The .gov means it's official.
Federal government websites often end in .gov or .mil. Before sharing sensitive information,
make sure you're on a federal government site.
The site is secure.
The
https:// ensures that you are connecting to the official website and that any
information you provide is encrypted and transmitted securely.
Operate or control an entire process or system of machines, often through the use of control boards, to transfer or treat water or wastewater.
Employment estimate and mean wage estimates for Water and Wastewater Treatment Plant and System Operators:
| Employment (1) | Employment RSE (3) |
Mean hourly wage |
Mean annual wage (2) |
Wage RSE (3) |
|---|---|---|---|---|
| 120,710 | 0.9 % | $ 27.91 | $ 58,050 | 0.3 % |
Percentile wage estimates for Water and Wastewater Treatment Plant and System Operators:
| Percentile | 10% | 25% | 50% (Median) |
75% | 90% |
|---|---|---|---|---|---|
| Hourly Wage | $ 17.64 | $ 21.50 | $ 26.39 | $ 32.59 | $ 39.95 |
| Annual Wage (2) | $ 36,680 | $ 44,720 | $ 54,890 | $ 67,790 | $ 83,090 |
Industries with the highest published employment and wages for Water and Wastewater Treatment Plant and System Operators are provided. For a list of all industries with employment in Water and Wastewater Treatment Plant and System Operators, see the Create Customized Tables function.
Industries with the highest levels of employment in Water and Wastewater Treatment Plant and System Operators:
| Industry | Employment (1) | Percent of industry employment | Hourly mean wage | Annual mean wage (2) |
|---|---|---|---|---|
| Local Government, excluding Schools and Hospitals (OEWS Designation) | 90,050 | 1.63 | $ 27.89 | $ 58,000 |
| Water, Sewage and Other Systems | 15,450 | 26.48 | $ 27.00 | $ 56,170 |
| Waste Treatment and Disposal | 1,740 | 1.71 | $ 31.54 | $ 65,600 |
| Animal Slaughtering and Processing | 1,240 | 0.23 | $ 22.96 | $ 47,750 |
| Management, Scientific, and Technical Consulting Services | 1,060 | 0.06 | $ 26.01 | $ 54,100 |
Industries with the highest concentration of employment in Water and Wastewater Treatment Plant and System Operators:
| Industry | Employment (1) | Percent of industry employment | Hourly mean wage | Annual mean wage (2) |
|---|---|---|---|---|
| Water, Sewage and Other Systems | 15,450 | 26.48 | $ 27.00 | $ 56,170 |
| Waste Treatment and Disposal | 1,740 | 1.71 | $ 31.54 | $ 65,600 |
| Local Government, excluding Schools and Hospitals (OEWS Designation) | 90,050 | 1.63 | $ 27.89 | $ 58,000 |
| Pulp, Paper, and Paperboard Mills | 410 | 0.47 | $ 32.04 | $ 66,630 |
| Nonferrous Metal (except Aluminum) Production and Processing | 200 | 0.32 | $ 25.08 | $ 52,160 |
Top paying industries for Water and Wastewater Treatment Plant and System Operators:
| Industry | Employment (1) | Percent of industry employment | Hourly mean wage | Annual mean wage (2) |
|---|---|---|---|---|
| Electric Power Generation, Transmission and Distribution | 450 | 0.11 | $ 43.61 | $ 90,720 |
| Management of Companies and Enterprises | 150 | 0.01 | $ 42.31 | $ 88,000 |
| Aerospace Product and Parts Manufacturing | 120 | 0.02 | $ 38.64 | $ 80,380 |
| Oil and Gas Extraction | 80 | 0.08 | $ 38.46 | $ 79,990 |
| Chemical Manufacturing (3251, 3252, 3253, and 3259 only) | 380 | 0.10 | $ 36.66 | $ 76,250 |
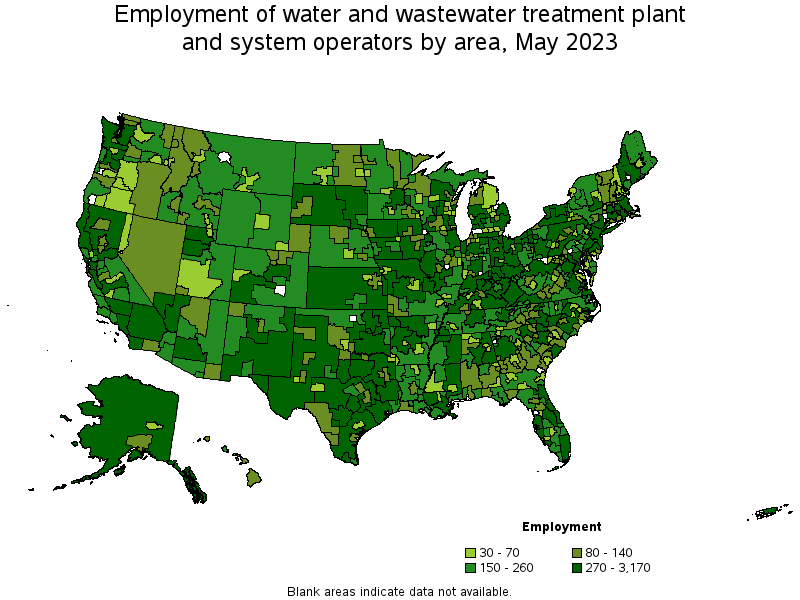
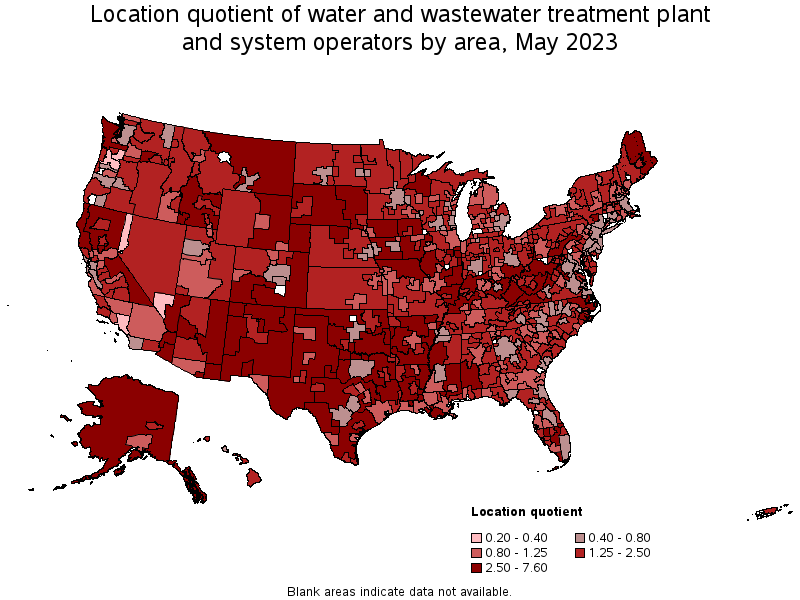
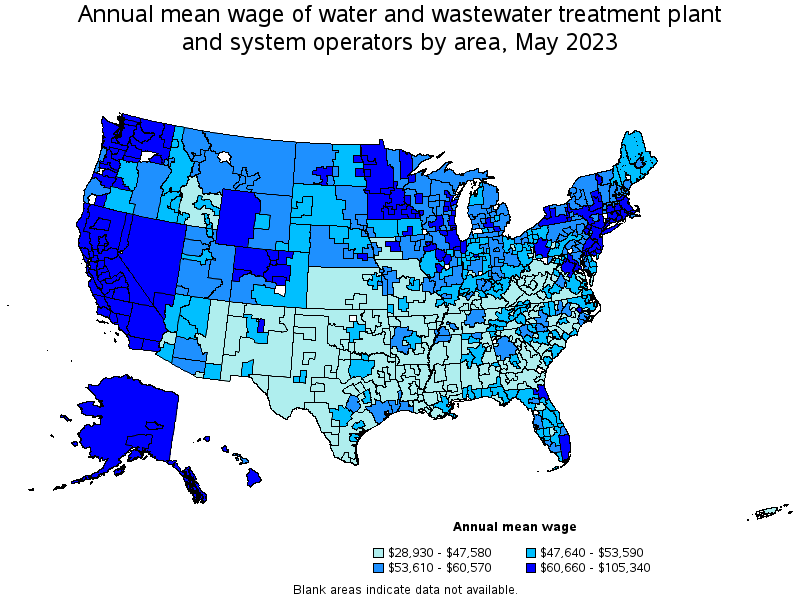
States and areas with the highest published employment, location quotients, and wages for Water and Wastewater Treatment Plant and System Operators are provided. For a list of all areas with employment in Water and Wastewater Treatment Plant and System Operators, see the Create Customized Tables function.
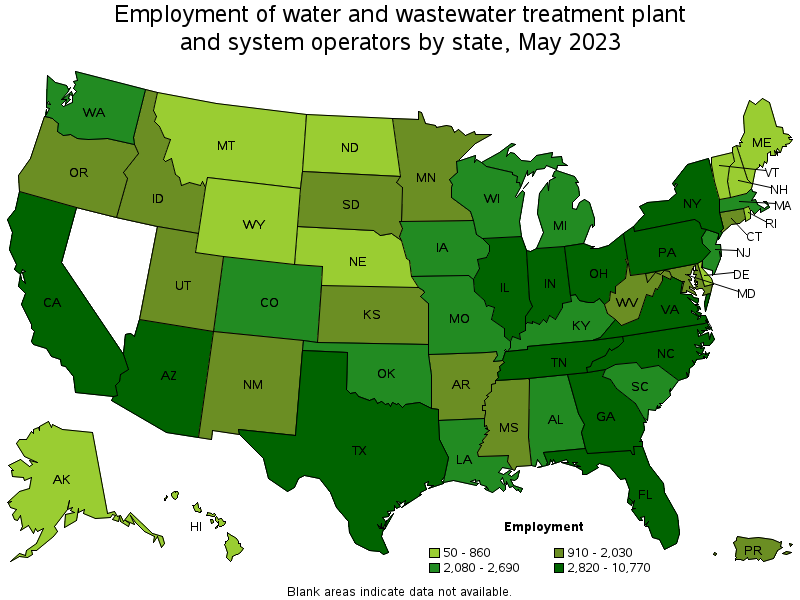
States with the highest employment level in Water and Wastewater Treatment Plant and System Operators:
| State | Employment (1) | Employment per thousand jobs | Location quotient (9) | Hourly mean wage | Annual mean wage (2) |
|---|---|---|---|---|---|
| Texas | 10,770 | 0.79 | 1.00 | $ 23.28 | $ 48,420 |
| California | 10,620 | 0.59 | 0.74 | $ 39.19 | $ 81,510 |
| Florida | 7,330 | 0.77 | 0.96 | $ 27.03 | $ 56,210 |
| Ohio | 5,580 | 1.02 | 1.28 | $ 26.56 | $ 55,240 |
| Pennsylvania | 5,200 | 0.87 | 1.10 | $ 28.46 | $ 59,190 |
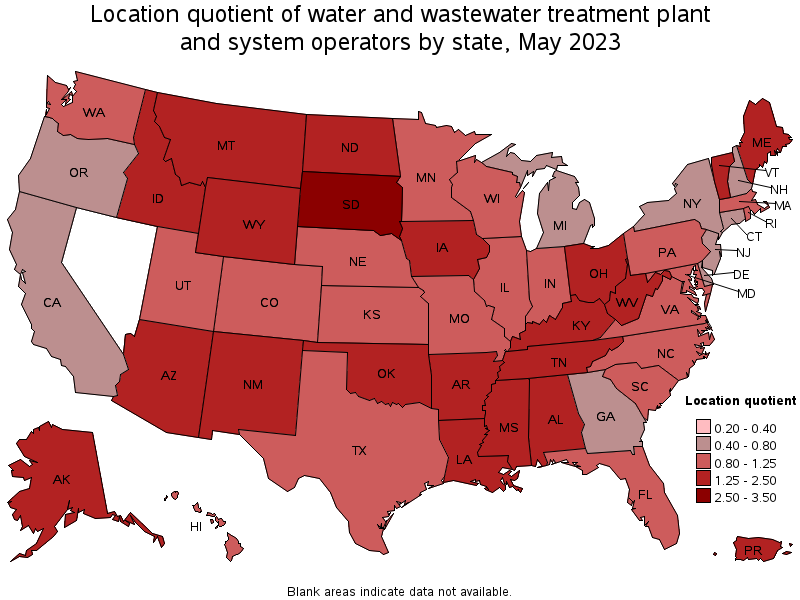
States with the highest concentration of jobs and location quotients in Water and Wastewater Treatment Plant and System Operators:
| State | Employment (1) | Employment per thousand jobs | Location quotient (9) | Hourly mean wage | Annual mean wage (2) |
|---|---|---|---|---|---|
| South Dakota | 940 | 2.12 | 2.67 | $ 26.05 | $ 54,180 |
| Wyoming | 470 | 1.71 | 2.15 | $ 27.61 | $ 57,430 |
| West Virginia | 1,170 | 1.69 | 2.13 | $ 21.33 | $ 44,360 |
| New Mexico | 1,380 | 1.63 | 2.05 | $ 22.83 | $ 47,490 |
| Arkansas | 2,010 | 1.58 | 1.99 | $ 21.54 | $ 44,790 |
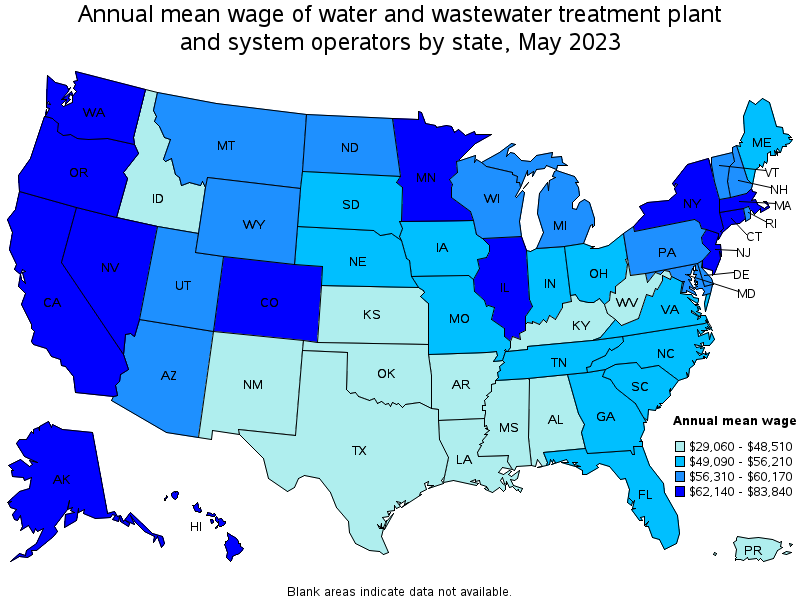
Top paying states for Water and Wastewater Treatment Plant and System Operators:
| State | Employment (1) | Employment per thousand jobs | Location quotient (9) | Hourly mean wage | Annual mean wage (2) |
|---|---|---|---|---|---|
| Nevada | (8) | (8) | (8) | $ 40.31 | $ 83,840 |
| California | 10,620 | 0.59 | 0.74 | $ 39.19 | $ 81,510 |
| Washington | 2,320 | 0.66 | 0.83 | $ 38.87 | $ 80,850 |
| Connecticut | 910 | 0.55 | 0.69 | $ 35.78 | $ 74,420 |
| Alaska | 480 | 1.54 | 1.93 | $ 35.12 | $ 73,060 |
Metropolitan areas with the highest employment level in Water and Wastewater Treatment Plant and System Operators:
| Metropolitan area | Employment (1) | Employment per thousand jobs | Location quotient (9) | Hourly mean wage | Annual mean wage (2) |
|---|---|---|---|---|---|
| New York-Newark-Jersey City, NY-NJ-PA | 3,170 | 0.33 | 0.42 | $ 35.57 | $ 73,980 |
| Chicago-Naperville-Elgin, IL-IN-WI | 2,910 | 0.65 | 0.81 | $ 35.85 | $ 74,560 |
| Phoenix-Mesa-Scottsdale, AZ | 2,440 | 1.07 | 1.34 | $ 28.71 | $ 59,710 |
| Houston-The Woodlands-Sugar Land, TX | 2,180 | 0.69 | 0.86 | $ 26.16 | $ 54,410 |
| Los Angeles-Long Beach-Anaheim, CA | 1,850 | 0.30 | 0.38 | $ 37.87 | $ 78,760 |
| Dallas-Fort Worth-Arlington, TX | 1,750 | 0.44 | 0.55 | $ 24.80 | $ 51,580 |
| Philadelphia-Camden-Wilmington, PA-NJ-DE-MD | 1,730 | 0.61 | 0.77 | $ 31.51 | $ 65,550 |
| Miami-Fort Lauderdale-West Palm Beach, FL | 1,640 | 0.60 | 0.76 | $ 32.59 | $ 67,780 |
| Riverside-San Bernardino-Ontario, CA | 1,430 | 0.86 | 1.08 | $ 37.88 | $ 78,790 |
| Boston-Cambridge-Nashua, MA-NH | 1,420 | 0.52 | 0.65 | $ 33.51 | $ 69,710 |
Metropolitan areas with the highest concentration of jobs and location quotients in Water and Wastewater Treatment Plant and System Operators:
| Metropolitan area | Employment (1) | Employment per thousand jobs | Location quotient (9) | Hourly mean wage | Annual mean wage (2) |
|---|---|---|---|---|---|
| Lake Havasu City-Kingman, AZ | 330 | 6.04 | 7.60 | $ 25.55 | $ 53,140 |
| Prescott, AZ | 240 | 3.47 | 4.36 | $ 24.64 | $ 51,260 |
| Wheeling, WV-OH | 190 | 3.22 | 4.05 | $ 21.88 | $ 45,520 |
| Weirton-Steubenville, WV-OH | 110 | 2.93 | 3.69 | $ 21.93 | $ 45,620 |
| Sebastian-Vero Beach, FL | 160 | 2.86 | 3.60 | $ 25.69 | $ 53,440 |
| Danville, IL | 70 | 2.79 | 3.51 | $ 24.12 | $ 50,160 |
| Sierra Vista-Douglas, AZ | 90 | 2.53 | 3.19 | $ 24.12 | $ 50,170 |
| Sherman-Denison, TX | 120 | 2.43 | 3.06 | $ 23.03 | $ 47,900 |
| Morristown, TN | 110 | 2.41 | 3.03 | $ 21.88 | $ 45,520 |
| Yuma, AZ | 150 | 2.31 | 2.91 | $ 24.12 | $ 50,170 |
Top paying metropolitan areas for Water and Wastewater Treatment Plant and System Operators:
| Metropolitan area | Employment (1) | Employment per thousand jobs | Location quotient (9) | Hourly mean wage | Annual mean wage (2) |
|---|---|---|---|---|---|
| San Francisco-Oakland-Hayward, CA | 990 | 0.41 | 0.51 | $ 50.65 | $ 105,340 |
| San Jose-Sunnyvale-Santa Clara, CA | 470 | 0.41 | 0.52 | $ 48.51 | $ 100,900 |
| Las Vegas-Henderson-Paradise, NV | 310 | 0.28 | 0.36 | $ 45.99 | $ 95,660 |
| Vallejo-Fairfield, CA | 200 | 1.44 | 1.81 | $ 44.84 | $ 93,270 |
| Santa Rosa, CA | 220 | 1.05 | 1.32 | $ 42.51 | $ 88,420 |
| Napa, CA | 70 | 0.92 | 1.16 | $ 42.02 | $ 87,390 |
| Salinas, CA | 160 | 0.86 | 1.08 | $ 41.44 | $ 86,190 |
| Yuba City, CA | 100 | 2.10 | 2.64 | $ 40.98 | $ 85,240 |
| Seattle-Tacoma-Bellevue, WA | 730 | 0.35 | 0.44 | $ 40.77 | $ 84,810 |
| Santa Cruz-Watsonville, CA | 90 | 0.89 | 1.12 | $ 40.69 | $ 84,640 |
Nonmetropolitan areas with the highest employment in Water and Wastewater Treatment Plant and System Operators:
| Nonmetropolitan area | Employment (1) | Employment per thousand jobs | Location quotient (9) | Hourly mean wage | Annual mean wage (2) |
|---|---|---|---|---|---|
| North Texas Region of Texas nonmetropolitan area | 700 | 2.51 | 3.16 | $ 19.43 | $ 40,420 |
| Central Kentucky nonmetropolitan area | 620 | 3.35 | 4.21 | $ 24.54 | $ 51,040 |
| North Northeastern Ohio nonmetropolitan area (noncontiguous) | 610 | 1.86 | 2.34 | $ 24.65 | $ 51,280 |
| Kansas nonmetropolitan area | 600 | 1.55 | 1.95 | $ 21.17 | $ 44,040 |
| West Texas Region of Texas nonmetropolitan area | 530 | 2.68 | 3.38 | $ 20.65 | $ 42,950 |
Nonmetropolitan areas with the highest concentration of jobs and location quotients in Water and Wastewater Treatment Plant and System Operators:
| Nonmetropolitan area | Employment (1) | Employment per thousand jobs | Location quotient (9) | Hourly mean wage | Annual mean wage (2) |
|---|---|---|---|---|---|
| West South Dakota nonmetropolitan area | 310 | 4.97 | 6.25 | $ 24.01 | $ 49,930 |
| Northwest Nebraska nonmetropolitan area | 140 | 3.62 | 4.55 | $ 23.05 | $ 47,930 |
| Southwest Iowa nonmetropolitan area | 280 | 3.46 | 4.36 | $ 22.87 | $ 47,580 |
| Central Kentucky nonmetropolitan area | 620 | 3.35 | 4.21 | $ 24.54 | $ 51,040 |
| North Missouri nonmetropolitan area | 340 | 3.27 | 4.11 | $ 19.83 | $ 41,250 |
Top paying nonmetropolitan areas for Water and Wastewater Treatment Plant and System Operators:
| Nonmetropolitan area | Employment (1) | Employment per thousand jobs | Location quotient (9) | Hourly mean wage | Annual mean wage (2) |
|---|---|---|---|---|---|
| Eastern Sierra-Mother Lode Region of California nonmetropolitan area | 190 | 3.11 | 3.91 | $ 35.86 | $ 74,600 |
| North Valley-Northern Mountains Region of California nonmetropolitan area | 280 | 2.75 | 3.46 | $ 34.29 | $ 71,310 |
| Alaska nonmetropolitan area | 310 | 3.01 | 3.78 | $ 34.09 | $ 70,900 |
| Western Washington nonmetropolitan area | 350 | 2.70 | 3.40 | $ 33.86 | $ 70,420 |
| North Coast Region of California nonmetropolitan area | 290 | 2.78 | 3.49 | $ 33.62 | $ 69,920 |
These estimates are calculated with data collected from employers in all industry sectors, all metropolitan and nonmetropolitan areas, and all states and the District of Columbia. The top employment and wage figures are provided above. The complete list is available in the downloadable XLS files.
The percentile wage estimate is the value of a wage below which a certain percent of workers fall. The median wage is the 50th percentile wage estimate—50 percent of workers earn less than the median and 50 percent of workers earn more than the median. More about percentile wages.
(1) Estimates for detailed occupations do not sum to the totals because the totals include occupations not shown separately. Estimates do not include self-employed workers.
(2) Annual wages have been calculated by multiplying the hourly mean wage by a "year-round, full-time" hours figure of 2,080 hours; for those occupations where there is not an hourly wage published, the annual wage has been directly calculated from the reported survey data.
(3) The relative standard error (RSE) is a measure of the reliability of a survey statistic. The smaller the relative standard error, the more precise the estimate.
(8) Estimate not released.
(9) The location quotient is the ratio of the area concentration of occupational employment to the national average concentration. A location quotient greater than one indicates the occupation has a higher share of employment than average, and a location quotient less than one indicates the occupation is less prevalent in the area than average.
Other OEWS estimates and related information:
May 2023 National Occupational Employment and Wage Estimates
May 2023 State Occupational Employment and Wage Estimates
May 2023 Metropolitan and Nonmetropolitan Area Occupational Employment and Wage Estimates
May 2023 National Industry-Specific Occupational Employment and Wage Estimates
Last Modified Date: April 3, 2024