
An official website of the United States government
An official website of the United States government
The .gov means it's official.
Federal government websites often end in .gov or .mil. Before sharing sensitive information,
make sure you're on a federal government site.
The site is secure.
The
https:// ensures that you are connecting to the official website and that any
information you provide is encrypted and transmitted securely.
Set up, operate, or tend drilling machines to drill, bore, ream, mill, or countersink metal or plastic work pieces.
Employment estimate and mean wage estimates for Drilling and Boring Machine Tool Setters, Operators, and Tenders, Metal and Plastic:
| Employment (1) | Employment RSE (3) |
Mean hourly wage |
Mean annual wage (2) |
Wage RSE (3) |
|---|---|---|---|---|
| 5,740 | 6.1 % | $ 22.83 | $ 47,490 | 1.7 % |
Percentile wage estimates for Drilling and Boring Machine Tool Setters, Operators, and Tenders, Metal and Plastic:
| Percentile | 10% | 25% | 50% (Median) |
75% | 90% |
|---|---|---|---|---|---|
| Hourly Wage | $ 16.61 | $ 18.67 | $ 21.45 | $ 25.68 | $ 30.20 |
| Annual Wage (2) | $ 34,550 | $ 38,840 | $ 44,620 | $ 53,410 | $ 62,820 |
Industries with the highest published employment and wages for Drilling and Boring Machine Tool Setters, Operators, and Tenders, Metal and Plastic are provided. For a list of all industries with employment in Drilling and Boring Machine Tool Setters, Operators, and Tenders, Metal and Plastic, see the Create Customized Tables function.
Industries with the highest levels of employment in Drilling and Boring Machine Tool Setters, Operators, and Tenders, Metal and Plastic:
| Industry | Employment (1) | Percent of industry employment | Hourly mean wage | Annual mean wage (2) |
|---|---|---|---|---|
| Aerospace Product and Parts Manufacturing | 940 | 0.18 | $ 23.99 | $ 49,900 |
| Machine Shops; Turned Product; and Screw, Nut, and Bolt Manufacturing | 680 | 0.20 | $ 24.02 | $ 49,960 |
| Machinery Manufacturing (3331, 3332, 3334, and 3339 only) | 550 | 0.07 | $ 24.19 | $ 50,300 |
| Engine, Turbine, and Power Transmission Equipment Manufacturing | 430 | 0.47 | $ 25.79 | $ 53,650 |
| Semiconductor and Other Electronic Component Manufacturing | 420 | 0.11 | $ 20.77 | $ 43,200 |
Industries with the highest concentration of employment in Drilling and Boring Machine Tool Setters, Operators, and Tenders, Metal and Plastic:
| Industry | Employment (1) | Percent of industry employment | Hourly mean wage | Annual mean wage (2) |
|---|---|---|---|---|
| Engine, Turbine, and Power Transmission Equipment Manufacturing | 430 | 0.47 | $ 25.79 | $ 53,650 |
| Machine Shops; Turned Product; and Screw, Nut, and Bolt Manufacturing | 680 | 0.20 | $ 24.02 | $ 49,960 |
| Aerospace Product and Parts Manufacturing | 940 | 0.18 | $ 23.99 | $ 49,900 |
| Metalworking Machinery Manufacturing | 220 | 0.14 | $ 23.98 | $ 49,880 |
| Foundries | 140 | 0.13 | $ 18.56 | $ 38,610 |
Top paying industries for Drilling and Boring Machine Tool Setters, Operators, and Tenders, Metal and Plastic:
| Industry | Employment (1) | Percent of industry employment | Hourly mean wage | Annual mean wage (2) |
|---|---|---|---|---|
| Utility System Construction | 270 | 0.05 | $ 27.45 | $ 57,090 |
| Engine, Turbine, and Power Transmission Equipment Manufacturing | 430 | 0.47 | $ 25.79 | $ 53,650 |
| Support Activities for Mining | 60 | 0.02 | $ 24.52 | $ 51,010 |
| Machinery Manufacturing (3331, 3332, 3334, and 3339 only) | 550 | 0.07 | $ 24.19 | $ 50,300 |
| Machine Shops; Turned Product; and Screw, Nut, and Bolt Manufacturing | 680 | 0.20 | $ 24.02 | $ 49,960 |
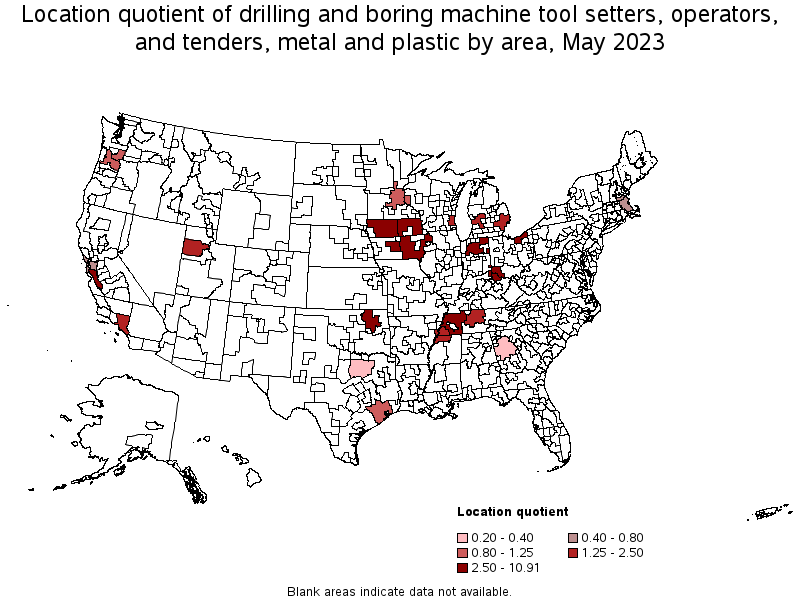
States and areas with the highest published employment, location quotients, and wages for Drilling and Boring Machine Tool Setters, Operators, and Tenders, Metal and Plastic are provided. For a list of all areas with employment in Drilling and Boring Machine Tool Setters, Operators, and Tenders, Metal and Plastic, see the Create Customized Tables function.
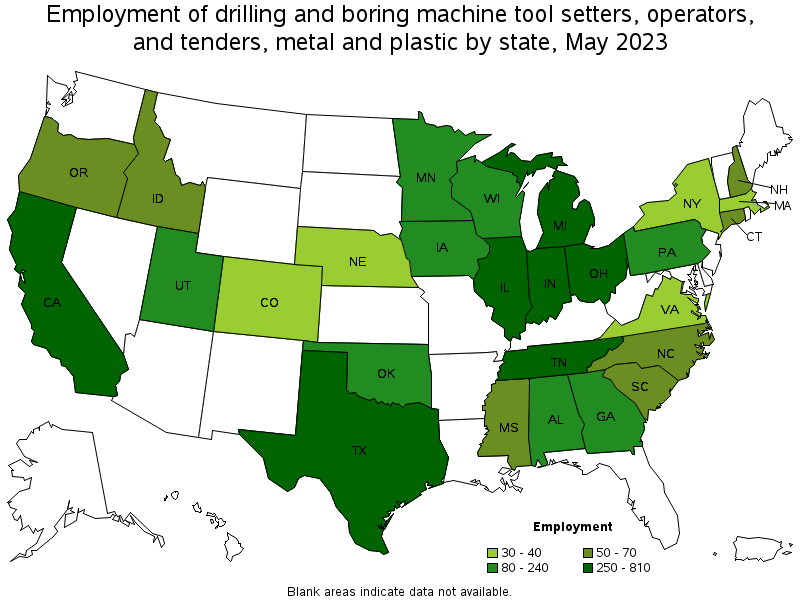
States with the highest employment level in Drilling and Boring Machine Tool Setters, Operators, and Tenders, Metal and Plastic:
| State | Employment (1) | Employment per thousand jobs | Location quotient (9) | Hourly mean wage | Annual mean wage (2) |
|---|---|---|---|---|---|
| California | 810 | 0.05 | 1.19 | $ 24.89 | $ 51,760 |
| Tennessee | 790 | 0.24 | 6.46 | $ 20.52 | $ 42,680 |
| Illinois | 490 | 0.08 | 2.17 | $ 25.17 | $ 52,360 |
| Indiana | 490 | 0.16 | 4.11 | $ 24.28 | $ 50,500 |
| Ohio | 460 | 0.08 | 2.22 | $ 22.38 | $ 46,550 |
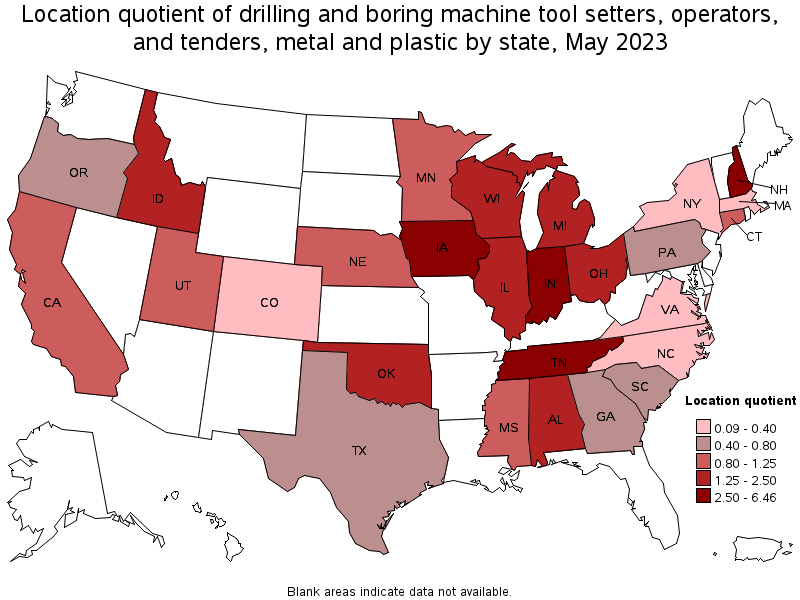
States with the highest concentration of jobs and location quotients in Drilling and Boring Machine Tool Setters, Operators, and Tenders, Metal and Plastic:
| State | Employment (1) | Employment per thousand jobs | Location quotient (9) | Hourly mean wage | Annual mean wage (2) |
|---|---|---|---|---|---|
| Tennessee | 790 | 0.24 | 6.46 | $ 20.52 | $ 42,680 |
| Indiana | 490 | 0.16 | 4.11 | $ 24.28 | $ 50,500 |
| Iowa | 240 | 0.15 | 4.07 | $ 19.64 | $ 40,850 |
| New Hampshire | 70 | 0.11 | 2.92 | $ 23.74 | $ 49,380 |
| Ohio | 460 | 0.08 | 2.22 | $ 22.38 | $ 46,550 |
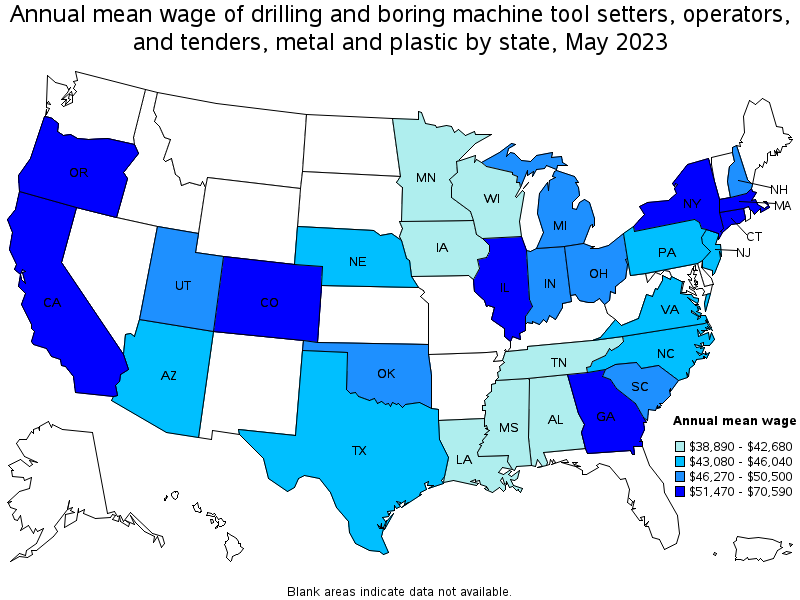
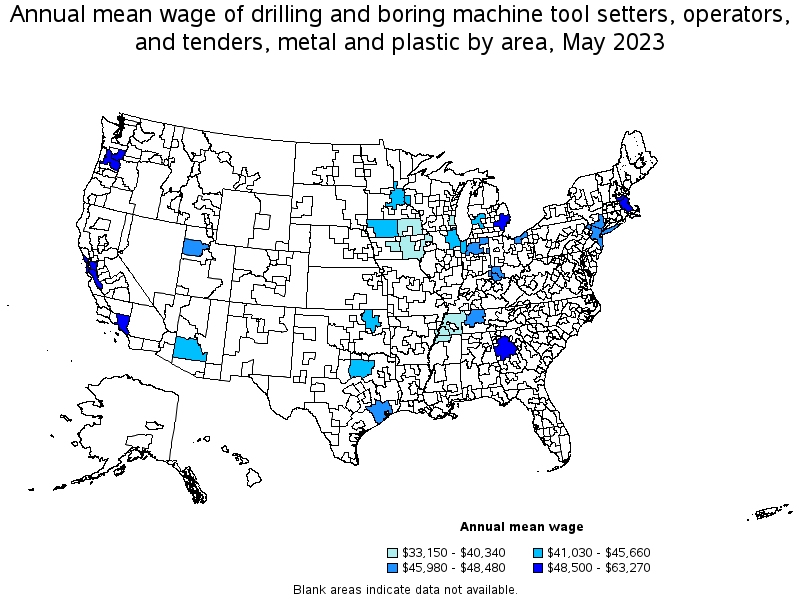
Top paying states for Drilling and Boring Machine Tool Setters, Operators, and Tenders, Metal and Plastic:
| State | Employment (1) | Employment per thousand jobs | Location quotient (9) | Hourly mean wage | Annual mean wage (2) |
|---|---|---|---|---|---|
| Massachusetts | 40 | 0.01 | 0.32 | $ 33.94 | $ 70,590 |
| Oregon | 50 | 0.03 | 0.71 | $ 27.43 | $ 57,060 |
| Connecticut | 70 | 0.04 | 1.12 | $ 27.27 | $ 56,720 |
| New York | 30 | 0.00 | 0.09 | $ 26.51 | $ 55,130 |
| Colorado | 40 | 0.01 | 0.34 | $ 26.42 | $ 54,950 |
Metropolitan areas with the highest employment level in Drilling and Boring Machine Tool Setters, Operators, and Tenders, Metal and Plastic:
| Metropolitan area | Employment (1) | Employment per thousand jobs | Location quotient (9) | Hourly mean wage | Annual mean wage (2) |
|---|---|---|---|---|---|
| Los Angeles-Long Beach-Anaheim, CA | 470 | 0.08 | 1.99 | $ 25.77 | $ 53,600 |
| Cincinnati, OH-KY-IN | 140 | 0.13 | 3.42 | $ 22.74 | $ 47,300 |
| San Jose-Sunnyvale-Santa Clara, CA | 140 | 0.12 | 3.16 | $ 23.32 | $ 48,500 |
| Cleveland-Elyria, OH | 130 | 0.13 | 3.36 | $ 22.68 | $ 47,170 |
| Houston-The Woodlands-Sugar Land, TX | 120 | 0.04 | 0.96 | $ 23.24 | $ 48,340 |
| Detroit-Warren-Dearborn, MI | 100 | 0.05 | 1.41 | $ 24.15 | $ 50,240 |
| Nashville-Davidson--Murfreesboro--Franklin, TN | 80 | 0.08 | 2.09 | $ 22.13 | $ 46,020 |
| Minneapolis-St. Paul-Bloomington, MN-WI | 70 | 0.04 | 0.96 | $ 20.05 | $ 41,710 |
| Boston-Cambridge-Nashua, MA-NH | 70 | 0.03 | 0.66 | $ 30.42 | $ 63,270 |
| Milwaukee-Waukesha-West Allis, WI | 60 | 0.08 | 2.10 | $ 18.33 | $ 38,120 |
Metropolitan areas with the highest concentration of jobs and location quotients in Drilling and Boring Machine Tool Setters, Operators, and Tenders, Metal and Plastic:
| Metropolitan area | Employment (1) | Employment per thousand jobs | Location quotient (9) | Hourly mean wage | Annual mean wage (2) |
|---|---|---|---|---|---|
| Des Moines-West Des Moines, IA | 50 | 0.13 | 3.47 | $ 18.88 | $ 39,260 |
| Cincinnati, OH-KY-IN | 140 | 0.13 | 3.42 | $ 22.74 | $ 47,300 |
| Cleveland-Elyria, OH | 130 | 0.13 | 3.36 | $ 22.68 | $ 47,170 |
| San Jose-Sunnyvale-Santa Clara, CA | 140 | 0.12 | 3.16 | $ 23.32 | $ 48,500 |
| Tulsa, OK | 50 | 0.11 | 2.98 | $ 21.06 | $ 43,810 |
| Memphis, TN-MS-AR | 60 | 0.09 | 2.42 | $ 19.40 | $ 40,340 |
| Milwaukee-Waukesha-West Allis, WI | 60 | 0.08 | 2.10 | $ 18.33 | $ 38,120 |
| Nashville-Davidson--Murfreesboro--Franklin, TN | 80 | 0.08 | 2.09 | $ 22.13 | $ 46,020 |
| Los Angeles-Long Beach-Anaheim, CA | 470 | 0.08 | 1.99 | $ 25.77 | $ 53,600 |
| Grand Rapids-Wyoming, MI | 40 | 0.07 | 1.77 | $ 21.95 | $ 45,660 |
Top paying metropolitan areas for Drilling and Boring Machine Tool Setters, Operators, and Tenders, Metal and Plastic:
| Metropolitan area | Employment (1) | Employment per thousand jobs | Location quotient (9) | Hourly mean wage | Annual mean wage (2) |
|---|---|---|---|---|---|
| Boston-Cambridge-Nashua, MA-NH | 70 | 0.03 | 0.66 | $ 30.42 | $ 63,270 |
| Portland-Vancouver-Hillsboro, OR-WA | 50 | 0.04 | 1.10 | $ 27.93 | $ 58,100 |
| Atlanta-Sandy Springs-Roswell, GA | 30 | 0.01 | 0.30 | $ 26.95 | $ 56,060 |
| Los Angeles-Long Beach-Anaheim, CA | 470 | 0.08 | 1.99 | $ 25.77 | $ 53,600 |
| San Francisco-Oakland-Hayward, CA | 40 | 0.02 | 0.41 | $ 24.99 | $ 51,980 |
| Detroit-Warren-Dearborn, MI | 100 | 0.05 | 1.41 | $ 24.15 | $ 50,240 |
| San Jose-Sunnyvale-Santa Clara, CA | 140 | 0.12 | 3.16 | $ 23.32 | $ 48,500 |
| New York-Newark-Jersey City, NY-NJ-PA | (8) | (8) | (8) | $ 23.31 | $ 48,480 |
| Houston-The Woodlands-Sugar Land, TX | 120 | 0.04 | 0.96 | $ 23.24 | $ 48,340 |
| Cincinnati, OH-KY-IN | 140 | 0.13 | 3.42 | $ 22.74 | $ 47,300 |
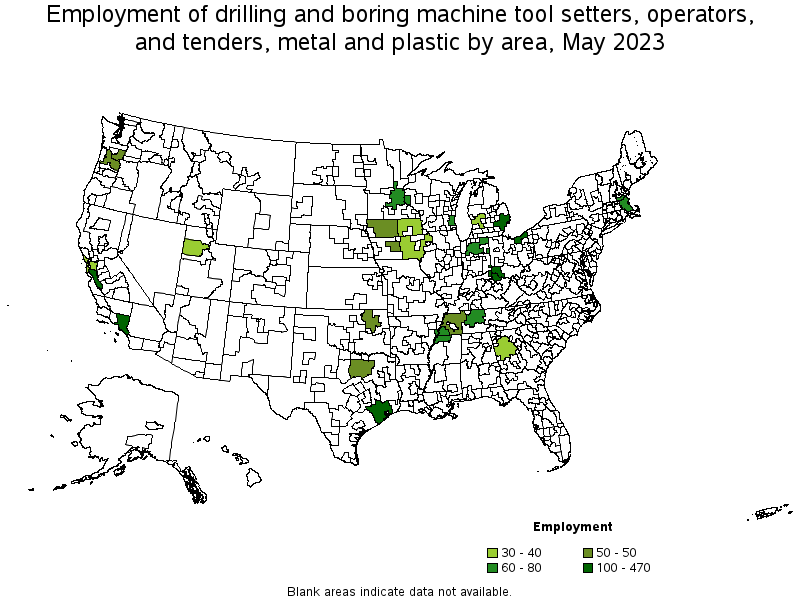
Nonmetropolitan areas with the highest employment in Drilling and Boring Machine Tool Setters, Operators, and Tenders, Metal and Plastic:
| Nonmetropolitan area | Employment (1) | Employment per thousand jobs | Location quotient (9) | Hourly mean wage | Annual mean wage (2) |
|---|---|---|---|---|---|
| Northern Indiana nonmetropolitan area | 60 | 0.26 | 6.91 | $ 22.76 | $ 47,340 |
| Northwest Iowa nonmetropolitan area | 50 | 0.40 | 10.62 | $ 19.89 | $ 41,380 |
| West Tennessee nonmetropolitan area | 50 | 0.38 | 9.94 | $ 15.94 | $ 33,150 |
| Northeast Iowa nonmetropolitan area | 40 | 0.41 | 10.91 | $ 19.03 | $ 39,590 |
| Southeast Iowa nonmetropolitan area | 40 | 0.18 | 4.83 | $ 19.16 | $ 39,860 |
Nonmetropolitan areas with the highest concentration of jobs and location quotients in Drilling and Boring Machine Tool Setters, Operators, and Tenders, Metal and Plastic:
| Nonmetropolitan area | Employment (1) | Employment per thousand jobs | Location quotient (9) | Hourly mean wage | Annual mean wage (2) |
|---|---|---|---|---|---|
| Northeast Iowa nonmetropolitan area | 40 | 0.41 | 10.91 | $ 19.03 | $ 39,590 |
| Northwest Iowa nonmetropolitan area | 50 | 0.40 | 10.62 | $ 19.89 | $ 41,380 |
| West Tennessee nonmetropolitan area | 50 | 0.38 | 9.94 | $ 15.94 | $ 33,150 |
| Northern Indiana nonmetropolitan area | 60 | 0.26 | 6.91 | $ 22.76 | $ 47,340 |
| Southeast Iowa nonmetropolitan area | 40 | 0.18 | 4.83 | $ 19.16 | $ 39,860 |
Top paying nonmetropolitan areas for Drilling and Boring Machine Tool Setters, Operators, and Tenders, Metal and Plastic:
| Nonmetropolitan area | Employment (1) | Employment per thousand jobs | Location quotient (9) | Hourly mean wage | Annual mean wage (2) |
|---|---|---|---|---|---|
| Northern Indiana nonmetropolitan area | 60 | 0.26 | 6.91 | $ 22.76 | $ 47,340 |
| Northwest Iowa nonmetropolitan area | 50 | 0.40 | 10.62 | $ 19.89 | $ 41,380 |
| Southeast Iowa nonmetropolitan area | 40 | 0.18 | 4.83 | $ 19.16 | $ 39,860 |
| Northeast Iowa nonmetropolitan area | 40 | 0.41 | 10.91 | $ 19.03 | $ 39,590 |
| West Tennessee nonmetropolitan area | 50 | 0.38 | 9.94 | $ 15.94 | $ 33,150 |
These estimates are calculated with data collected from employers in all industry sectors, all metropolitan and nonmetropolitan areas, and all states and the District of Columbia. The top employment and wage figures are provided above. The complete list is available in the downloadable XLS files.
The percentile wage estimate is the value of a wage below which a certain percent of workers fall. The median wage is the 50th percentile wage estimate—50 percent of workers earn less than the median and 50 percent of workers earn more than the median. More about percentile wages.
(1) Estimates for detailed occupations do not sum to the totals because the totals include occupations not shown separately. Estimates do not include self-employed workers.
(2) Annual wages have been calculated by multiplying the hourly mean wage by a "year-round, full-time" hours figure of 2,080 hours; for those occupations where there is not an hourly wage published, the annual wage has been directly calculated from the reported survey data.
(3) The relative standard error (RSE) is a measure of the reliability of a survey statistic. The smaller the relative standard error, the more precise the estimate.
(8) Estimate not released.
(9) The location quotient is the ratio of the area concentration of occupational employment to the national average concentration. A location quotient greater than one indicates the occupation has a higher share of employment than average, and a location quotient less than one indicates the occupation is less prevalent in the area than average.
Other OEWS estimates and related information:
May 2023 National Occupational Employment and Wage Estimates
May 2023 State Occupational Employment and Wage Estimates
May 2023 Metropolitan and Nonmetropolitan Area Occupational Employment and Wage Estimates
May 2023 National Industry-Specific Occupational Employment and Wage Estimates
Last Modified Date: April 3, 2024