
An official website of the United States government
An official website of the United States government
The .gov means it's official.
Federal government websites often end in .gov or .mil. Before sharing sensitive information,
make sure you're on a federal government site.
The site is secure.
The
https:// ensures that you are connecting to the official website and that any
information you provide is encrypted and transmitted securely.
This occupation includes 2018 SOC occupations 51-2022 Electrical and Electronic Equipment Assemblers and 51-2023 Electromechanical Equipment Assemblers.
Employment estimate and mean wage estimates for Electrical, Electronic, and Electromechanical Assemblers, Except Coil Winders, Tapers, and Finishers:
| Employment (1) | Employment RSE (3) |
Mean hourly wage |
Mean annual wage (2) |
Wage RSE (3) |
|---|---|---|---|---|
| 267,440 | 1.0 % | $ 21.03 | $ 43,740 | 0.4 % |
Percentile wage estimates for Electrical, Electronic, and Electromechanical Assemblers, Except Coil Winders, Tapers, and Finishers:
| Percentile | 10% | 25% | 50% (Median) |
75% | 90% |
|---|---|---|---|---|---|
| Hourly Wage | $ 15.04 | $ 17.40 | $ 19.47 | $ 23.19 | $ 28.51 |
| Annual Wage (2) | $ 31,290 | $ 36,190 | $ 40,490 | $ 48,230 | $ 59,310 |
Industries with the highest published employment and wages for Electrical, Electronic, and Electromechanical Assemblers, Except Coil Winders, Tapers, and Finishers are provided. For a list of all industries with employment in Electrical, Electronic, and Electromechanical Assemblers, Except Coil Winders, Tapers, and Finishers, see the Create Customized Tables function.
Industries with the highest levels of employment in Electrical, Electronic, and Electromechanical Assemblers, Except Coil Winders, Tapers, and Finishers:
| Industry | Employment (1) | Percent of industry employment | Hourly mean wage | Annual mean wage (2) |
|---|---|---|---|---|
| Semiconductor and Other Electronic Component Manufacturing | 56,220 | 14.34 | $ 19.30 | $ 40,150 |
| Navigational, Measuring, Electromedical, and Control Instruments Manufacturing | 38,490 | 9.07 | $ 22.38 | $ 46,550 |
| Electrical Equipment Manufacturing | 30,740 | 21.09 | $ 21.17 | $ 44,040 |
| Other Electrical Equipment and Component Manufacturing | 28,960 | 18.00 | $ 20.38 | $ 42,390 |
| Machinery Manufacturing (3331, 3332, 3334, and 3339 only) | 17,850 | 2.30 | $ 22.52 | $ 46,840 |
Industries with the highest concentration of employment in Electrical, Electronic, and Electromechanical Assemblers, Except Coil Winders, Tapers, and Finishers:
| Industry | Employment (1) | Percent of industry employment | Hourly mean wage | Annual mean wage (2) |
|---|---|---|---|---|
| Electrical Equipment Manufacturing | 30,740 | 21.09 | $ 21.17 | $ 44,040 |
| Other Electrical Equipment and Component Manufacturing | 28,960 | 18.00 | $ 20.38 | $ 42,390 |
| Electric Lighting Equipment Manufacturing | 5,770 | 15.11 | $ 19.50 | $ 40,560 |
| Semiconductor and Other Electronic Component Manufacturing | 56,220 | 14.34 | $ 19.30 | $ 40,150 |
| Communications Equipment Manufacturing | 8,970 | 10.72 | $ 21.41 | $ 44,540 |
Top paying industries for Electrical, Electronic, and Electromechanical Assemblers, Except Coil Winders, Tapers, and Finishers:
| Industry | Employment (1) | Percent of industry employment | Hourly mean wage | Annual mean wage (2) |
|---|---|---|---|---|
| Motor Vehicle Manufacturing | 770 | 0.27 | $ 30.82 | $ 64,100 |
| Other Professional, Scientific, and Technical Services | (8) | (8) | $ 30.41 | $ 63,240 |
| Scientific Research and Development Services | 1,420 | 0.15 | $ 29.25 | $ 60,830 |
| Aerospace Product and Parts Manufacturing | 5,530 | 1.08 | $ 28.99 | $ 60,300 |
| Management, Scientific, and Technical Consulting Services | (8) | (8) | $ 26.99 | $ 56,140 |
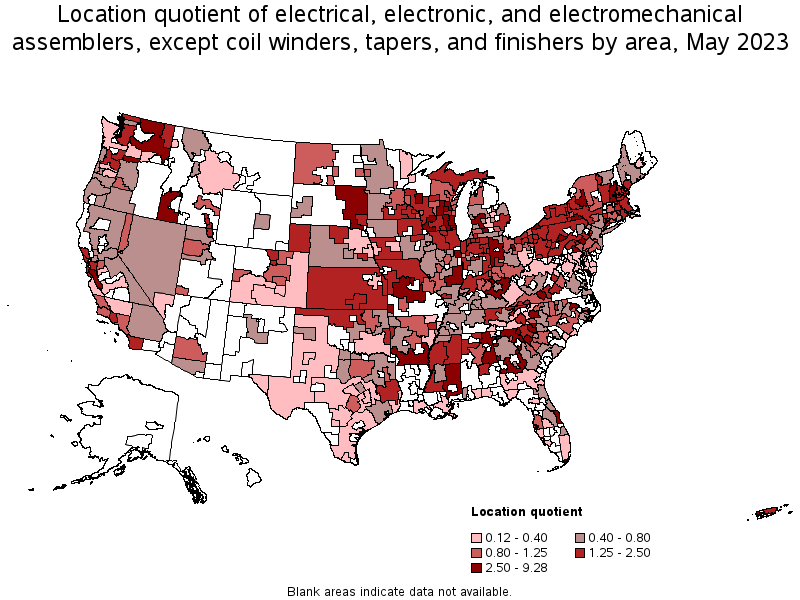
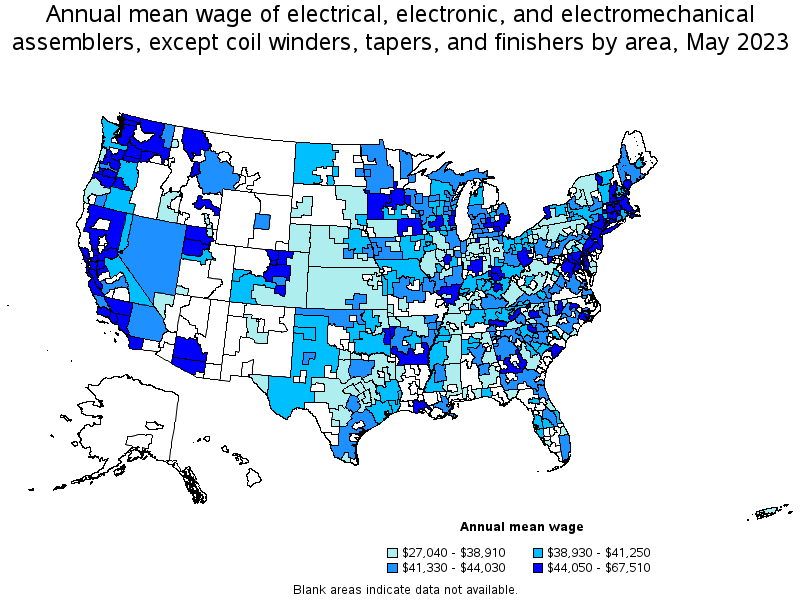
States and areas with the highest published employment, location quotients, and wages for Electrical, Electronic, and Electromechanical Assemblers, Except Coil Winders, Tapers, and Finishers are provided. For a list of all areas with employment in Electrical, Electronic, and Electromechanical Assemblers, Except Coil Winders, Tapers, and Finishers, see the Create Customized Tables function.
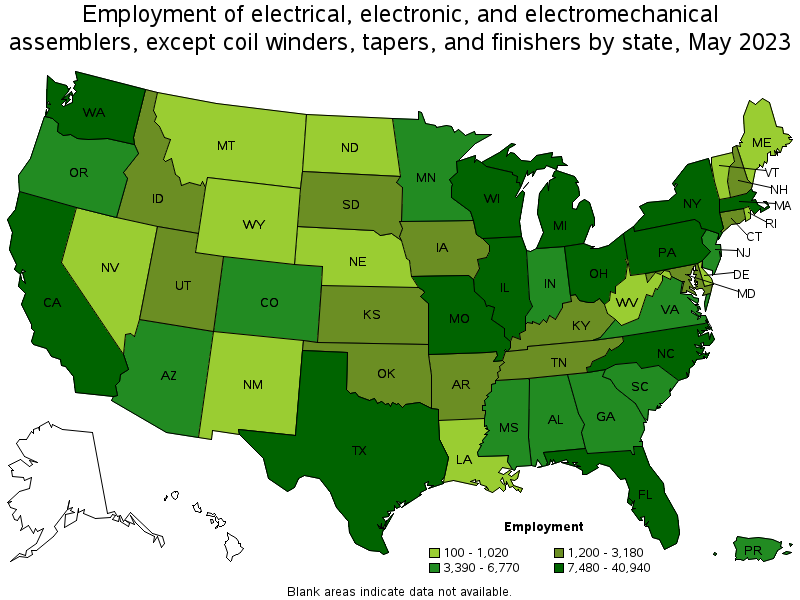
States with the highest employment level in Electrical, Electronic, and Electromechanical Assemblers, Except Coil Winders, Tapers, and Finishers:
| State | Employment (1) | Employment per thousand jobs | Location quotient (9) | Hourly mean wage | Annual mean wage (2) |
|---|---|---|---|---|---|
| California | 40,940 | 2.28 | 1.30 | $ 23.62 | $ 49,130 |
| Texas | 16,170 | 1.19 | 0.68 | $ 19.54 | $ 40,640 |
| Pennsylvania | 15,970 | 2.68 | 1.52 | $ 19.98 | $ 41,560 |
| Illinois | 13,920 | 2.32 | 1.31 | $ 19.93 | $ 41,440 |
| New York | 12,800 | 1.36 | 0.77 | $ 20.73 | $ 43,120 |
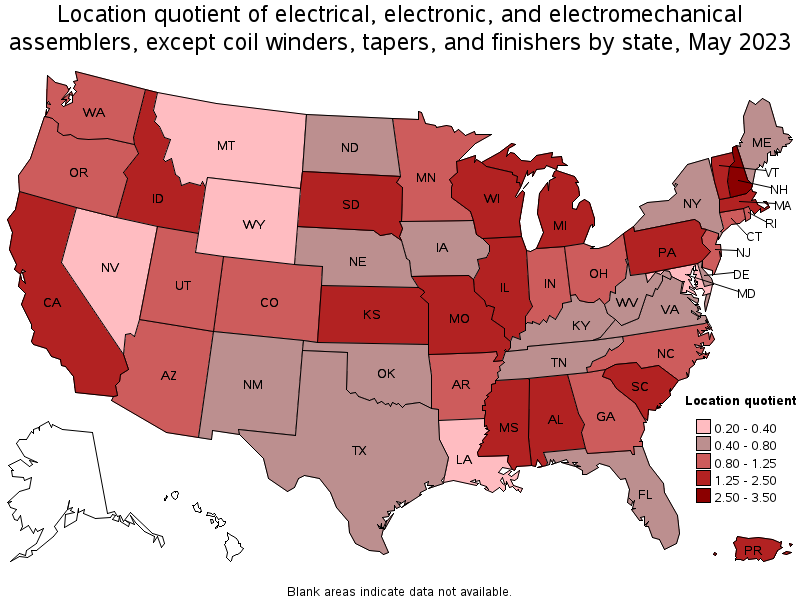
States with the highest concentration of jobs and location quotients in Electrical, Electronic, and Electromechanical Assemblers, Except Coil Winders, Tapers, and Finishers:
| State | Employment (1) | Employment per thousand jobs | Location quotient (9) | Hourly mean wage | Annual mean wage (2) |
|---|---|---|---|---|---|
| New Hampshire | 3,110 | 4.61 | 2.62 | $ 22.15 | $ 46,070 |
| South Dakota | 1,780 | 4.01 | 2.28 | $ 17.92 | $ 37,270 |
| Wisconsin | 11,390 | 3.94 | 2.24 | $ 20.77 | $ 43,200 |
| Mississippi | 4,430 | 3.85 | 2.19 | $ 18.18 | $ 37,820 |
| Missouri | 8,340 | 2.90 | 1.65 | $ 19.99 | $ 41,580 |
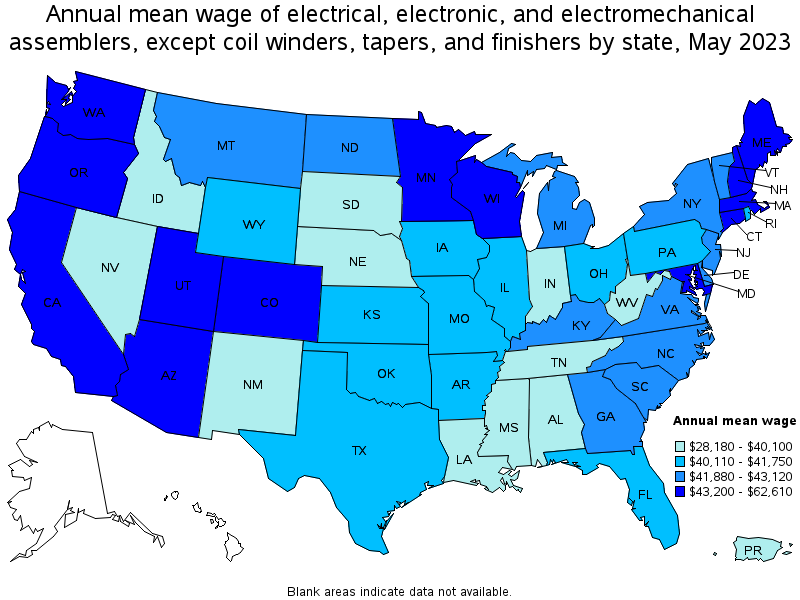
Top paying states for Electrical, Electronic, and Electromechanical Assemblers, Except Coil Winders, Tapers, and Finishers:
| State | Employment (1) | Employment per thousand jobs | Location quotient (9) | Hourly mean wage | Annual mean wage (2) |
|---|---|---|---|---|---|
| Maryland | 1,200 | 0.45 | 0.26 | $ 30.10 | $ 62,610 |
| Connecticut | 3,170 | 1.91 | 1.08 | $ 25.28 | $ 52,580 |
| Washington | 7,480 | 2.14 | 1.22 | $ 24.44 | $ 50,840 |
| California | 40,940 | 2.28 | 1.30 | $ 23.62 | $ 49,130 |
| Colorado | 4,660 | 1.65 | 0.94 | $ 22.84 | $ 47,510 |
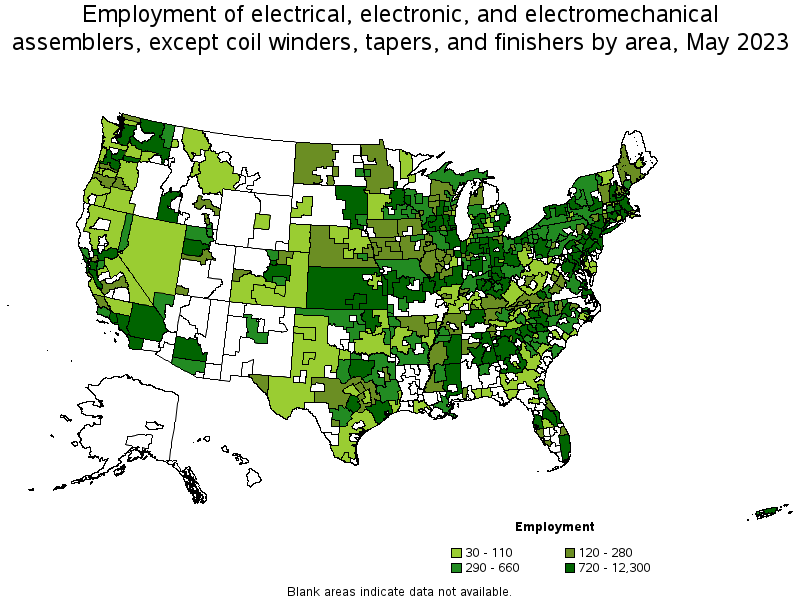
Metropolitan areas with the highest employment level in Electrical, Electronic, and Electromechanical Assemblers, Except Coil Winders, Tapers, and Finishers:
| Metropolitan area | Employment (1) | Employment per thousand jobs | Location quotient (9) | Hourly mean wage | Annual mean wage (2) |
|---|---|---|---|---|---|
| Los Angeles-Long Beach-Anaheim, CA | 12,300 | 1.99 | 1.13 | $ 21.89 | $ 45,530 |
| Chicago-Naperville-Elgin, IL-IN-WI | 10,160 | 2.25 | 1.28 | $ 20.11 | $ 41,830 |
| San Jose-Sunnyvale-Santa Clara, CA | 9,140 | 8.01 | 4.55 | $ 26.01 | $ 54,090 |
| New York-Newark-Jersey City, NY-NJ-PA | 8,860 | 0.93 | 0.53 | $ 21.30 | $ 44,310 |
| Boston-Cambridge-Nashua, MA-NH | 8,840 | 3.20 | 1.82 | $ 23.26 | $ 48,370 |
| Dallas-Fort Worth-Arlington, TX | 6,730 | 1.70 | 0.96 | $ 20.21 | $ 42,030 |
| San Francisco-Oakland-Hayward, CA | 5,790 | 2.39 | 1.36 | $ 26.29 | $ 54,680 |
| San Diego-Carlsbad, CA | 5,790 | 3.80 | 2.16 | $ 22.49 | $ 46,790 |
| Seattle-Tacoma-Bellevue, WA | 4,620 | 2.22 | 1.26 | $ 26.20 | $ 54,500 |
| Phoenix-Mesa-Scottsdale, AZ | 4,350 | 1.90 | 1.08 | $ 22.87 | $ 47,560 |
Metropolitan areas with the highest concentration of jobs and location quotients in Electrical, Electronic, and Electromechanical Assemblers, Except Coil Winders, Tapers, and Finishers:
| Metropolitan area | Employment (1) | Employment per thousand jobs | Location quotient (9) | Hourly mean wage | Annual mean wage (2) |
|---|---|---|---|---|---|
| Reading, PA | 2,600 | 15.29 | 8.68 | $ 19.58 | $ 40,730 |
| Racine, WI | 830 | 10.98 | 6.24 | $ 20.74 | $ 43,140 |
| Blacksburg-Christiansburg-Radford, VA | 750 | 10.39 | 5.90 | $ 19.77 | $ 41,120 |
| Hickory-Lenoir-Morganton, NC | 1,470 | 9.52 | 5.41 | $ 21.89 | $ 45,520 |
| San Jose-Sunnyvale-Santa Clara, CA | 9,140 | 8.01 | 4.55 | $ 26.01 | $ 54,090 |
| Battle Creek, MI | 420 | 7.97 | 4.53 | $ 20.71 | $ 43,070 |
| Oshkosh-Neenah, WI | 720 | 7.77 | 4.41 | $ 20.62 | $ 42,890 |
| Binghamton, NY | 660 | 6.91 | 3.93 | $ 19.52 | $ 40,600 |
| Spartanburg, SC | 950 | 5.96 | 3.39 | $ 22.53 | $ 46,870 |
| Columbia, MO | 570 | 5.83 | 3.31 | $ 19.34 | $ 40,220 |
Top paying metropolitan areas for Electrical, Electronic, and Electromechanical Assemblers, Except Coil Winders, Tapers, and Finishers:
| Metropolitan area | Employment (1) | Employment per thousand jobs | Location quotient (9) | Hourly mean wage | Annual mean wage (2) |
|---|---|---|---|---|---|
| Idaho Falls, ID | 140 | 1.82 | 1.03 | $ 32.46 | $ 67,510 |
| Baltimore-Columbia-Towson, MD | 850 | 0.65 | 0.37 | $ 31.97 | $ 66,490 |
| Bridgeport-Stamford-Norwalk, CT | 950 | 2.36 | 1.34 | $ 30.09 | $ 62,580 |
| San Francisco-Oakland-Hayward, CA | 5,790 | 2.39 | 1.36 | $ 26.29 | $ 54,680 |
| Seattle-Tacoma-Bellevue, WA | 4,620 | 2.22 | 1.26 | $ 26.20 | $ 54,500 |
| Santa Rosa, CA | 590 | 2.84 | 1.61 | $ 26.10 | $ 54,300 |
| San Jose-Sunnyvale-Santa Clara, CA | 9,140 | 8.01 | 4.55 | $ 26.01 | $ 54,090 |
| Charleston-North Charleston, SC | 510 | 1.35 | 0.77 | $ 25.15 | $ 52,310 |
| Stockton-Lodi, CA | 490 | 1.78 | 1.01 | $ 24.97 | $ 51,940 |
| Hartford-West Hartford-East Hartford, CT | 890 | 1.58 | 0.90 | $ 24.64 | $ 51,240 |
Nonmetropolitan areas with the highest employment in Electrical, Electronic, and Electromechanical Assemblers, Except Coil Winders, Tapers, and Finishers:
| Nonmetropolitan area | Employment (1) | Employment per thousand jobs | Location quotient (9) | Hourly mean wage | Annual mean wage (2) |
|---|---|---|---|---|---|
| Southeast Mississippi nonmetropolitan area | 2,400 | 16.35 | 9.28 | $ 18.11 | $ 37,670 |
| North Georgia nonmetropolitan area | 1,690 | 8.80 | 5.00 | $ 19.89 | $ 41,370 |
| West Northwestern Ohio nonmetropolitan area | 1,570 | 6.31 | 3.59 | $ 18.55 | $ 38,590 |
| East Central Illinois nonmetropolitan area | 1,450 | 12.48 | 7.09 | $ 20.34 | $ 42,310 |
| Kansas nonmetropolitan area | 1,250 | 3.22 | 1.83 | $ 18.46 | $ 38,410 |
Nonmetropolitan areas with the highest concentration of jobs and location quotients in Electrical, Electronic, and Electromechanical Assemblers, Except Coil Winders, Tapers, and Finishers:
| Nonmetropolitan area | Employment (1) | Employment per thousand jobs | Location quotient (9) | Hourly mean wage | Annual mean wage (2) |
|---|---|---|---|---|---|
| Southeast Mississippi nonmetropolitan area | 2,400 | 16.35 | 9.28 | $ 18.11 | $ 37,670 |
| East Central Illinois nonmetropolitan area | 1,450 | 12.48 | 7.09 | $ 20.34 | $ 42,310 |
| North Georgia nonmetropolitan area | 1,690 | 8.80 | 5.00 | $ 19.89 | $ 41,370 |
| East South Dakota nonmetropolitan area | 1,140 | 8.62 | 4.90 | $ 17.54 | $ 36,480 |
| Eastern Washington nonmetropolitan area | 860 | 8.28 | 4.70 | $ 22.55 | $ 46,910 |
Top paying nonmetropolitan areas for Electrical, Electronic, and Electromechanical Assemblers, Except Coil Winders, Tapers, and Finishers:
| Nonmetropolitan area | Employment (1) | Employment per thousand jobs | Location quotient (9) | Hourly mean wage | Annual mean wage (2) |
|---|---|---|---|---|---|
| Maryland nonmetropolitan area | 30 | 0.56 | 0.32 | $ 24.01 | $ 49,940 |
| North Valley-Northern Mountains Region of California nonmetropolitan area | 70 | 0.71 | 0.40 | $ 23.15 | $ 48,150 |
| Northeast Iowa nonmetropolitan area | 240 | 2.48 | 1.41 | $ 22.95 | $ 47,730 |
| Middle Georgia nonmetropolitan area | 740 | 5.67 | 3.22 | $ 22.85 | $ 47,530 |
| Eastern Washington nonmetropolitan area | 860 | 8.28 | 4.70 | $ 22.55 | $ 46,910 |
These estimates are calculated with data collected from employers in all industry sectors, all metropolitan and nonmetropolitan areas, and all states and the District of Columbia. The top employment and wage figures are provided above. The complete list is available in the downloadable XLS files.
The percentile wage estimate is the value of a wage below which a certain percent of workers fall. The median wage is the 50th percentile wage estimate—50 percent of workers earn less than the median and 50 percent of workers earn more than the median. More about percentile wages.
(1) Estimates for detailed occupations do not sum to the totals because the totals include occupations not shown separately. Estimates do not include self-employed workers.
(2) Annual wages have been calculated by multiplying the hourly mean wage by a "year-round, full-time" hours figure of 2,080 hours; for those occupations where there is not an hourly wage published, the annual wage has been directly calculated from the reported survey data.
(3) The relative standard error (RSE) is a measure of the reliability of a survey statistic. The smaller the relative standard error, the more precise the estimate.
(8) Estimate not released.
(9) The location quotient is the ratio of the area concentration of occupational employment to the national average concentration. A location quotient greater than one indicates the occupation has a higher share of employment than average, and a location quotient less than one indicates the occupation is less prevalent in the area than average.
Other OEWS estimates and related information:
May 2023 National Occupational Employment and Wage Estimates
May 2023 State Occupational Employment and Wage Estimates
May 2023 Metropolitan and Nonmetropolitan Area Occupational Employment and Wage Estimates
May 2023 National Industry-Specific Occupational Employment and Wage Estimates
Last Modified Date: April 3, 2024