
An official website of the United States government
An official website of the United States government
The .gov means it's official.
Federal government websites often end in .gov or .mil. Before sharing sensitive information,
make sure you're on a federal government site.
The site is secure.
The
https:// ensures that you are connecting to the official website and that any
information you provide is encrypted and transmitted securely.
Perform work involving the skills of two or more maintenance or craft occupations to keep machines, mechanical equipment, or the structure of a building in repair. Duties may involve pipe fitting; HVAC maintenance; insulating; welding; machining; carpentry; repairing electrical or mechanical equipment; installing, aligning, and balancing new equipment; and repairing buildings, floors, or stairs. Excludes �Facilities Managers� (11-3013) and �Maintenance Workers, Machinery� (49-9043).
Employment estimate and mean wage estimates for Maintenance and Repair Workers, General:
| Employment (1) | Employment RSE (3) |
Mean hourly wage |
Mean annual wage (2) |
Wage RSE (3) |
|---|---|---|---|---|
| 1,503,150 | 0.8 % | $ 23.87 | $ 49,650 | 0.2 % |
Percentile wage estimates for Maintenance and Repair Workers, General:
| Percentile | 10% | 25% | 50% (Median) |
75% | 90% |
|---|---|---|---|---|---|
| Hourly Wage | $ 14.84 | $ 17.87 | $ 22.45 | $ 28.67 | $ 35.33 |
| Annual Wage (2) | $ 30,860 | $ 37,160 | $ 46,700 | $ 59,640 | $ 73,490 |
Industries with the highest published employment and wages for Maintenance and Repair Workers, General are provided. For a list of all industries with employment in Maintenance and Repair Workers, General, see the Create Customized Tables function.
Industries with the highest levels of employment in Maintenance and Repair Workers, General:
| Industry | Employment (1) | Percent of industry employment | Hourly mean wage | Annual mean wage (2) |
|---|---|---|---|---|
| Real Estate | 303,120 | 16.74 | $ 22.92 | $ 47,670 |
| Local Government, excluding Schools and Hospitals (OEWS Designation) | 140,280 | 2.55 | $ 24.80 | $ 51,570 |
| Traveler Accommodation | 86,170 | 4.66 | $ 20.17 | $ 41,960 |
| Elementary and Secondary Schools | 74,500 | 0.87 | $ 24.27 | $ 50,480 |
| Employment Services | 32,720 | 0.87 | $ 20.56 | $ 42,750 |
Industries with the highest concentration of employment in Maintenance and Repair Workers, General:
| Industry | Employment (1) | Percent of industry employment | Hourly mean wage | Annual mean wage (2) |
|---|---|---|---|---|
| Real Estate | 303,120 | 16.74 | $ 22.92 | $ 47,670 |
| RV (Recreational Vehicle) Parks and Recreational Camps | 9,300 | 14.43 | $ 18.03 | $ 37,490 |
| Facilities Support Services | 12,990 | 6.81 | $ 26.85 | $ 55,850 |
| Rooming and Boarding Houses, Dormitories, and Workers' Camps | 660 | 6.63 | $ 19.90 | $ 41,390 |
| Water, Sewage and Other Systems | 2,750 | 4.72 | $ 25.48 | $ 53,010 |
Top paying industries for Maintenance and Repair Workers, General:
| Industry | Employment (1) | Percent of industry employment | Hourly mean wage | Annual mean wage (2) |
|---|---|---|---|---|
| Pipeline Transportation of Crude Oil | 60 | 0.53 | $ 42.10 | $ 87,580 |
| Electric Power Generation, Transmission and Distribution | 4,310 | 1.09 | $ 41.98 | $ 87,310 |
| Scheduled Air Transportation | 1,650 | 0.34 | $ 41.62 | $ 86,580 |
| Media Streaming Distribution Services, Social Networks, and Other Media Networks and Content Providers | 560 | 0.24 | $ 40.97 | $ 85,220 |
| Oil and Gas Extraction | 710 | 0.65 | $ 39.30 | $ 81,740 |
States and areas with the highest published employment, location quotients, and wages for Maintenance and Repair Workers, General are provided. For a list of all areas with employment in Maintenance and Repair Workers, General, see the Create Customized Tables function.
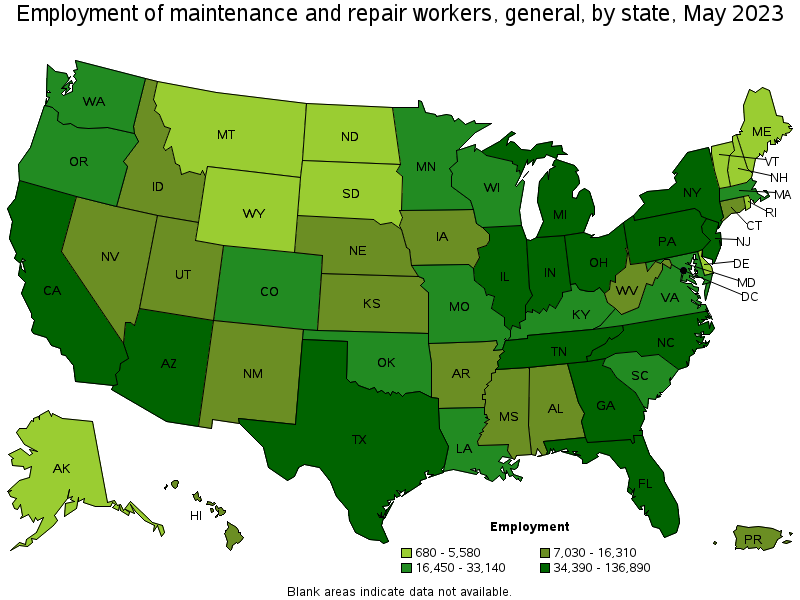
States with the highest employment level in Maintenance and Repair Workers, General:
| State | Employment (1) | Employment per thousand jobs | Location quotient (9) | Hourly mean wage | Annual mean wage (2) |
|---|---|---|---|---|---|
| Texas | 136,890 | 10.10 | 1.02 | $ 21.03 | $ 43,740 |
| New York | 132,590 | 14.12 | 1.43 | $ 27.28 | $ 56,740 |
| California | 132,580 | 7.39 | 0.75 | $ 27.32 | $ 56,830 |
| Florida | 102,700 | 10.73 | 1.08 | $ 21.14 | $ 43,960 |
| Illinois | 66,830 | 11.12 | 1.12 | $ 26.00 | $ 54,070 |
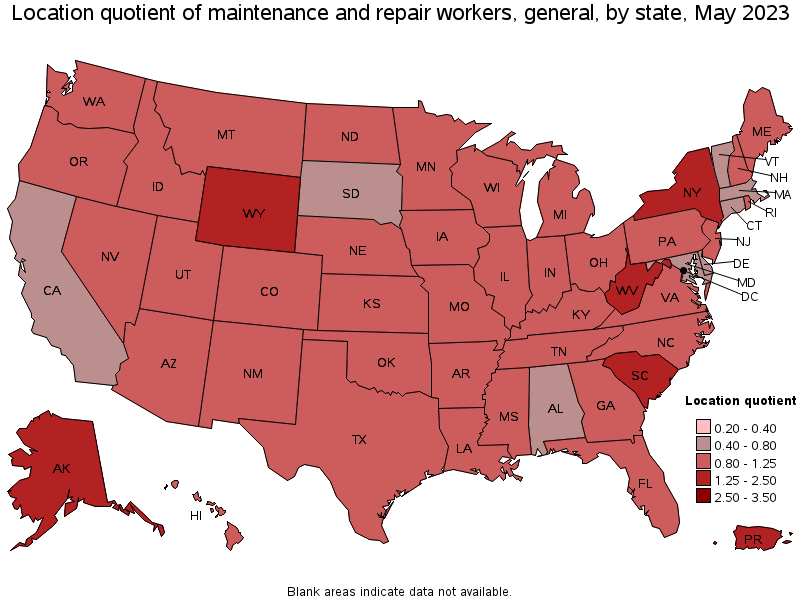
States with the highest concentration of jobs and location quotients in Maintenance and Repair Workers, General:
| State | Employment (1) | Employment per thousand jobs | Location quotient (9) | Hourly mean wage | Annual mean wage (2) |
|---|---|---|---|---|---|
| Wyoming | 3,990 | 14.57 | 1.47 | $ 22.89 | $ 47,620 |
| New York | 132,590 | 14.12 | 1.43 | $ 27.28 | $ 56,740 |
| Alaska | 4,170 | 13.37 | 1.35 | $ 28.75 | $ 59,800 |
| West Virginia | 8,890 | 12.91 | 1.30 | $ 19.98 | $ 41,560 |
| South Carolina | 28,300 | 12.73 | 1.29 | $ 22.34 | $ 46,480 |
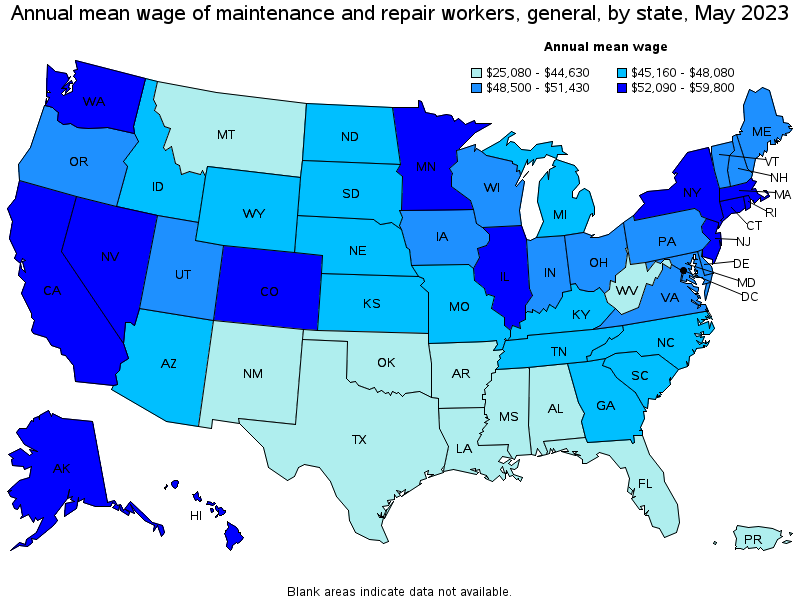
Top paying states for Maintenance and Repair Workers, General:
| State | Employment (1) | Employment per thousand jobs | Location quotient (9) | Hourly mean wage | Annual mean wage (2) |
|---|---|---|---|---|---|
| Alaska | 4,170 | 13.37 | 1.35 | $ 28.75 | $ 59,800 |
| District of Columbia | 4,600 | 6.56 | 0.66 | $ 27.52 | $ 57,250 |
| California | 132,580 | 7.39 | 0.75 | $ 27.32 | $ 56,830 |
| Washington | 31,620 | 9.05 | 0.91 | $ 27.28 | $ 56,750 |
| New York | 132,590 | 14.12 | 1.43 | $ 27.28 | $ 56,740 |
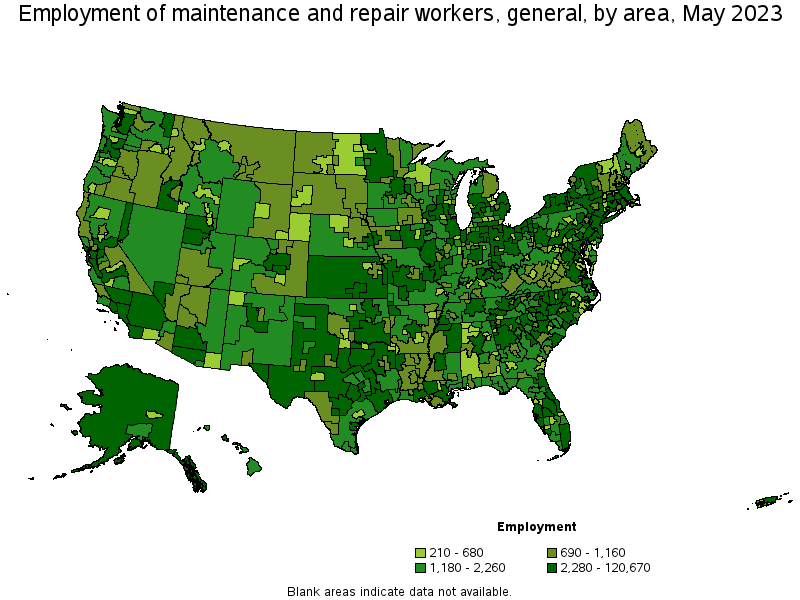
Metropolitan areas with the highest employment level in Maintenance and Repair Workers, General:
| Metropolitan area | Employment (1) | Employment per thousand jobs | Location quotient (9) | Hourly mean wage | Annual mean wage (2) |
|---|---|---|---|---|---|
| New York-Newark-Jersey City, NY-NJ-PA | 120,670 | 12.71 | 1.28 | $ 28.10 | $ 58,460 |
| Chicago-Naperville-Elgin, IL-IN-WI | 46,290 | 10.27 | 1.04 | $ 26.93 | $ 56,020 |
| Los Angeles-Long Beach-Anaheim, CA | 43,910 | 7.10 | 0.72 | $ 26.64 | $ 55,410 |
| Dallas-Fort Worth-Arlington, TX | 38,890 | 9.80 | 0.99 | $ 22.28 | $ 46,330 |
| Miami-Fort Lauderdale-West Palm Beach, FL | 31,010 | 11.39 | 1.15 | $ 21.67 | $ 45,080 |
| Houston-The Woodlands-Sugar Land, TX | 30,520 | 9.60 | 0.97 | $ 21.75 | $ 45,250 |
| Atlanta-Sandy Springs-Roswell, GA | 23,600 | 8.38 | 0.85 | $ 23.56 | $ 49,000 |
| Philadelphia-Camden-Wilmington, PA-NJ-DE-MD | 23,340 | 8.25 | 0.83 | $ 24.58 | $ 51,130 |
| Phoenix-Mesa-Scottsdale, AZ | 22,980 | 10.04 | 1.01 | $ 24.08 | $ 50,080 |
| Washington-Arlington-Alexandria, DC-VA-MD-WV | 22,620 | 7.31 | 0.74 | $ 26.32 | $ 54,740 |
Metropolitan areas with the highest concentration of jobs and location quotients in Maintenance and Repair Workers, General:
| Metropolitan area | Employment (1) | Employment per thousand jobs | Location quotient (9) | Hourly mean wage | Annual mean wage (2) |
|---|---|---|---|---|---|
| Athens-Clarke County, GA | 1,760 | 19.44 | 1.96 | $ 19.36 | $ 40,270 |
| Watertown-Fort Drum, NY | 740 | 19.09 | 1.93 | $ 22.31 | $ 46,400 |
| State College, PA | 1,270 | 18.76 | 1.90 | $ 25.76 | $ 53,570 |
| Lake Charles, LA | 1,710 | 18.72 | 1.89 | $ 25.89 | $ 53,840 |
| Ocean City, NJ | 750 | 18.67 | 1.89 | $ 21.53 | $ 44,770 |
| Kahului-Wailuku-Lahaina, HI | 1,340 | 17.71 | 1.79 | $ 28.70 | $ 59,690 |
| Decatur, IL | 780 | 16.94 | 1.71 | $ 25.83 | $ 53,720 |
| Carbondale-Marion, IL | 900 | 16.89 | 1.71 | $ 21.94 | $ 45,630 |
| Flagstaff, AZ | 1,070 | 16.78 | 1.70 | $ 21.37 | $ 44,440 |
| Dalton, GA | 1,080 | 16.45 | 1.66 | $ 20.78 | $ 43,220 |
Top paying metropolitan areas for Maintenance and Repair Workers, General:
| Metropolitan area | Employment (1) | Employment per thousand jobs | Location quotient (9) | Hourly mean wage | Annual mean wage (2) |
|---|---|---|---|---|---|
| San Jose-Sunnyvale-Santa Clara, CA | 7,540 | 6.61 | 0.67 | $ 32.37 | $ 67,330 |
| San Francisco-Oakland-Hayward, CA | 15,570 | 6.43 | 0.65 | $ 32.23 | $ 67,030 |
| Kahului-Wailuku-Lahaina, HI | 1,340 | 17.71 | 1.79 | $ 28.70 | $ 59,690 |
| Seattle-Tacoma-Bellevue, WA | 16,970 | 8.16 | 0.82 | $ 28.58 | $ 59,440 |
| Vallejo-Fairfield, CA | 1,120 | 8.10 | 0.82 | $ 28.51 | $ 59,300 |
| Napa, CA | 730 | 9.39 | 0.95 | $ 28.47 | $ 59,210 |
| Santa Rosa, CA | 1,710 | 8.27 | 0.84 | $ 28.24 | $ 58,740 |
| New York-Newark-Jersey City, NY-NJ-PA | 120,670 | 12.71 | 1.28 | $ 28.10 | $ 58,460 |
| Boulder, CO | 1,210 | 6.22 | 0.63 | $ 28.09 | $ 58,430 |
| Boston-Cambridge-Nashua, MA-NH | 19,280 | 6.98 | 0.71 | $ 27.94 | $ 58,110 |
Nonmetropolitan areas with the highest employment in Maintenance and Repair Workers, General:
| Nonmetropolitan area | Employment (1) | Employment per thousand jobs | Location quotient (9) | Hourly mean wage | Annual mean wage (2) |
|---|---|---|---|---|---|
| Kansas nonmetropolitan area | 5,210 | 13.42 | 1.36 | $ 19.97 | $ 41,540 |
| North Northeastern Ohio nonmetropolitan area (noncontiguous) | 5,040 | 15.49 | 1.56 | $ 23.39 | $ 48,660 |
| North Texas Region of Texas nonmetropolitan area | 3,920 | 14.06 | 1.42 | $ 20.44 | $ 42,500 |
| West Northwestern Ohio nonmetropolitan area | 3,570 | 14.36 | 1.45 | $ 24.61 | $ 51,180 |
| Northern Indiana nonmetropolitan area | 3,570 | 16.80 | 1.70 | $ 23.79 | $ 49,490 |
Nonmetropolitan areas with the highest concentration of jobs and location quotients in Maintenance and Repair Workers, General:
| Nonmetropolitan area | Employment (1) | Employment per thousand jobs | Location quotient (9) | Hourly mean wage | Annual mean wage (2) |
|---|---|---|---|---|---|
| Alaska nonmetropolitan area | 2,370 | 23.00 | 2.32 | $ 30.82 | $ 64,100 |
| Arizona nonmetropolitan area | 2,000 | 21.33 | 2.15 | $ 20.71 | $ 43,070 |
| South Florida nonmetropolitan area | 1,660 | 19.76 | 2.00 | $ 21.02 | $ 43,730 |
| Western Wyoming nonmetropolitan area | 1,870 | 18.80 | 1.90 | $ 24.47 | $ 50,900 |
| Upper Savannah South Carolina nonmetropolitan area | 1,470 | 18.43 | 1.86 | $ 23.45 | $ 48,770 |
Top paying nonmetropolitan areas for Maintenance and Repair Workers, General:
| Nonmetropolitan area | Employment (1) | Employment per thousand jobs | Location quotient (9) | Hourly mean wage | Annual mean wage (2) |
|---|---|---|---|---|---|
| Alaska nonmetropolitan area | 2,370 | 23.00 | 2.32 | $ 30.82 | $ 64,100 |
| Hawaii / Kauai nonmetropolitan area | 1,490 | 14.70 | 1.48 | $ 26.92 | $ 55,990 |
| South Illinois nonmetropolitan area | 1,320 | 15.21 | 1.54 | $ 25.82 | $ 53,710 |
| Eastern Washington nonmetropolitan area | 1,460 | 14.10 | 1.42 | $ 25.17 | $ 52,360 |
| Southeast Minnesota nonmetropolitan area | 1,800 | 11.93 | 1.21 | $ 25.11 | $ 52,230 |
These estimates are calculated with data collected from employers in all industry sectors, all metropolitan and nonmetropolitan areas, and all states and the District of Columbia. The top employment and wage figures are provided above. The complete list is available in the downloadable XLS files.
The percentile wage estimate is the value of a wage below which a certain percent of workers fall. The median wage is the 50th percentile wage estimate—50 percent of workers earn less than the median and 50 percent of workers earn more than the median. More about percentile wages.
(1) Estimates for detailed occupations do not sum to the totals because the totals include occupations not shown separately. Estimates do not include self-employed workers.
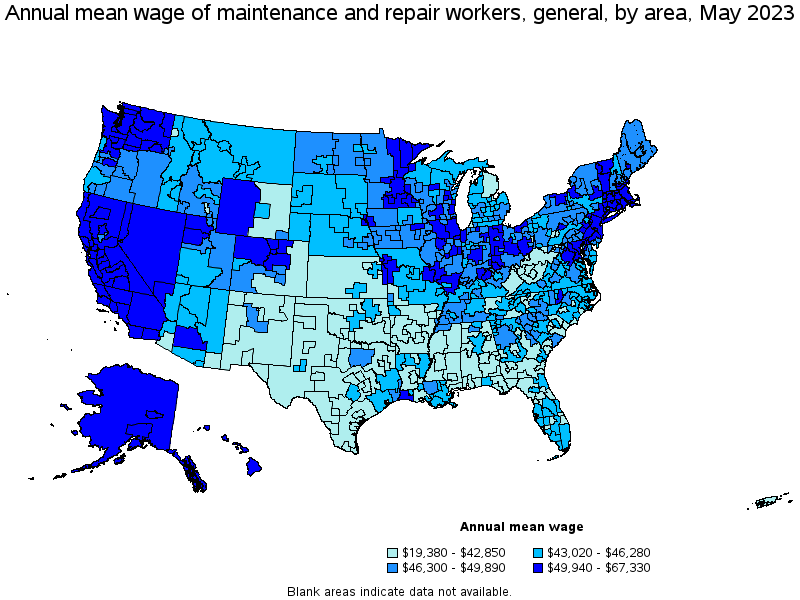
(2) Annual wages have been calculated by multiplying the hourly mean wage by a "year-round, full-time" hours figure of 2,080 hours; for those occupations where there is not an hourly wage published, the annual wage has been directly calculated from the reported survey data.
(3) The relative standard error (RSE) is a measure of the reliability of a survey statistic. The smaller the relative standard error, the more precise the estimate.
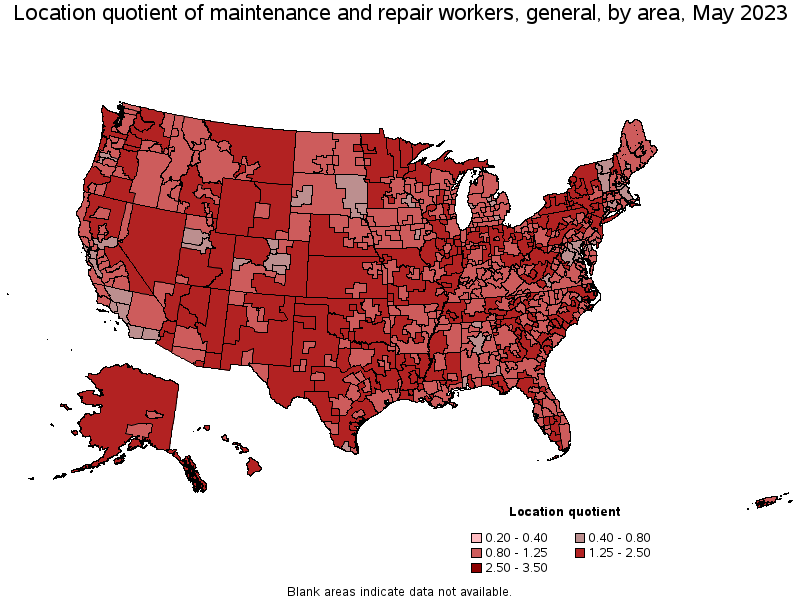
(9) The location quotient is the ratio of the area concentration of occupational employment to the national average concentration. A location quotient greater than one indicates the occupation has a higher share of employment than average, and a location quotient less than one indicates the occupation is less prevalent in the area than average.
Other OEWS estimates and related information:
May 2023 National Occupational Employment and Wage Estimates
May 2023 State Occupational Employment and Wage Estimates
May 2023 Metropolitan and Nonmetropolitan Area Occupational Employment and Wage Estimates
May 2023 National Industry-Specific Occupational Employment and Wage Estimates
Last Modified Date: April 3, 2024