
An official website of the United States government
An official website of the United States government
The .gov means it's official.
Federal government websites often end in .gov or .mil. Before sharing sensitive information,
make sure you're on a federal government site.
The site is secure.
The
https:// ensures that you are connecting to the official website and that any
information you provide is encrypted and transmitted securely.
Operate telephone business systems equipment or switchboards to relay incoming, outgoing, and interoffice calls. May supply information to callers and record messages.
Employment estimate and mean wage estimates for Switchboard Operators, Including Answering Service:
| Employment (1) | Employment RSE (3) |
Mean hourly wage |
Mean annual wage (2) |
Wage RSE (3) |
|---|---|---|---|---|
| 43,830 | 2.5 % | $ 19.24 | $ 40,020 | 0.6 % |
Percentile wage estimates for Switchboard Operators, Including Answering Service:
| Percentile | 10% | 25% | 50% (Median) |
75% | 90% |
|---|---|---|---|---|---|
| Hourly Wage | $ 13.48 | $ 15.19 | $ 17.67 | $ 21.08 | $ 28.28 |
| Annual Wage (2) | $ 28,030 | $ 31,600 | $ 36,750 | $ 43,840 | $ 58,810 |
Industries with the highest published employment and wages for Switchboard Operators, Including Answering Service are provided. For a list of all industries with employment in Switchboard Operators, Including Answering Service, see the Create Customized Tables function.
Industries with the highest levels of employment in Switchboard Operators, Including Answering Service:
| Industry | Employment (1) | Percent of industry employment | Hourly mean wage | Annual mean wage (2) |
|---|---|---|---|---|
| General Medical and Surgical Hospitals | 11,900 | 0.21 | $ 19.53 | $ 40,630 |
| Business Support Services | 10,040 | 1.34 | $ 16.86 | $ 35,070 |
| Offices of Physicians | 4,210 | 0.15 | $ 17.97 | $ 37,380 |
| Traveler Accommodation | 2,490 | 0.13 | $ 21.15 | $ 44,000 |
| Management, Scientific, and Technical Consulting Services | 1,790 | 0.10 | $ 17.20 | $ 35,780 |
Industries with the highest concentration of employment in Switchboard Operators, Including Answering Service:
| Industry | Employment (1) | Percent of industry employment | Hourly mean wage | Annual mean wage (2) |
|---|---|---|---|---|
| Business Support Services | 10,040 | 1.34 | $ 16.86 | $ 35,070 |
| General Medical and Surgical Hospitals | 11,900 | 0.21 | $ 19.53 | $ 40,630 |
| Outpatient Care Centers | 1,690 | 0.16 | $ 29.53 | $ 61,420 |
| Offices of Physicians | 4,210 | 0.15 | $ 17.97 | $ 37,380 |
| Traveler Accommodation | 2,490 | 0.13 | $ 21.15 | $ 44,000 |
Top paying industries for Switchboard Operators, Including Answering Service:
| Industry | Employment (1) | Percent of industry employment | Hourly mean wage | Annual mean wage (2) |
|---|---|---|---|---|
| Outpatient Care Centers | 1,690 | 0.16 | $ 29.53 | $ 61,420 |
| Legal Services | 200 | 0.02 | $ 26.54 | $ 55,190 |
| Business, Professional, Labor, Political, and Similar Organizations | 30 | 0.01 | $ 26.02 | $ 54,130 |
| Civic and Social Organizations | 50 | 0.02 | $ 25.42 | $ 52,880 |
| Architectural, Engineering, and Related Services | 40 | (7) | $ 24.77 | $ 51,510 |
States and areas with the highest published employment, location quotients, and wages for Switchboard Operators, Including Answering Service are provided. For a list of all areas with employment in Switchboard Operators, Including Answering Service, see the Create Customized Tables function.
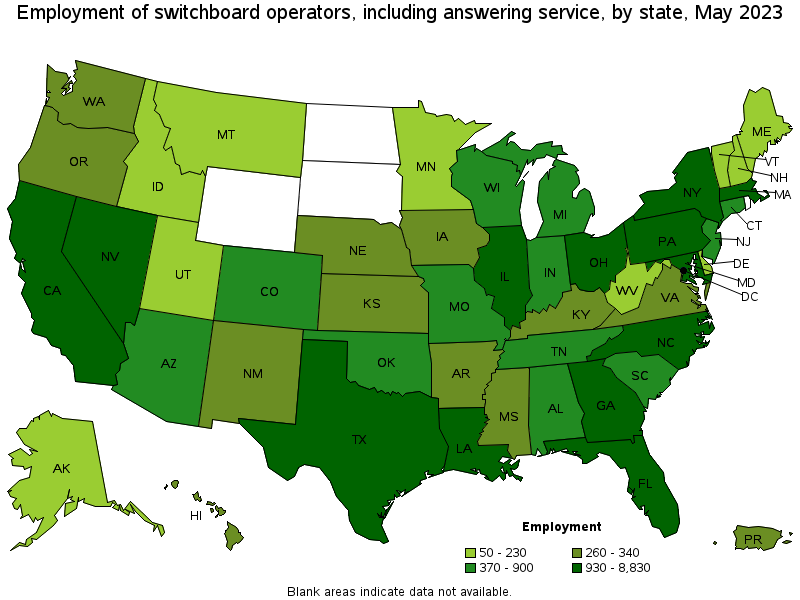
States with the highest employment level in Switchboard Operators, Including Answering Service:
| State | Employment (1) | Employment per thousand jobs | Location quotient (9) | Hourly mean wage | Annual mean wage (2) |
|---|---|---|---|---|---|
| California | 8,830 | 0.49 | 1.70 | $ 25.31 | $ 52,640 |
| Texas | 3,710 | 0.27 | 0.95 | $ 14.93 | $ 31,050 |
| New York | 3,570 | 0.38 | 1.32 | $ 20.84 | $ 43,350 |
| Florida | 3,490 | 0.36 | 1.26 | $ 16.28 | $ 33,860 |
| Illinois | 2,290 | 0.38 | 1.32 | $ 20.59 | $ 42,820 |
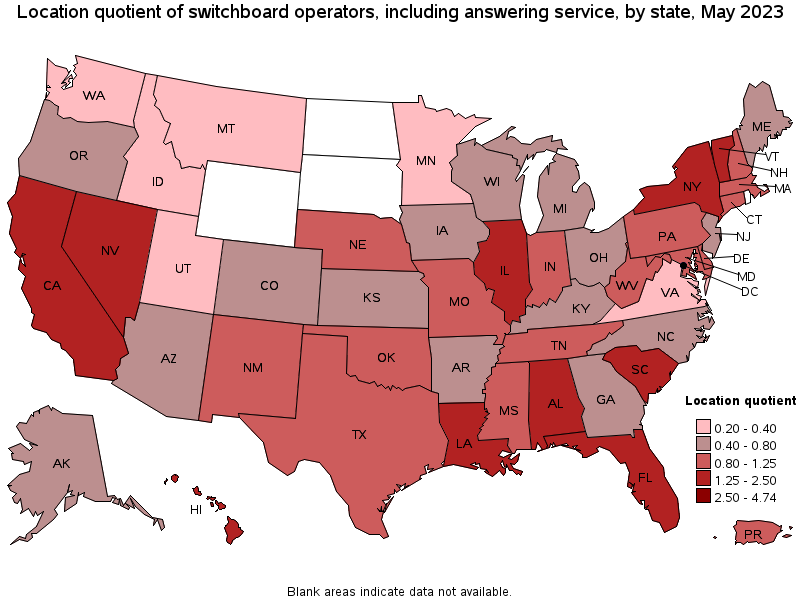
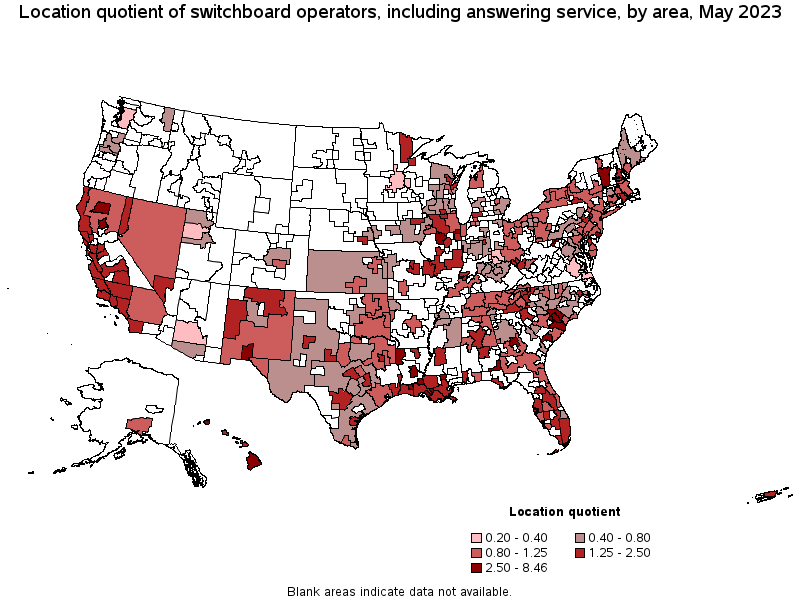
States with the highest concentration of jobs and location quotients in Switchboard Operators, Including Answering Service:
| State | Employment (1) | Employment per thousand jobs | Location quotient (9) | Hourly mean wage | Annual mean wage (2) |
|---|---|---|---|---|---|
| Louisiana | 1,170 | 0.63 | 2.19 | $ 16.84 | $ 35,030 |
| Nevada | 930 | 0.63 | 2.18 | $ 17.61 | $ 36,630 |
| Hawaii | 340 | 0.54 | 1.88 | $ 23.92 | $ 49,760 |
| California | 8,830 | 0.49 | 1.70 | $ 25.31 | $ 52,640 |
| Alabama | 820 | 0.40 | 1.39 | $ 14.70 | $ 30,580 |
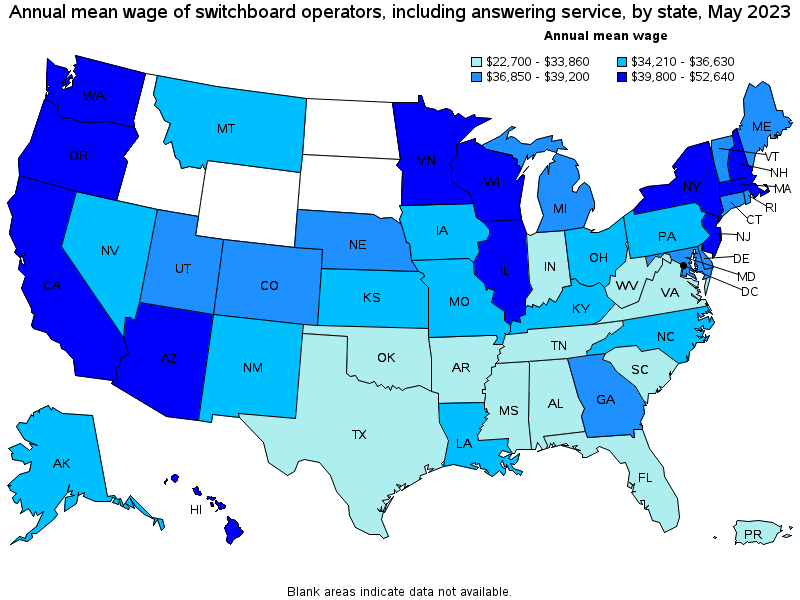
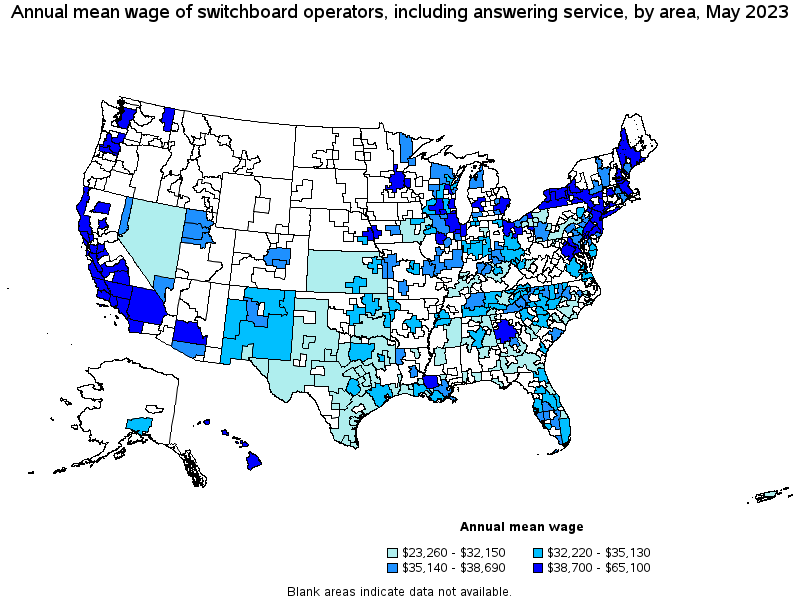
Top paying states for Switchboard Operators, Including Answering Service:
| State | Employment (1) | Employment per thousand jobs | Location quotient (9) | Hourly mean wage | Annual mean wage (2) |
|---|---|---|---|---|---|
| California | 8,830 | 0.49 | 1.70 | $ 25.31 | $ 52,640 |
| District of Columbia | 160 | 0.22 | 0.77 | $ 24.03 | $ 49,980 |
| Hawaii | 340 | 0.54 | 1.88 | $ 23.92 | $ 49,760 |
| Oregon | 300 | 0.16 | 0.54 | $ 21.60 | $ 44,920 |
| Washington | 340 | 0.10 | 0.34 | $ 20.98 | $ 43,640 |
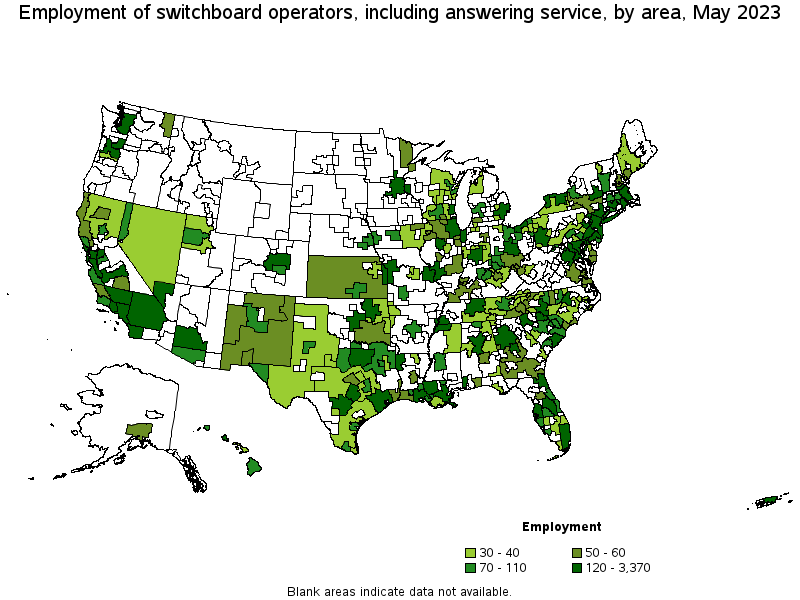
Metropolitan areas with the highest employment level in Switchboard Operators, Including Answering Service:
| Metropolitan area | Employment (1) | Employment per thousand jobs | Location quotient (9) | Hourly mean wage | Annual mean wage (2) |
|---|---|---|---|---|---|
| New York-Newark-Jersey City, NY-NJ-PA | 3,370 | 0.35 | 1.23 | $ 21.14 | $ 43,960 |
| Los Angeles-Long Beach-Anaheim, CA | 2,650 | 0.43 | 1.48 | $ 22.95 | $ 47,740 |
| Chicago-Naperville-Elgin, IL-IN-WI | 1,560 | 0.35 | 1.20 | $ 21.29 | $ 44,290 |
| Miami-Fort Lauderdale-West Palm Beach, FL | 1,140 | 0.42 | 1.45 | $ 16.46 | $ 34,230 |
| San Francisco-Oakland-Hayward, CA | 1,020 | 0.42 | 1.45 | $ 27.60 | $ 57,400 |
| Houston-The Woodlands-Sugar Land, TX | 850 | 0.27 | 0.93 | $ 15.49 | $ 32,220 |
| Philadelphia-Camden-Wilmington, PA-NJ-DE-MD | 850 | 0.30 | 1.04 | $ 19.08 | $ 39,690 |
| Dallas-Fort Worth-Arlington, TX | 830 | 0.21 | 0.72 | $ 15.54 | $ 32,330 |
| Las Vegas-Henderson-Paradise, NV | 760 | 0.70 | 2.43 | $ 17.75 | $ 36,910 |
| Boston-Cambridge-Nashua, MA-NH | 670 | 0.24 | 0.84 | $ 20.85 | $ 43,360 |
Metropolitan areas with the highest concentration of jobs and location quotients in Switchboard Operators, Including Answering Service:
| Metropolitan area | Employment (1) | Employment per thousand jobs | Location quotient (9) | Hourly mean wage | Annual mean wage (2) |
|---|---|---|---|---|---|
| Cumberland, MD-WV | 90 | 2.44 | 8.46 | $ 13.82 | $ 28,740 |
| Macon, GA | 120 | 1.27 | 4.40 | $ 17.70 | $ 36,810 |
| Kankakee, IL | 50 | 1.14 | 3.96 | $ 18.97 | $ 39,460 |
| Peoria, IL | 170 | 1.01 | 3.51 | $ 19.21 | $ 39,970 |
| Shreveport-Bossier City, LA | 170 | 0.98 | 3.41 | $ 16.95 | $ 35,250 |
| Alexandria, LA | 60 | 0.97 | 3.37 | $ 16.95 | $ 35,260 |
| Chico, CA | 70 | 0.96 | 3.31 | $ 18.60 | $ 38,700 |
| Florence, SC | 70 | 0.84 | 2.92 | $ 13.93 | $ 28,970 |
| Atlantic City-Hammonton, NJ | 100 | 0.83 | 2.86 | $ 18.17 | $ 37,790 |
| Redding, CA | 50 | 0.78 | 2.71 | $ 20.96 | $ 43,590 |
Top paying metropolitan areas for Switchboard Operators, Including Answering Service:
| Metropolitan area | Employment (1) | Employment per thousand jobs | Location quotient (9) | Hourly mean wage | Annual mean wage (2) |
|---|---|---|---|---|---|
| San Jose-Sunnyvale-Santa Clara, CA | 550 | 0.48 | 1.66 | $ 31.30 | $ 65,100 |
| San Francisco-Oakland-Hayward, CA | 1,020 | 0.42 | 1.45 | $ 27.60 | $ 57,400 |
| Stockton-Lodi, CA | 180 | 0.66 | 2.28 | $ 25.13 | $ 52,270 |
| Modesto, CA | 70 | 0.37 | 1.30 | $ 25.05 | $ 52,110 |
| Kahului-Wailuku-Lahaina, HI | 40 | 0.55 | 1.92 | $ 24.74 | $ 51,460 |
| Urban Honolulu, HI | 210 | 0.48 | 1.67 | $ 24.10 | $ 50,140 |
| Napa, CA | 50 | 0.65 | 2.24 | $ 24.06 | $ 50,040 |
| Salem, OR | 40 | 0.20 | 0.70 | $ 23.60 | $ 49,080 |
| Santa Rosa, CA | 90 | 0.44 | 1.52 | $ 23.42 | $ 48,700 |
| Janesville-Beloit, WI | 50 | 0.71 | 2.46 | $ 23.13 | $ 48,100 |
Nonmetropolitan areas with the highest employment in Switchboard Operators, Including Answering Service:
| Nonmetropolitan area | Employment (1) | Employment per thousand jobs | Location quotient (9) | Hourly mean wage | Annual mean wage (2) |
|---|---|---|---|---|---|
| Southwest Louisiana nonmetropolitan area | 110 | 1.64 | 5.67 | $ 15.46 | $ 32,150 |
| North Texas Region of Texas nonmetropolitan area | 90 | 0.32 | 1.11 | $ 14.13 | $ 29,400 |
| Northeast South Carolina nonmetropolitan area | 90 | 0.95 | 3.30 | (8) | (8) |
| Hawaii / Kauai nonmetropolitan area | 80 | 0.80 | 2.76 | $ 23.11 | $ 48,080 |
| North Northeastern Ohio nonmetropolitan area (noncontiguous) | 80 | 0.25 | 0.86 | $ 18.91 | $ 39,330 |
Nonmetropolitan areas with the highest concentration of jobs and location quotients in Switchboard Operators, Including Answering Service:
| Nonmetropolitan area | Employment (1) | Employment per thousand jobs | Location quotient (9) | Hourly mean wage | Annual mean wage (2) |
|---|---|---|---|---|---|
| Southwest Louisiana nonmetropolitan area | 110 | 1.64 | 5.67 | $ 15.46 | $ 32,150 |
| Northeast South Carolina nonmetropolitan area | 90 | 0.95 | 3.30 | (8) | (8) |
| Hawaii / Kauai nonmetropolitan area | 80 | 0.80 | 2.76 | $ 23.11 | $ 48,080 |
| Southern Vermont nonmetropolitan area | 80 | 0.76 | 2.64 | $ 17.89 | $ 37,220 |
| Northern New Mexico nonmetropolitan area | 60 | 0.69 | 2.38 | $ 16.78 | $ 34,900 |
Top paying nonmetropolitan areas for Switchboard Operators, Including Answering Service:
| Nonmetropolitan area | Employment (1) | Employment per thousand jobs | Location quotient (9) | Hourly mean wage | Annual mean wage (2) |
|---|---|---|---|---|---|
| Hawaii / Kauai nonmetropolitan area | 80 | 0.80 | 2.76 | $ 23.11 | $ 48,080 |
| North Coast Region of California nonmetropolitan area | 50 | 0.43 | 1.50 | $ 20.63 | $ 42,910 |
| Southwest New York nonmetropolitan area | 40 | 0.23 | 0.80 | $ 19.18 | $ 39,890 |
| North Northeastern Ohio nonmetropolitan area (noncontiguous) | 80 | 0.25 | 0.86 | $ 18.91 | $ 39,330 |
| Southwest Maine nonmetropolitan area | 30 | 0.18 | 0.61 | $ 18.76 | $ 39,010 |
These estimates are calculated with data collected from employers in all industry sectors, all metropolitan and nonmetropolitan areas, and all states and the District of Columbia. The top employment and wage figures are provided above. The complete list is available in the downloadable XLS files.
The percentile wage estimate is the value of a wage below which a certain percent of workers fall. The median wage is the 50th percentile wage estimate—50 percent of workers earn less than the median and 50 percent of workers earn more than the median. More about percentile wages.
(1) Estimates for detailed occupations do not sum to the totals because the totals include occupations not shown separately. Estimates do not include self-employed workers.
(2) Annual wages have been calculated by multiplying the hourly mean wage by a "year-round, full-time" hours figure of 2,080 hours; for those occupations where there is not an hourly wage published, the annual wage has been directly calculated from the reported survey data.
(3) The relative standard error (RSE) is a measure of the reliability of a survey statistic. The smaller the relative standard error, the more precise the estimate.
(7) The value is less than .005 percent of industry employment.
(8) Estimate not released.
(9) The location quotient is the ratio of the area concentration of occupational employment to the national average concentration. A location quotient greater than one indicates the occupation has a higher share of employment than average, and a location quotient less than one indicates the occupation is less prevalent in the area than average.
Other OEWS estimates and related information:
May 2023 National Occupational Employment and Wage Estimates
May 2023 State Occupational Employment and Wage Estimates
May 2023 Metropolitan and Nonmetropolitan Area Occupational Employment and Wage Estimates
May 2023 National Industry-Specific Occupational Employment and Wage Estimates
Last Modified Date: April 3, 2024