
An official website of the United States government
An official website of the United States government
The .gov means it's official.
Federal government websites often end in .gov or .mil. Before sharing sensitive information,
make sure you're on a federal government site.
The site is secure.
The
https:// ensures that you are connecting to the official website and that any
information you provide is encrypted and transmitted securely.
Assess, treat, and care for patients by manipulation of spine and musculoskeletal system. May provide spinal adjustment or address sacral or pelvic misalignment.
Employment estimate and mean wage estimates for Chiropractors:
| Employment (1) | Employment RSE (3) |
Mean hourly wage |
Mean annual wage (2) |
Wage RSE (3) |
|---|---|---|---|---|
| 41,480 | 6.9 % | $ 43.15 | $ 89,760 | 3.0 % |
Percentile wage estimates for Chiropractors:
| Percentile | 10% | 25% | 50% (Median) |
75% | 90% |
|---|---|---|---|---|---|
| Hourly Wage | $ 19.21 | $ 27.88 | $ 36.79 | $ 49.00 | $ 68.55 |
| Annual Wage (2) | $ 39,960 | $ 57,980 | $ 76,530 | $ 101,930 | $ 142,580 |
Industries with the highest published employment and wages for Chiropractors are provided. For a list of all industries with employment in Chiropractors, see the Create Customized Tables function.
Industries with the highest levels of employment in Chiropractors:
| Industry | Employment (1) | Percent of industry employment | Hourly mean wage | Annual mean wage (2) |
|---|---|---|---|---|
| Offices of Other Health Practitioners | 36,960 | 3.24 | $ 42.85 | $ 89,130 |
| Outpatient Care Centers | 470 | 0.04 | $ 48.87 | $ 101,660 |
| General Medical and Surgical Hospitals | 100 | 0.00 | $ 60.52 | $ 125,870 |
| Specialty (except Psychiatric and Substance Abuse) Hospitals | 80 | 0.03 | $ 36.77 | $ 76,480 |
Industries with the highest concentration of employment in Chiropractors:
| Industry | Employment (1) | Percent of industry employment | Hourly mean wage | Annual mean wage (2) |
|---|---|---|---|---|
| Offices of Other Health Practitioners | 36,960 | 3.24 | $ 42.85 | $ 89,130 |
| Outpatient Care Centers | 470 | 0.04 | $ 48.87 | $ 101,660 |
| Specialty (except Psychiatric and Substance Abuse) Hospitals | 80 | 0.03 | $ 36.77 | $ 76,480 |
| General Medical and Surgical Hospitals | 100 | 0.00 | $ 60.52 | $ 125,870 |
Top paying industries for Chiropractors:
| Industry | Employment (1) | Percent of industry employment | Hourly mean wage | Annual mean wage (2) |
|---|---|---|---|---|
| General Medical and Surgical Hospitals | 100 | (7) | $ 60.52 | $ 125,870 |
| Employment Services | (8) | (8) | $ 50.93 | $ 105,930 |
| Outpatient Care Centers | 470 | 0.04 | $ 48.87 | $ 101,660 |
| Offices of Other Health Practitioners | 36,960 | 3.24 | $ 42.85 | $ 89,130 |
| Offices of Physicians | (8) | (8) | $ 40.42 | $ 84,080 |
States and areas with the highest published employment, location quotients, and wages for Chiropractors are provided. For a list of all areas with employment in Chiropractors, see the Create Customized Tables function.
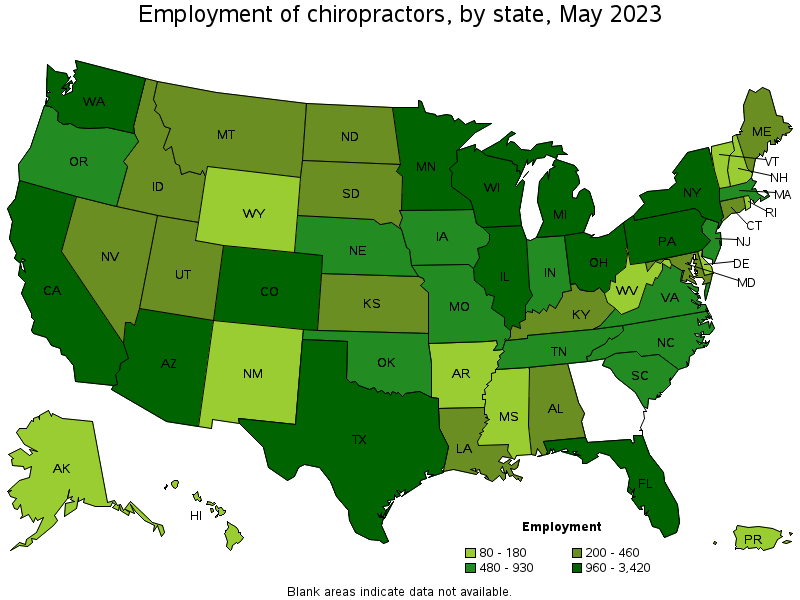
States with the highest employment level in Chiropractors:
| State | Employment (1) | Employment per thousand jobs | Location quotient (9) | Hourly mean wage | Annual mean wage (2) |
|---|---|---|---|---|---|
| Texas | 3,420 | 0.25 | 0.92 | $ 45.21 | $ 94,040 |
| California | 3,410 | 0.19 | 0.69 | (8) | (8) |
| Florida | 3,360 | 0.35 | 1.29 | $ 41.05 | $ 85,380 |
| New York | 3,330 | 0.35 | 1.30 | $ 44.97 | $ 93,540 |
| Illinois | 2,590 | 0.43 | 1.57 | $ 33.41 | $ 69,480 |
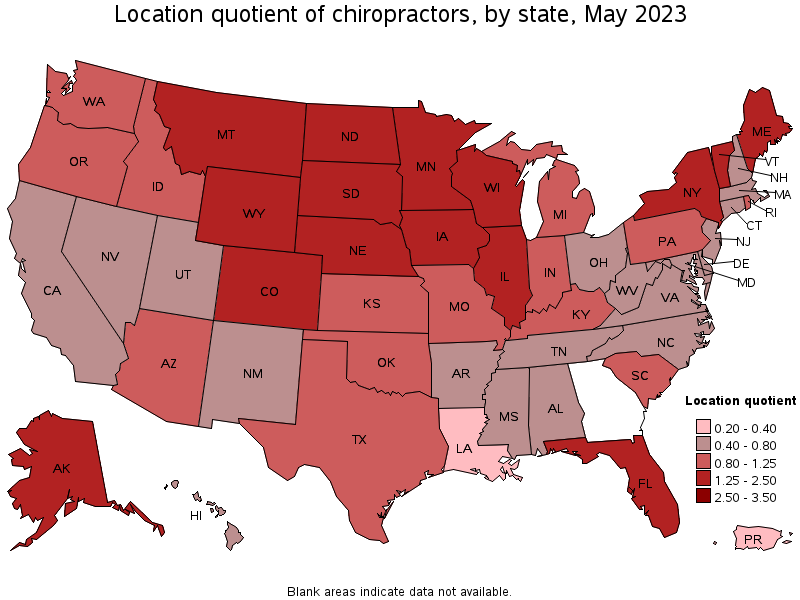
States with the highest concentration of jobs and location quotients in Chiropractors:
| State | Employment (1) | Employment per thousand jobs | Location quotient (9) | Hourly mean wage | Annual mean wage (2) |
|---|---|---|---|---|---|
| North Dakota | 260 | 0.61 | 2.25 | $ 38.56 | $ 80,200 |
| Nebraska | 600 | 0.60 | 2.21 | $ 34.74 | $ 72,260 |
| Iowa | 930 | 0.60 | 2.21 | $ 33.48 | $ 69,650 |
| Wyoming | 140 | 0.52 | 1.92 | $ 30.06 | $ 62,530 |
| South Dakota | 220 | 0.49 | 1.79 | $ 42.04 | $ 87,450 |
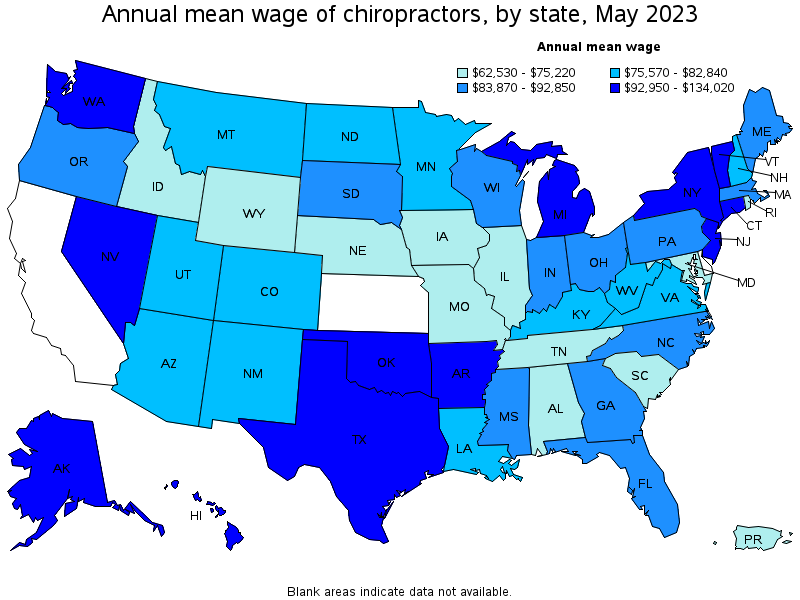
Top paying states for Chiropractors:
| State | Employment (1) | Employment per thousand jobs | Location quotient (9) | Hourly mean wage | Annual mean wage (2) |
|---|---|---|---|---|---|
| Alaska | 110 | 0.35 | 1.27 | $ 64.43 | $ 134,020 |
| Arkansas | 180 | 0.14 | 0.53 | $ 52.94 | $ 110,110 |
| Nevada | 210 | 0.14 | 0.52 | $ 51.89 | $ 107,920 |
| Oklahoma | 480 | 0.29 | 1.07 | $ 49.68 | $ 103,330 |
| New Jersey | 720 | 0.17 | 0.63 | $ 49.28 | $ 102,500 |
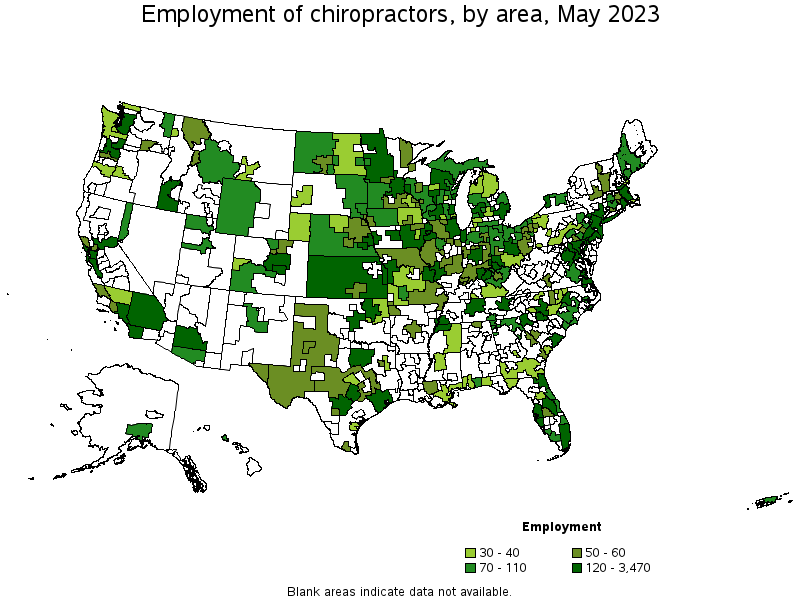
Metropolitan areas with the highest employment level in Chiropractors:
| Metropolitan area | Employment (1) | Employment per thousand jobs | Location quotient (9) | Hourly mean wage | Annual mean wage (2) |
|---|---|---|---|---|---|
| New York-Newark-Jersey City, NY-NJ-PA | 3,470 | 0.37 | 1.34 | $ 46.80 | $ 97,340 |
| Chicago-Naperville-Elgin, IL-IN-WI | 2,040 | 0.45 | 1.66 | $ 29.31 | $ 60,960 |
| Dallas-Fort Worth-Arlington, TX | 1,310 | 0.33 | 1.21 | $ 47.54 | $ 98,890 |
| Los Angeles-Long Beach-Anaheim, CA | 1,310 | 0.21 | 0.77 | (8) | (8) |
| Miami-Fort Lauderdale-West Palm Beach, FL | 1,120 | 0.41 | 1.51 | $ 35.80 | $ 74,460 |
| Philadelphia-Camden-Wilmington, PA-NJ-DE-MD | 1,080 | 0.38 | 1.39 | $ 43.09 | $ 89,630 |
| Phoenix-Mesa-Scottsdale, AZ | 820 | 0.36 | 1.31 | $ 37.56 | $ 78,130 |
| Minneapolis-St. Paul-Bloomington, MN-WI | 750 | 0.40 | 1.45 | $ 41.34 | $ 85,990 |
| Houston-The Woodlands-Sugar Land, TX | 650 | 0.21 | 0.75 | $ 50.27 | $ 104,560 |
| Seattle-Tacoma-Bellevue, WA | 560 | 0.27 | 0.99 | $ 48.32 | $ 100,500 |
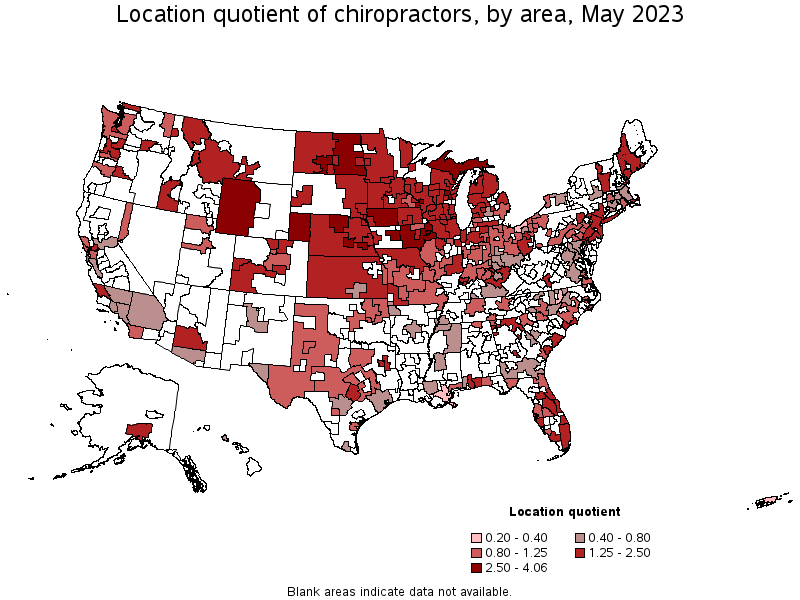
Metropolitan areas with the highest concentration of jobs and location quotients in Chiropractors:
| Metropolitan area | Employment (1) | Employment per thousand jobs | Location quotient (9) | Hourly mean wage | Annual mean wage (2) |
|---|---|---|---|---|---|
| Grand Island, NE | 50 | 1.11 | 4.06 | $ 38.57 | $ 80,230 |
| Bismarck, ND | 50 | 0.75 | 2.75 | (8) | (8) |
| Davenport-Moline-Rock Island, IA-IL | 130 | 0.74 | 2.69 | $ 40.10 | $ 83,400 |
| La Crosse-Onalaska, WI-MN | 50 | 0.72 | 2.65 | $ 45.64 | $ 94,930 |
| Lincoln, NE | 130 | 0.72 | 2.63 | $ 32.86 | $ 68,340 |
| Des Moines-West Des Moines, IA | 270 | 0.71 | 2.59 | $ 35.90 | $ 74,660 |
| Appleton, WI | 90 | 0.70 | 2.56 | $ 44.72 | $ 93,020 |
| Eau Claire, WI | 60 | 0.66 | 2.43 | $ 41.18 | $ 85,660 |
| Green Bay, WI | 110 | 0.62 | 2.28 | $ 47.09 | $ 97,940 |
| Fort Collins, CO | 100 | 0.60 | 2.21 | (8) | (8) |
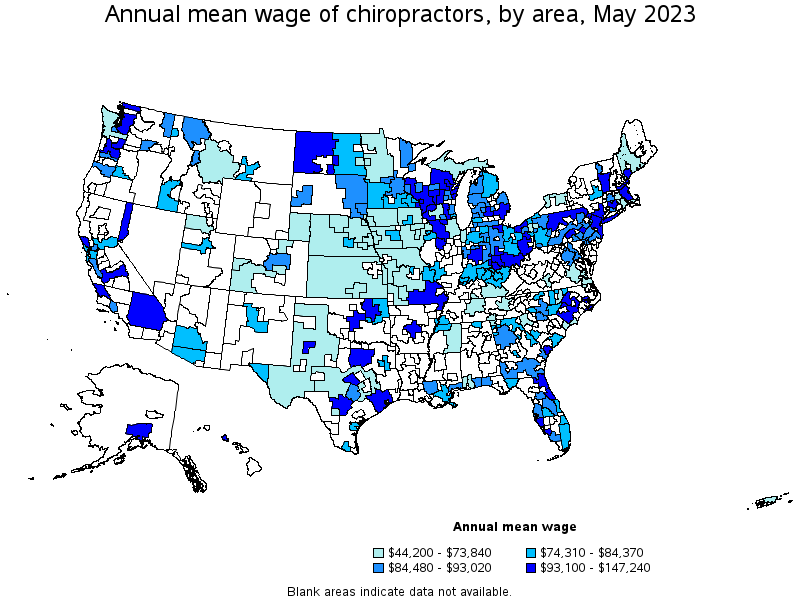
Top paying metropolitan areas for Chiropractors:
| Metropolitan area | Employment (1) | Employment per thousand jobs | Location quotient (9) | Hourly mean wage | Annual mean wage (2) |
|---|---|---|---|---|---|
| Anchorage, AK | 70 | 0.43 | 1.57 | $ 70.79 | $ 147,240 |
| Reno, NV | 70 | 0.29 | 1.07 | $ 64.62 | $ 134,410 |
| Riverside-San Bernardino-Ontario, CA | 200 | 0.12 | 0.43 | $ 59.07 | $ 122,870 |
| Killeen-Temple, TX | 40 | 0.26 | 0.94 | $ 58.78 | $ 122,260 |
| Rockford, IL | 60 | 0.42 | 1.54 | $ 57.97 | $ 120,570 |
| Cleveland-Elyria, OH | 100 | 0.10 | 0.35 | $ 54.55 | $ 113,460 |
| Oklahoma City, OK | 210 | 0.32 | 1.16 | $ 53.58 | $ 111,440 |
| Santa Rosa, CA | 60 | 0.27 | 1.00 | $ 52.35 | $ 108,880 |
| Tulsa, OK | 120 | 0.28 | 1.03 | $ 51.84 | $ 107,820 |
| Peoria, IL | 80 | 0.48 | 1.74 | $ 51.78 | $ 107,700 |
Nonmetropolitan areas with the highest employment in Chiropractors:
| Nonmetropolitan area | Employment (1) | Employment per thousand jobs | Location quotient (9) | Hourly mean wage | Annual mean wage (2) |
|---|---|---|---|---|---|
| Kansas nonmetropolitan area | 250 | 0.64 | 2.34 | $ 30.43 | $ 63,280 |
| Southeast Iowa nonmetropolitan area | 150 | 0.70 | 2.57 | $ 33.54 | $ 69,770 |
| Northwest Minnesota nonmetropolitan area | 130 | 0.67 | 2.45 | $ 34.84 | $ 72,480 |
| Northeastern Wisconsin nonmetropolitan area | 120 | 0.62 | 2.28 | $ 48.60 | $ 101,080 |
| Northwest Iowa nonmetropolitan area | 110 | 0.84 | 3.06 | $ 25.05 | $ 52,100 |
Nonmetropolitan areas with the highest concentration of jobs and location quotients in Chiropractors:
| Nonmetropolitan area | Employment (1) | Employment per thousand jobs | Location quotient (9) | Hourly mean wage | Annual mean wage (2) |
|---|---|---|---|---|---|
| Western Wyoming nonmetropolitan area | 80 | 0.84 | 3.08 | (8) | (8) |
| Northwest Iowa nonmetropolitan area | 110 | 0.84 | 3.06 | $ 25.05 | $ 52,100 |
| Northwest Nebraska nonmetropolitan area | 30 | 0.84 | 3.06 | $ 33.73 | $ 70,160 |
| Upper Peninsula of Michigan nonmetropolitan area | 90 | 0.83 | 3.05 | $ 31.22 | $ 64,930 |
| East North Dakota nonmetropolitan area | 40 | 0.72 | 2.62 | $ 35.82 | $ 74,500 |
Top paying nonmetropolitan areas for Chiropractors:
| Nonmetropolitan area | Employment (1) | Employment per thousand jobs | Location quotient (9) | Hourly mean wage | Annual mean wage (2) |
|---|---|---|---|---|---|
| West North Dakota nonmetropolitan area | 80 | 0.67 | 2.44 | $ 52.15 | $ 108,470 |
| Northwest Illinois nonmetropolitan area | 60 | 0.47 | 1.72 | $ 50.10 | $ 104,200 |
| Southern Vermont nonmetropolitan area | 50 | 0.49 | 1.79 | $ 49.37 | $ 102,680 |
| Southeast Missouri nonmetropolitan area | 50 | 0.31 | 1.15 | $ 49.24 | $ 102,410 |
| Eastern Ohio nonmetropolitan area | 60 | 0.42 | 1.52 | $ 48.65 | $ 101,190 |
These estimates are calculated with data collected from employers in all industry sectors, all metropolitan and nonmetropolitan areas, and all states and the District of Columbia. The top employment and wage figures are provided above. The complete list is available in the downloadable XLS files.
The percentile wage estimate is the value of a wage below which a certain percent of workers fall. The median wage is the 50th percentile wage estimate—50 percent of workers earn less than the median and 50 percent of workers earn more than the median. More about percentile wages.
(1) Estimates for detailed occupations do not sum to the totals because the totals include occupations not shown separately. Estimates do not include self-employed workers.
(2) Annual wages have been calculated by multiplying the hourly mean wage by a "year-round, full-time" hours figure of 2,080 hours; for those occupations where there is not an hourly wage published, the annual wage has been directly calculated from the reported survey data.
(3) The relative standard error (RSE) is a measure of the reliability of a survey statistic. The smaller the relative standard error, the more precise the estimate.
(7) The value is less than .005 percent of industry employment.
(8) Estimate not released.
(9) The location quotient is the ratio of the area concentration of occupational employment to the national average concentration. A location quotient greater than one indicates the occupation has a higher share of employment than average, and a location quotient less than one indicates the occupation is less prevalent in the area than average.
Other OEWS estimates and related information:
May 2023 National Occupational Employment and Wage Estimates
May 2023 State Occupational Employment and Wage Estimates
May 2023 Metropolitan and Nonmetropolitan Area Occupational Employment and Wage Estimates
May 2023 National Industry-Specific Occupational Employment and Wage Estimates
Last Modified Date: April 3, 2024