
An official website of the United States government
An official website of the United States government
The .gov means it's official.
Federal government websites often end in .gov or .mil. Before sharing sensitive information,
make sure you're on a federal government site.
The site is secure.
The
https:// ensures that you are connecting to the official website and that any
information you provide is encrypted and transmitted securely.
Design, cut, and arrange live, dried, or artificial flowers and foliage.
Employment estimate and mean wage estimates for Floral Designers:
| Employment (1) | Employment RSE (3) |
Mean hourly wage |
Mean annual wage (2) |
Wage RSE (3) |
|---|---|---|---|---|
| 43,350 | 1.8 % | $ 17.07 | $ 35,500 | 0.7 % |
Percentile wage estimates for Floral Designers:
| Percentile | 10% | 25% | 50% (Median) |
75% | 90% |
|---|---|---|---|---|---|
| Hourly Wage | $ 12.00 | $ 14.00 | $ 16.68 | $ 18.72 | $ 22.43 |
| Annual Wage (2) | $ 24,960 | $ 29,120 | $ 34,690 | $ 38,940 | $ 46,650 |
Industries with the highest published employment and wages for Floral Designers are provided. For a list of all industries with employment in Floral Designers, see the Create Customized Tables function.
Industries with the highest levels of employment in Floral Designers:
| Industry | Employment (1) | Percent of industry employment | Hourly mean wage | Annual mean wage (2) |
|---|---|---|---|---|
| Florists | 29,080 | 45.15 | $ 16.93 | $ 35,220 |
| Food and Beverage Retailers (4451 and 4452 only) | 7,350 | 0.24 | $ 17.48 | $ 36,360 |
| Merchant Wholesalers, Nondurable Goods (4241, 4247, and 4249 only) | 1,440 | 0.27 | $ 16.35 | $ 34,000 |
| Lawn and Garden Equipment and Supplies Retailers | 730 | 0.38 | $ 17.20 | $ 35,780 |
| Miscellaneous Store Retailers (4594 and 4595 only) | 430 | 0.11 | $ 15.89 | $ 33,040 |
Industries with the highest concentration of employment in Floral Designers:
| Industry | Employment (1) | Percent of industry employment | Hourly mean wage | Annual mean wage (2) |
|---|---|---|---|---|
| Florists | 29,080 | 45.15 | $ 16.93 | $ 35,220 |
| Lawn and Garden Equipment and Supplies Retailers | 730 | 0.38 | $ 17.20 | $ 35,780 |
| Merchant Wholesalers, Nondurable Goods (4241, 4247, and 4249 only) | 1,440 | 0.27 | $ 16.35 | $ 34,000 |
| Food and Beverage Retailers (4451 and 4452 only) | 7,350 | 0.24 | $ 17.48 | $ 36,360 |
| Death Care Services | 210 | 0.15 | $ 18.44 | $ 38,350 |
Top paying industries for Floral Designers:
| Industry | Employment (1) | Percent of industry employment | Hourly mean wage | Annual mean wage (2) |
|---|---|---|---|---|
| Traveler Accommodation | 140 | 0.01 | $ 23.44 | $ 48,760 |
| Other Personal Services | 420 | 0.11 | $ 22.24 | $ 46,260 |
| Management of Companies and Enterprises | 190 | 0.01 | $ 21.74 | $ 45,210 |
| Other Support Services | 170 | 0.05 | $ 21.24 | $ 44,170 |
| Special Food Services | 50 | 0.01 | $ 21.16 | $ 44,010 |
States and areas with the highest published employment, location quotients, and wages for Floral Designers are provided. For a list of all areas with employment in Floral Designers, see the Create Customized Tables function.
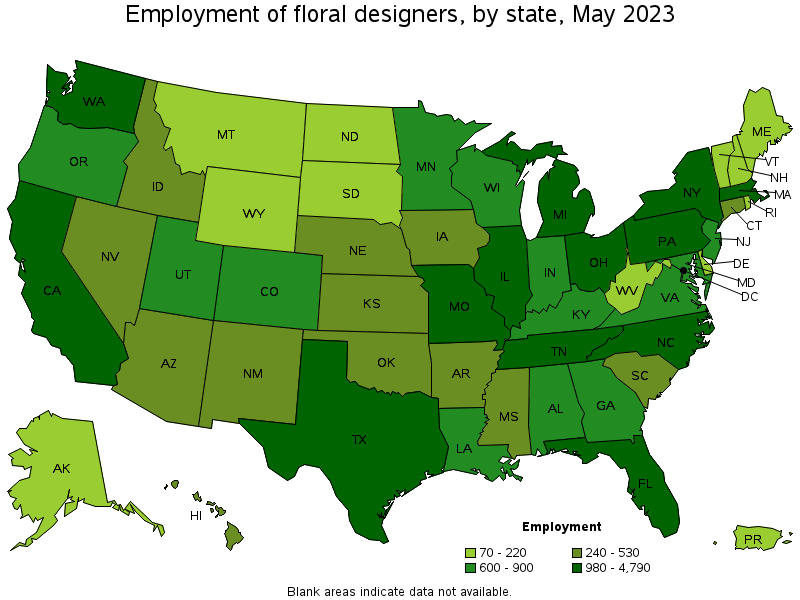
States with the highest employment level in Floral Designers:
| State | Employment (1) | Employment per thousand jobs | Location quotient (9) | Hourly mean wage | Annual mean wage (2) |
|---|---|---|---|---|---|
| California | 4,790 | 0.27 | 0.93 | $ 20.57 | $ 42,790 |
| Texas | 3,230 | 0.24 | 0.84 | $ 15.71 | $ 32,670 |
| Florida | 2,770 | 0.29 | 1.02 | $ 17.11 | $ 35,600 |
| New York | 2,320 | 0.25 | 0.87 | $ 19.83 | $ 41,240 |
| Pennsylvania | 2,050 | 0.35 | 1.21 | $ 15.38 | $ 32,000 |
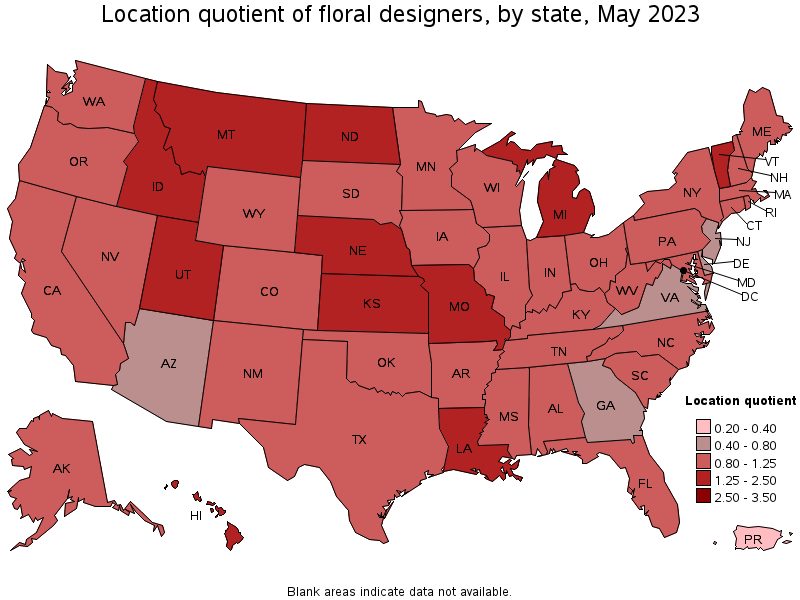
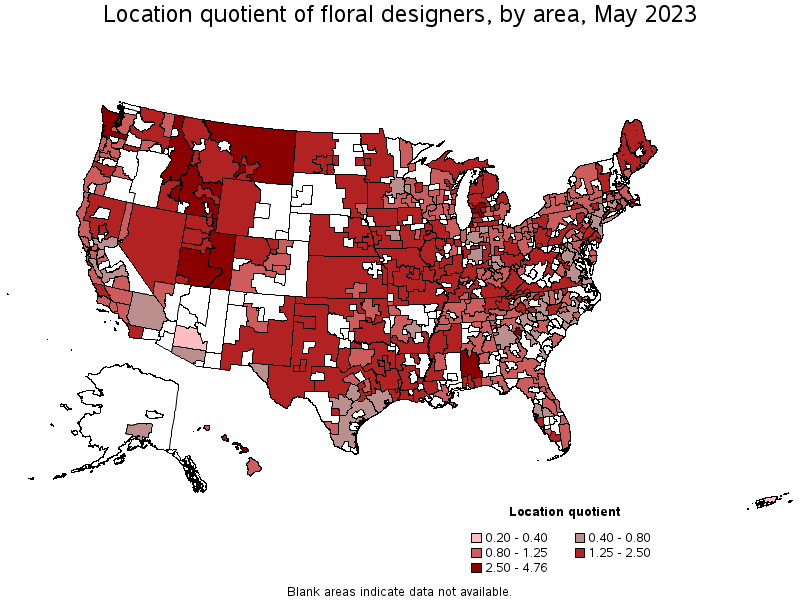
States with the highest concentration of jobs and location quotients in Floral Designers:
| State | Employment (1) | Employment per thousand jobs | Location quotient (9) | Hourly mean wage | Annual mean wage (2) |
|---|---|---|---|---|---|
| Missouri | 1,520 | 0.53 | 1.85 | $ 15.15 | $ 31,520 |
| Utah | 880 | 0.53 | 1.84 | $ 15.08 | $ 31,360 |
| Idaho | 410 | 0.50 | 1.75 | $ 15.42 | $ 32,080 |
| Hawaii | 300 | 0.49 | 1.73 | $ 19.35 | $ 40,260 |
| Vermont | 140 | 0.47 | 1.64 | $ 17.95 | $ 37,330 |
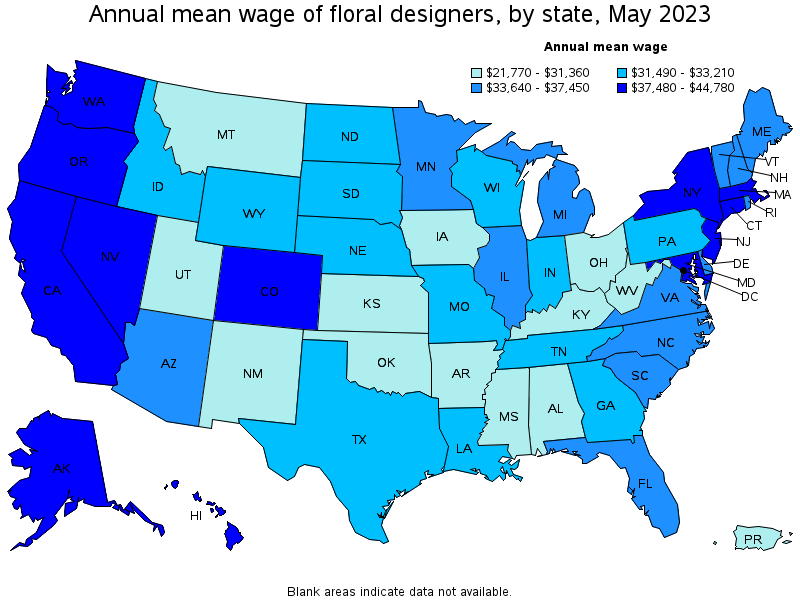
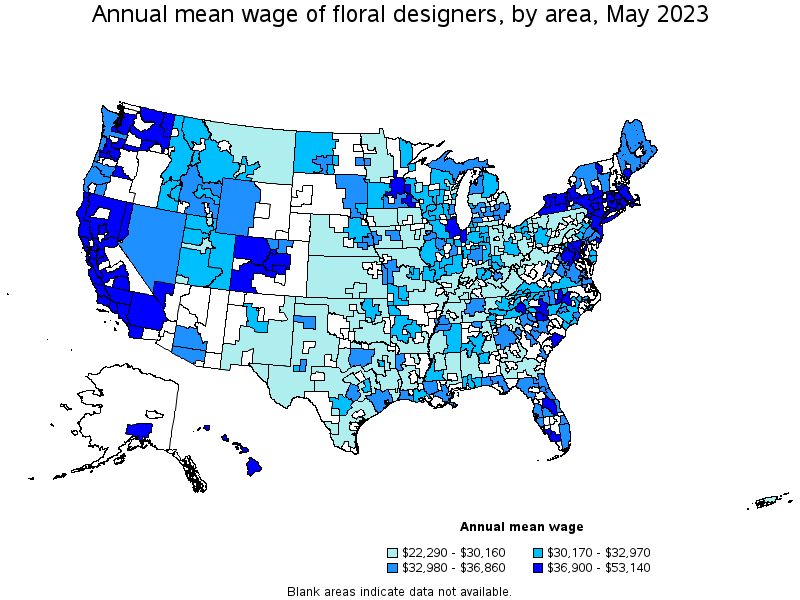
Top paying states for Floral Designers:
| State | Employment (1) | Employment per thousand jobs | Location quotient (9) | Hourly mean wage | Annual mean wage (2) |
|---|---|---|---|---|---|
| Alaska | 70 | 0.23 | 0.80 | $ 21.53 | $ 44,780 |
| District of Columbia | 110 | 0.16 | 0.57 | $ 20.64 | $ 42,920 |
| California | 4,790 | 0.27 | 0.93 | $ 20.57 | $ 42,790 |
| Massachusetts | 1,080 | 0.30 | 1.04 | $ 20.42 | $ 42,470 |
| Connecticut | 480 | 0.29 | 1.01 | $ 20.22 | $ 42,050 |
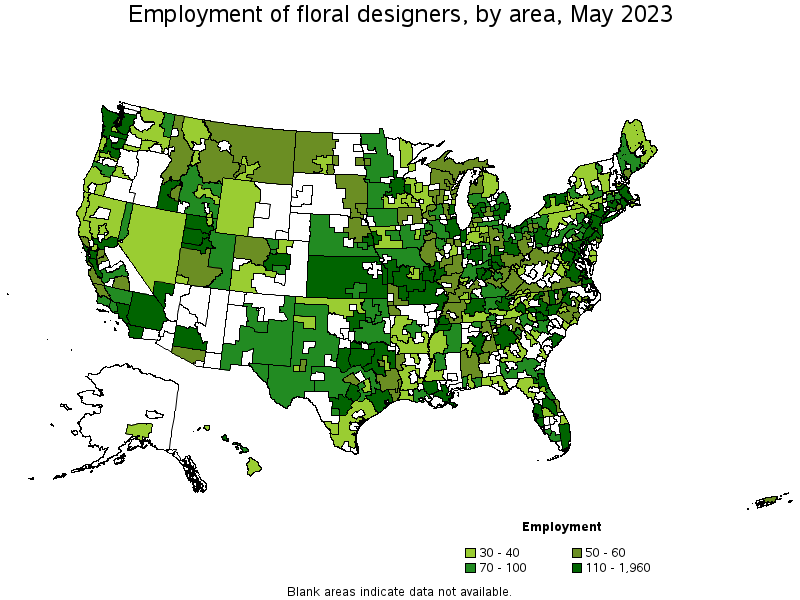
Metropolitan areas with the highest employment level in Floral Designers:
| Metropolitan area | Employment (1) | Employment per thousand jobs | Location quotient (9) | Hourly mean wage | Annual mean wage (2) |
|---|---|---|---|---|---|
| New York-Newark-Jersey City, NY-NJ-PA | 1,960 | 0.21 | 0.72 | $ 20.56 | $ 42,770 |
| Los Angeles-Long Beach-Anaheim, CA | 1,570 | 0.25 | 0.89 | $ 20.38 | $ 42,400 |
| Chicago-Naperville-Elgin, IL-IN-WI | 1,490 | 0.33 | 1.16 | $ 17.90 | $ 37,230 |
| Philadelphia-Camden-Wilmington, PA-NJ-DE-MD | 1,010 | 0.36 | 1.25 | $ 16.69 | $ 34,710 |
| Miami-Fort Lauderdale-West Palm Beach, FL | 940 | 0.35 | 1.21 | $ 16.22 | $ 33,730 |
| Dallas-Fort Worth-Arlington, TX | 910 | 0.23 | 0.80 | $ 16.69 | $ 34,710 |
| Boston-Cambridge-Nashua, MA-NH | 830 | 0.30 | 1.05 | $ 20.64 | $ 42,930 |
| San Francisco-Oakland-Hayward, CA | 720 | 0.30 | 1.04 | $ 22.17 | $ 46,110 |
| St. Louis, MO-IL | 620 | 0.47 | 1.64 | $ 15.75 | $ 32,770 |
| San Diego-Carlsbad, CA | 620 | 0.41 | 1.42 | $ 19.90 | $ 41,390 |
Metropolitan areas with the highest concentration of jobs and location quotients in Floral Designers:
| Metropolitan area | Employment (1) | Employment per thousand jobs | Location quotient (9) | Hourly mean wage | Annual mean wage (2) |
|---|---|---|---|---|---|
| Kahului-Wailuku-Lahaina, HI | 70 | 0.91 | 3.20 | $ 21.74 | $ 45,230 |
| Grand Rapids-Wyoming, MI | 480 | 0.90 | 3.16 | $ 16.33 | $ 33,960 |
| Niles-Benton Harbor, MI | 50 | 0.85 | 2.97 | $ 15.67 | $ 32,600 |
| Athens-Clarke County, GA | 70 | 0.81 | 2.82 | $ 15.98 | $ 33,250 |
| Bremerton-Silverdale, WA | 60 | 0.69 | 2.43 | $ 17.88 | $ 37,200 |
| Ogden-Clearfield, UT | 190 | 0.65 | 2.27 | $ 15.53 | $ 32,290 |
| Logan, UT-ID | 40 | 0.65 | 2.26 | $ 13.02 | $ 27,080 |
| Muskegon, MI | 40 | 0.59 | 2.05 | $ 15.50 | $ 32,230 |
| Santa Cruz-Watsonville, CA | 60 | 0.58 | 2.04 | $ 20.17 | $ 41,950 |
| Burlington-South Burlington, VT | 70 | 0.58 | 2.03 | $ 17.88 | $ 37,190 |
Top paying metropolitan areas for Floral Designers:
| Metropolitan area | Employment (1) | Employment per thousand jobs | Location quotient (9) | Hourly mean wage | Annual mean wage (2) |
|---|---|---|---|---|---|
| Salinas, CA | 50 | 0.29 | 1.01 | $ 25.55 | $ 53,140 |
| San Jose-Sunnyvale-Santa Clara, CA | 250 | 0.22 | 0.77 | $ 22.62 | $ 47,050 |
| Santa Rosa, CA | 60 | 0.31 | 1.08 | $ 22.44 | $ 46,660 |
| San Francisco-Oakland-Hayward, CA | 720 | 0.30 | 1.04 | $ 22.17 | $ 46,110 |
| Kahului-Wailuku-Lahaina, HI | 70 | 0.91 | 3.20 | $ 21.74 | $ 45,230 |
| Rochester, MN | 40 | 0.32 | 1.14 | $ 21.70 | $ 45,130 |
| Naples-Immokalee-Marco Island, FL | 80 | 0.50 | 1.74 | $ 21.42 | $ 44,550 |
| Anchorage, AK | 40 | 0.22 | 0.77 | $ 21.20 | $ 44,090 |
| Bridgeport-Stamford-Norwalk, CT | 160 | 0.39 | 1.37 | $ 21.17 | $ 44,030 |
| Santa Maria-Santa Barbara, CA | 70 | 0.35 | 1.21 | $ 20.88 | $ 43,430 |
Nonmetropolitan areas with the highest employment in Floral Designers:
| Nonmetropolitan area | Employment (1) | Employment per thousand jobs | Location quotient (9) | Hourly mean wage | Annual mean wage (2) |
|---|---|---|---|---|---|
| Kansas nonmetropolitan area | 180 | 0.46 | 1.60 | $ 14.09 | $ 29,310 |
| Western Washington nonmetropolitan area | 170 | 1.36 | 4.76 | $ 16.70 | $ 34,730 |
| North Texas Region of Texas nonmetropolitan area | 120 | 0.43 | 1.49 | $ 13.80 | $ 28,700 |
| Central Missouri nonmetropolitan area | 110 | 0.69 | 2.42 | $ 14.50 | $ 30,160 |
| Piedmont North Carolina nonmetropolitan area | 110 | 0.44 | 1.53 | $ 14.92 | $ 31,040 |
Nonmetropolitan areas with the highest concentration of jobs and location quotients in Floral Designers:
| Nonmetropolitan area | Employment (1) | Employment per thousand jobs | Location quotient (9) | Hourly mean wage | Annual mean wage (2) |
|---|---|---|---|---|---|
| Western Washington nonmetropolitan area | 170 | 1.36 | 4.76 | $ 16.70 | $ 34,730 |
| Southeast-Central Idaho nonmetropolitan area | 90 | 0.94 | 3.30 | $ 15.89 | $ 33,050 |
| Central Utah nonmetropolitan area | 50 | 0.92 | 3.22 | $ 14.55 | $ 30,270 |
| Northwestern Idaho nonmetropolitan area | 60 | 0.87 | 3.05 | $ 14.93 | $ 31,050 |
| Southwest Alabama nonmetropolitan area | 60 | 0.83 | 2.91 | $ 13.84 | $ 28,790 |
Top paying nonmetropolitan areas for Floral Designers:
| Nonmetropolitan area | Employment (1) | Employment per thousand jobs | Location quotient (9) | Hourly mean wage | Annual mean wage (2) |
|---|---|---|---|---|---|
| Southwest Colorado nonmetropolitan area | 30 | 0.33 | 1.16 | $ 21.44 | $ 44,590 |
| Northwest Colorado nonmetropolitan area | 50 | 0.42 | 1.48 | $ 20.69 | $ 43,040 |
| North Valley-Northern Mountains Region of California nonmetropolitan area | 40 | 0.36 | 1.28 | $ 20.05 | $ 41,710 |
| Hawaii / Kauai nonmetropolitan area | 30 | 0.31 | 1.07 | $ 19.60 | $ 40,780 |
| North Coast Region of California nonmetropolitan area | 30 | 0.30 | 1.05 | $ 19.52 | $ 40,590 |
These estimates are calculated with data collected from employers in all industry sectors, all metropolitan and nonmetropolitan areas, and all states and the District of Columbia. The top employment and wage figures are provided above. The complete list is available in the downloadable XLS files.
The percentile wage estimate is the value of a wage below which a certain percent of workers fall. The median wage is the 50th percentile wage estimate—50 percent of workers earn less than the median and 50 percent of workers earn more than the median. More about percentile wages.
(1) Estimates for detailed occupations do not sum to the totals because the totals include occupations not shown separately. Estimates do not include self-employed workers.
(2) Annual wages have been calculated by multiplying the hourly mean wage by a "year-round, full-time" hours figure of 2,080 hours; for those occupations where there is not an hourly wage published, the annual wage has been directly calculated from the reported survey data.
(3) The relative standard error (RSE) is a measure of the reliability of a survey statistic. The smaller the relative standard error, the more precise the estimate.
(9) The location quotient is the ratio of the area concentration of occupational employment to the national average concentration. A location quotient greater than one indicates the occupation has a higher share of employment than average, and a location quotient less than one indicates the occupation is less prevalent in the area than average.
Other OEWS estimates and related information:
May 2023 National Occupational Employment and Wage Estimates
May 2023 State Occupational Employment and Wage Estimates
May 2023 Metropolitan and Nonmetropolitan Area Occupational Employment and Wage Estimates
May 2023 National Industry-Specific Occupational Employment and Wage Estimates
Last Modified Date: April 3, 2024