
An official website of the United States government
An official website of the United States government
The .gov means it's official.
Federal government websites often end in .gov or .mil. Before sharing sensitive information,
make sure you're on a federal government site.
The site is secure.
The
https:// ensures that you are connecting to the official website and that any
information you provide is encrypted and transmitted securely.
Develop and implement websites, web applications, application databases, and interactive web interfaces. Evaluate code to ensure that it is properly structured, meets industry standards, and is compatible with browsers and devices. Optimize website performance, scalability, and server-side code and processes. May develop website infrastructure and integrate websites with other computer applications. Excludes �Special Effects Artists and Animators� (27-1014).
Employment estimate and mean wage estimates for Web Developers:
| Employment (1) | Employment RSE (3) |
Mean hourly wage |
Mean annual wage (2) |
Wage RSE (3) |
|---|---|---|---|---|
| 85,350 | 4.8 % | $ 45.95 | $ 95,570 | 1.9 % |
Percentile wage estimates for Web Developers:
| Percentile | 10% | 25% | 50% (Median) |
75% | 90% |
|---|---|---|---|---|---|
| Hourly Wage | $ 22.53 | $ 29.66 | $ 40.84 | $ 55.95 | $ 75.61 |
| Annual Wage (2) | $ 46,850 | $ 61,690 | $ 84,960 | $ 116,370 | $ 157,280 |
Industries with the highest published employment and wages for Web Developers are provided. For a list of all industries with employment in Web Developers, see the Create Customized Tables function.
Industries with the highest levels of employment in Web Developers:
| Industry | Employment (1) | Percent of industry employment | Hourly mean wage | Annual mean wage (2) |
|---|---|---|---|---|
| Computer Systems Design and Related Services | 22,250 | 0.88 | $ 44.11 | $ 91,740 |
| Management, Scientific, and Technical Consulting Services | 6,440 | 0.35 | $ 42.83 | $ 89,080 |
| Advertising, Public Relations, and Related Services | 4,970 | 0.99 | $ 41.31 | $ 85,930 |
| Computing Infrastructure Providers, Data Processing, Web Hosting, and Related Services | 4,510 | 0.94 | $ 60.51 | $ 125,850 |
| Software Publishers | 3,900 | 0.60 | $ 62.70 | $ 130,420 |
Industries with the highest concentration of employment in Web Developers:
| Industry | Employment (1) | Percent of industry employment | Hourly mean wage | Annual mean wage (2) |
|---|---|---|---|---|
| Advertising, Public Relations, and Related Services | 4,970 | 0.99 | $ 41.31 | $ 85,930 |
| Computing Infrastructure Providers, Data Processing, Web Hosting, and Related Services | 4,510 | 0.94 | $ 60.51 | $ 125,850 |
| Computer Systems Design and Related Services | 22,250 | 0.88 | $ 44.11 | $ 91,740 |
| Web Search Portals, Libraries, Archives, and Other Information Services | 1,580 | 0.86 | $ 57.71 | $ 120,050 |
| Newspaper, Periodical, Book, and Directory Publishers | 1,990 | 0.68 | $ 41.70 | $ 86,730 |
Top paying industries for Web Developers:
| Industry | Employment (1) | Percent of industry employment | Hourly mean wage | Annual mean wage (2) |
|---|---|---|---|---|
| Building Material and Supplies Dealers | 100 | 0.01 | $ 71.23 | $ 148,160 |
| Securities, Commodity Contracts, and Other Financial Investments and Related Activities | 560 | 0.05 | $ 67.77 | $ 140,970 |
| Motor Vehicle Manufacturing | 30 | 0.01 | $ 64.12 | $ 133,360 |
| Software Publishers | 3,900 | 0.60 | $ 62.70 | $ 130,420 |
| Aerospace Product and Parts Manufacturing | 120 | 0.02 | $ 62.40 | $ 129,780 |
States and areas with the highest published employment, location quotients, and wages for Web Developers are provided. For a list of all areas with employment in Web Developers, see the Create Customized Tables function.
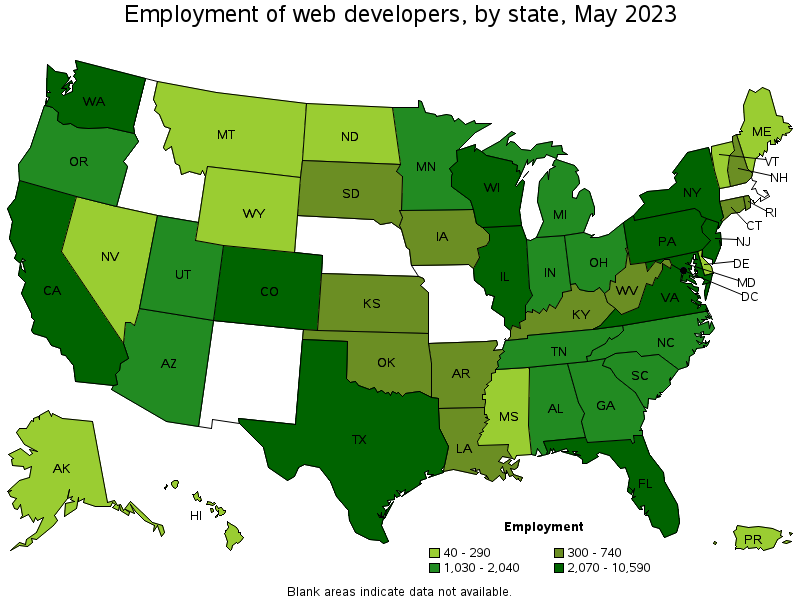
States with the highest employment level in Web Developers:
| State | Employment (1) | Employment per thousand jobs | Location quotient (9) | Hourly mean wage | Annual mean wage (2) |
|---|---|---|---|---|---|
| California | 10,590 | 0.59 | 1.05 | $ 58.41 | $ 121,490 |
| Texas | 6,130 | 0.45 | 0.80 | $ 47.16 | $ 98,090 |
| New York | 5,950 | 0.63 | 1.13 | $ 45.36 | $ 94,340 |
| Florida | 5,860 | 0.61 | 1.09 | $ 45.84 | $ 95,360 |
| Washington | 4,820 | 1.38 | 2.45 | $ 58.13 | $ 120,910 |
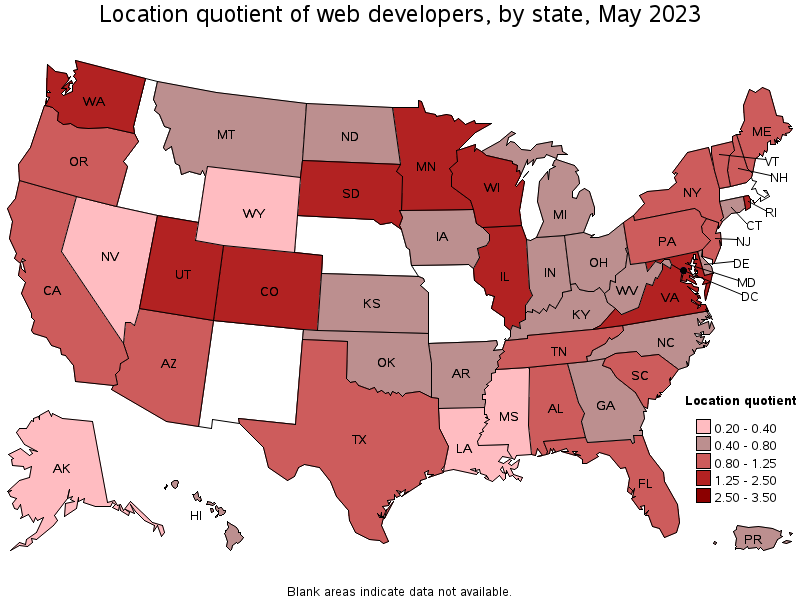
States with the highest concentration of jobs and location quotients in Web Developers:
| State | Employment (1) | Employment per thousand jobs | Location quotient (9) | Hourly mean wage | Annual mean wage (2) |
|---|---|---|---|---|---|
| Washington | 4,820 | 1.38 | 2.45 | $ 58.13 | $ 120,910 |
| Rhode Island | 620 | 1.27 | 2.25 | $ 35.94 | $ 74,750 |
| Virginia | 4,640 | 1.17 | 2.07 | $ 54.13 | $ 112,590 |
| Wisconsin | 2,880 | 1.00 | 1.78 | $ 33.74 | $ 70,170 |
| District of Columbia | 670 | 0.96 | 1.71 | $ 59.44 | $ 123,640 |
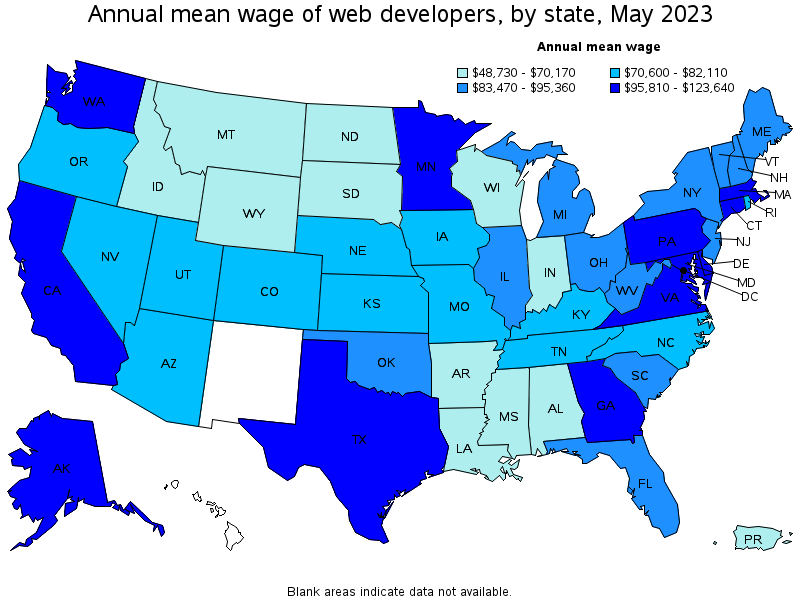
Top paying states for Web Developers:
| State | Employment (1) | Employment per thousand jobs | Location quotient (9) | Hourly mean wage | Annual mean wage (2) |
|---|---|---|---|---|---|
| District of Columbia | 670 | 0.96 | 1.71 | $ 59.44 | $ 123,640 |
| California | 10,590 | 0.59 | 1.05 | $ 58.41 | $ 121,490 |
| Washington | 4,820 | 1.38 | 2.45 | $ 58.13 | $ 120,910 |
| Virginia | 4,640 | 1.17 | 2.07 | $ 54.13 | $ 112,590 |
| Delaware | 130 | 0.27 | 0.49 | $ 51.54 | $ 107,190 |
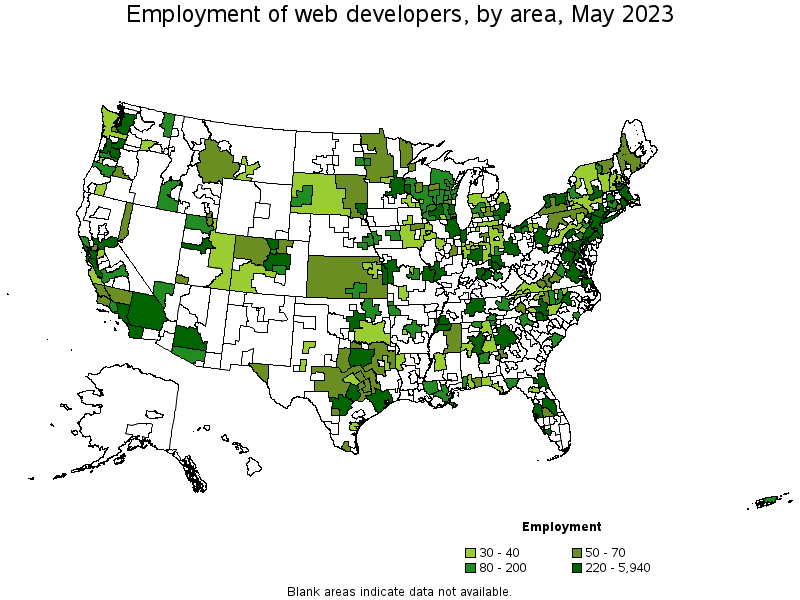
Metropolitan areas with the highest employment level in Web Developers:
| Metropolitan area | Employment (1) | Employment per thousand jobs | Location quotient (9) | Hourly mean wage | Annual mean wage (2) |
|---|---|---|---|---|---|
| New York-Newark-Jersey City, NY-NJ-PA | 5,940 | 0.63 | 1.11 | $ 45.78 | $ 95,220 |
| Washington-Arlington-Alexandria, DC-VA-MD-WV | 4,160 | 1.35 | 2.39 | $ 56.77 | $ 118,080 |
| Seattle-Tacoma-Bellevue, WA | 3,920 | 1.89 | 3.36 | $ 60.11 | $ 125,040 |
| Los Angeles-Long Beach-Anaheim, CA | 3,230 | 0.52 | 0.93 | $ 50.90 | $ 105,860 |
| San Francisco-Oakland-Hayward, CA | 2,820 | 1.16 | 2.07 | $ 71.55 | $ 148,820 |
| Dallas-Fort Worth-Arlington, TX | 1,760 | 0.44 | 0.79 | $ 48.56 | $ 101,000 |
| Chicago-Naperville-Elgin, IL-IN-WI | 1,560 | 0.35 | 0.62 | $ 43.63 | $ 90,740 |
| Denver-Aurora-Lakewood, CO | 1,530 | 0.96 | 1.71 | $ 37.39 | $ 77,780 |
| Houston-The Woodlands-Sugar Land, TX | 1,520 | 0.48 | 0.85 | $ 47.34 | $ 98,470 |
| Minneapolis-St. Paul-Bloomington, MN-WI | 1,490 | 0.78 | 1.39 | $ 50.77 | $ 105,610 |
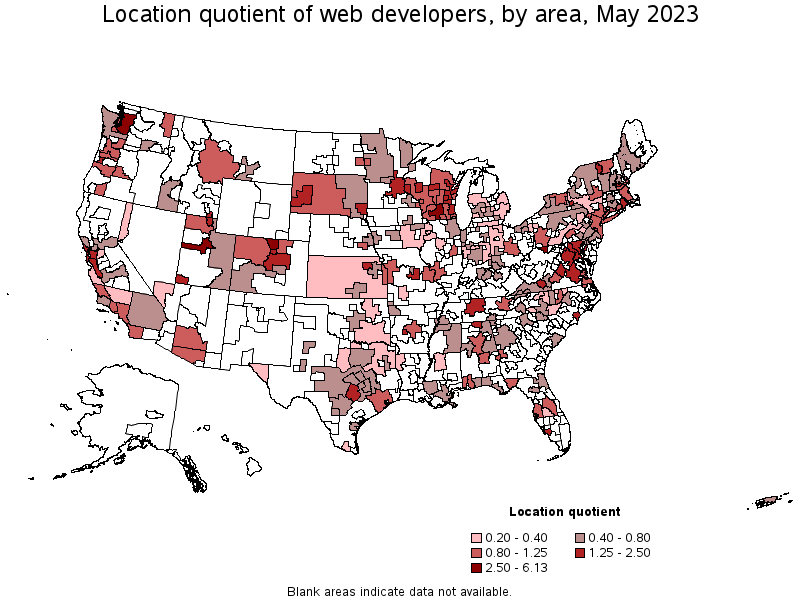
Metropolitan areas with the highest concentration of jobs and location quotients in Web Developers:
| Metropolitan area | Employment (1) | Employment per thousand jobs | Location quotient (9) | Hourly mean wage | Annual mean wage (2) |
|---|---|---|---|---|---|
| Morgantown, WV | 220 | 3.44 | 6.13 | $ 36.49 | $ 75,890 |
| Fort Collins, CO | 380 | 2.18 | 3.87 | $ 36.25 | $ 75,410 |
| Madison, WI | 840 | 2.12 | 3.76 | $ 35.75 | $ 74,370 |
| Seattle-Tacoma-Bellevue, WA | 3,920 | 1.89 | 3.36 | $ 60.11 | $ 125,040 |
| Provo-Orem, UT | 510 | 1.73 | 3.08 | $ 37.16 | $ 77,290 |
| Washington-Arlington-Alexandria, DC-VA-MD-WV | 4,160 | 1.35 | 2.39 | $ 56.77 | $ 118,080 |
| Sioux Falls, SD | 220 | 1.32 | 2.35 | $ 26.47 | $ 55,060 |
| Rapid City, SD | 90 | 1.30 | 2.31 | $ 23.75 | $ 49,400 |
| San Jose-Sunnyvale-Santa Clara, CA | 1,450 | 1.27 | 2.26 | $ 75.23 | $ 156,480 |
| San Francisco-Oakland-Hayward, CA | 2,820 | 1.16 | 2.07 | $ 71.55 | $ 148,820 |
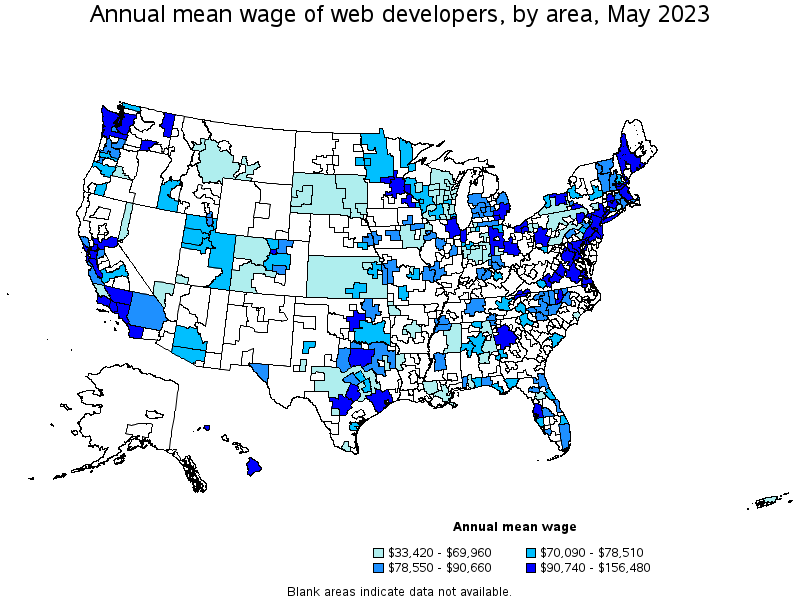
Top paying metropolitan areas for Web Developers:
| Metropolitan area | Employment (1) | Employment per thousand jobs | Location quotient (9) | Hourly mean wage | Annual mean wage (2) |
|---|---|---|---|---|---|
| San Jose-Sunnyvale-Santa Clara, CA | 1,450 | 1.27 | 2.26 | $ 75.23 | $ 156,480 |
| San Francisco-Oakland-Hayward, CA | 2,820 | 1.16 | 2.07 | $ 71.55 | $ 148,820 |
| Seattle-Tacoma-Bellevue, WA | 3,920 | 1.89 | 3.36 | $ 60.11 | $ 125,040 |
| Washington-Arlington-Alexandria, DC-VA-MD-WV | 4,160 | 1.35 | 2.39 | $ 56.77 | $ 118,080 |
| Rochester, MN | 30 | 0.28 | 0.49 | $ 55.71 | $ 115,880 |
| Vallejo-Fairfield, CA | 50 | 0.35 | 0.62 | $ 55.65 | $ 115,760 |
| Santa Maria-Santa Barbara, CA | 70 | 0.35 | 0.62 | $ 55.53 | $ 115,510 |
| Lynchburg, VA | 50 | 0.54 | 0.97 | $ 55.29 | $ 115,000 |
| Philadelphia-Camden-Wilmington, PA-NJ-DE-MD | 1,230 | 0.43 | 0.77 | $ 54.72 | $ 113,820 |
| Atlanta-Sandy Springs-Roswell, GA | 970 | 0.35 | 0.62 | $ 54.21 | $ 112,760 |
Nonmetropolitan areas with the highest employment in Web Developers:
| Nonmetropolitan area | Employment (1) | Employment per thousand jobs | Location quotient (9) | Hourly mean wage | Annual mean wage (2) |
|---|---|---|---|---|---|
| South Central Wisconsin nonmetropolitan area | 140 | 0.70 | 1.24 | $ 30.06 | $ 62,520 |
| Northeastern Wisconsin nonmetropolitan area | 120 | 0.61 | 1.08 | $ 31.91 | $ 66,380 |
| Western Wisconsin nonmetropolitan area | 80 | 0.57 | 1.02 | $ 34.69 | $ 72,150 |
| Southwest Montana nonmetropolitan area | 70 | 0.46 | 0.81 | $ 29.80 | $ 61,990 |
| Northwest Colorado nonmetropolitan area | 70 | 0.53 | 0.94 | $ 31.72 | $ 65,980 |
Nonmetropolitan areas with the highest concentration of jobs and location quotients in Web Developers:
| Nonmetropolitan area | Employment (1) | Employment per thousand jobs | Location quotient (9) | Hourly mean wage | Annual mean wage (2) |
|---|---|---|---|---|---|
| South Central Wisconsin nonmetropolitan area | 140 | 0.70 | 1.24 | $ 30.06 | $ 62,520 |
| Northern Vermont nonmetropolitan area | 50 | 0.66 | 1.17 | $ 41.17 | $ 85,630 |
| Northeastern Wisconsin nonmetropolitan area | 120 | 0.61 | 1.08 | $ 31.91 | $ 66,380 |
| Western Wisconsin nonmetropolitan area | 80 | 0.57 | 1.02 | $ 34.69 | $ 72,150 |
| Northwest Colorado nonmetropolitan area | 70 | 0.53 | 0.94 | $ 31.72 | $ 65,980 |
Top paying nonmetropolitan areas for Web Developers:
| Nonmetropolitan area | Employment (1) | Employment per thousand jobs | Location quotient (9) | Hourly mean wage | Annual mean wage (2) |
|---|---|---|---|---|---|
| Hawaii / Kauai nonmetropolitan area | (8) | (8) | (8) | $ 50.47 | $ 104,970 |
| Southwest Maine nonmetropolitan area | 50 | 0.25 | 0.45 | $ 46.18 | $ 96,060 |
| Western Washington nonmetropolitan area | 30 | 0.24 | 0.42 | $ 45.40 | $ 94,440 |
| West Northwestern Ohio nonmetropolitan area | 30 | 0.12 | 0.22 | $ 43.69 | $ 90,870 |
| North Texas Region of Texas nonmetropolitan area | 50 | 0.17 | 0.30 | $ 43.00 | $ 89,440 |
These estimates are calculated with data collected from employers in all industry sectors, all metropolitan and nonmetropolitan areas, and all states and the District of Columbia. The top employment and wage figures are provided above. The complete list is available in the downloadable XLS files.
The percentile wage estimate is the value of a wage below which a certain percent of workers fall. The median wage is the 50th percentile wage estimate—50 percent of workers earn less than the median and 50 percent of workers earn more than the median. More about percentile wages.
(1) Estimates for detailed occupations do not sum to the totals because the totals include occupations not shown separately. Estimates do not include self-employed workers.
(2) Annual wages have been calculated by multiplying the hourly mean wage by a "year-round, full-time" hours figure of 2,080 hours; for those occupations where there is not an hourly wage published, the annual wage has been directly calculated from the reported survey data.
(3) The relative standard error (RSE) is a measure of the reliability of a survey statistic. The smaller the relative standard error, the more precise the estimate.
(8) Estimate not released.
(9) The location quotient is the ratio of the area concentration of occupational employment to the national average concentration. A location quotient greater than one indicates the occupation has a higher share of employment than average, and a location quotient less than one indicates the occupation is less prevalent in the area than average.
Other OEWS estimates and related information:
May 2023 National Occupational Employment and Wage Estimates
May 2023 State Occupational Employment and Wage Estimates
May 2023 Metropolitan and Nonmetropolitan Area Occupational Employment and Wage Estimates
May 2023 National Industry-Specific Occupational Employment and Wage Estimates
Last Modified Date: April 3, 2024