
An official website of the United States government
An official website of the United States government
The .gov means it's official.
Federal government websites often end in .gov or .mil. Before sharing sensitive information,
make sure you're on a federal government site.
The site is secure.
The
https:// ensures that you are connecting to the official website and that any
information you provide is encrypted and transmitted securely.
Plan, direct, or coordinate activities in such fields as architecture and engineering or research and development in these fields. Excludes �Natural Sciences Managers� (11-9121).
Employment estimate and mean wage estimates for Architectural and Engineering Managers:
| Employment (1) | Employment RSE (3) |
Mean hourly wage |
Mean annual wage (2) |
Wage RSE (3) |
|---|---|---|---|---|
| 207,800 | 2.1 % | $ 82.83 | $ 172,290 | 0.5 % |
Percentile wage estimates for Architectural and Engineering Managers:
| Percentile | 10% | 25% | 50% (Median) |
75% | 90% |
|---|---|---|---|---|---|
| Hourly Wage | $ 51.63 | $ 63.89 | $ 79.50 | $ 97.61 | $ 112.31 |
| Annual Wage (2) | $ 107,390 | $ 132,890 | $ 165,370 | $ 203,030 | $ 233,590 |
Industries with the highest published employment and wages for Architectural and Engineering Managers are provided. For a list of all industries with employment in Architectural and Engineering Managers, see the Create Customized Tables function.
Industries with the highest levels of employment in Architectural and Engineering Managers:
| Industry | Employment (1) | Percent of industry employment | Hourly mean wage | Annual mean wage (2) |
|---|---|---|---|---|
| Architectural, Engineering, and Related Services | 54,710 | 3.33 | $ 78.68 | $ 163,650 |
| Scientific Research and Development Services | 12,620 | 1.37 | $ 95.21 | $ 198,030 |
| Management of Companies and Enterprises | 11,490 | 0.41 | $ 89.82 | $ 186,830 |
| Aerospace Product and Parts Manufacturing | 10,200 | 2.00 | $ 89.71 | $ 186,590 |
| Semiconductor and Other Electronic Component Manufacturing | 9,310 | 2.37 | $ 92.69 | $ 192,800 |
Industries with the highest concentration of employment in Architectural and Engineering Managers:
| Industry | Employment (1) | Percent of industry employment | Hourly mean wage | Annual mean wage (2) |
|---|---|---|---|---|
| Architectural, Engineering, and Related Services | 54,710 | 3.33 | $ 78.68 | $ 163,650 |
| Semiconductor and Other Electronic Component Manufacturing | 9,310 | 2.37 | $ 92.69 | $ 192,800 |
| Communications Equipment Manufacturing | 1,780 | 2.13 | $ 87.19 | $ 181,350 |
| Aerospace Product and Parts Manufacturing | 10,200 | 2.00 | $ 89.71 | $ 186,590 |
| Navigational, Measuring, Electromedical, and Control Instruments Manufacturing | 8,290 | 1.95 | $ 87.97 | $ 182,980 |
Top paying industries for Architectural and Engineering Managers:
| Industry | Employment (1) | Percent of industry employment | Hourly mean wage | Annual mean wage (2) |
|---|---|---|---|---|
| Media Streaming Distribution Services, Social Networks, and Other Media Networks and Content Providers | 230 | 0.10 | $ 129.00 | $ 268,310 |
| Spectator Sports | 70 | 0.05 | $ 124.80 | $ 259,590 |
| Oil and Gas Extraction | 890 | 0.82 | $ 123.59 | $ 257,060 |
| Manufacturing and Reproducing Magnetic and Optical Media | 70 | 0.64 | $ 117.11 | $ 243,580 |
| Computing Infrastructure Providers, Data Processing, Web Hosting, and Related Services | 350 | 0.07 | $ 110.47 | $ 229,790 |
States and areas with the highest published employment, location quotients, and wages for Architectural and Engineering Managers are provided. For a list of all areas with employment in Architectural and Engineering Managers, see the Create Customized Tables function.
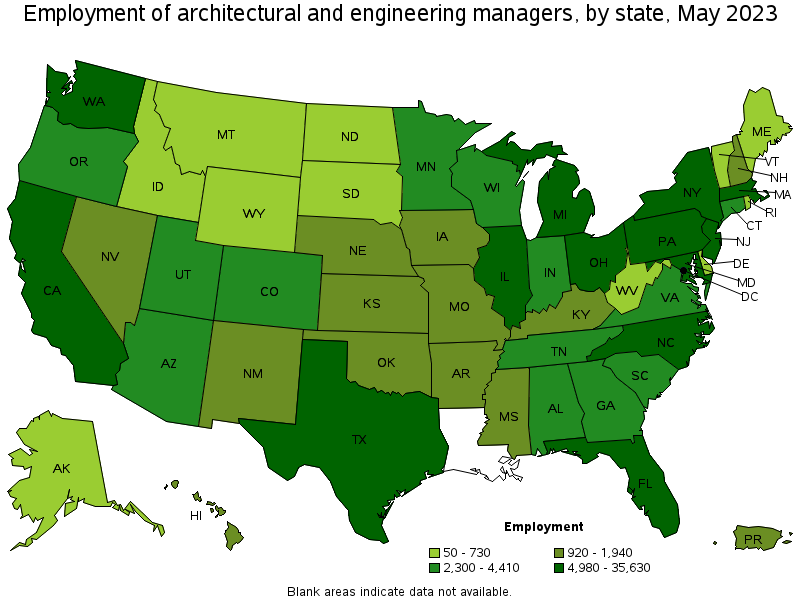
States with the highest employment level in Architectural and Engineering Managers:
| State | Employment (1) | Employment per thousand jobs | Location quotient (9) | Hourly mean wage | Annual mean wage (2) |
|---|---|---|---|---|---|
| California | 35,630 | 1.99 | 1.45 | $ 96.87 | $ 201,480 |
| Texas | 18,540 | 1.37 | 1.00 | $ 89.10 | $ 185,320 |
| Michigan | 13,300 | 3.06 | 2.24 | $ 75.50 | $ 157,050 |
| Pennsylvania | 9,500 | 1.60 | 1.17 | $ 75.97 | $ 158,010 |
| Illinois | 8,310 | 1.38 | 1.01 | $ 77.62 | $ 161,450 |
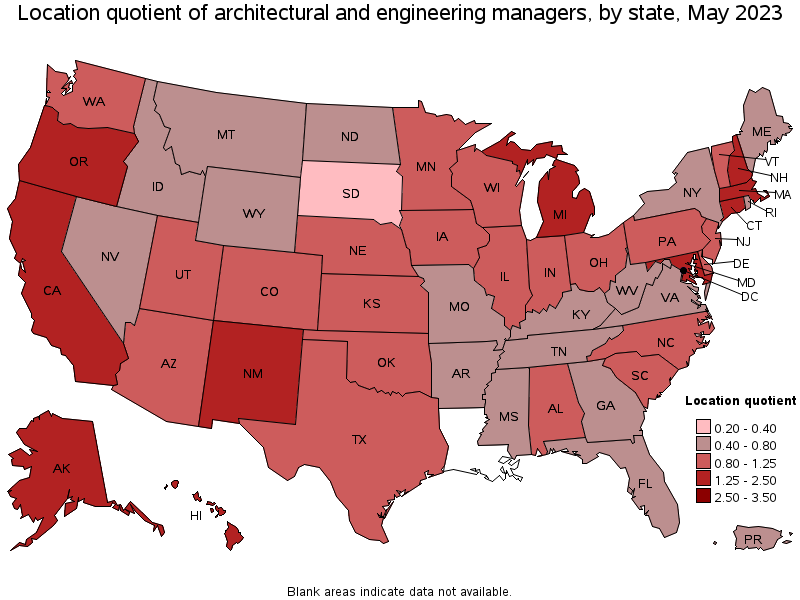
States with the highest concentration of jobs and location quotients in Architectural and Engineering Managers:
| State | Employment (1) | Employment per thousand jobs | Location quotient (9) | Hourly mean wage | Annual mean wage (2) |
|---|---|---|---|---|---|
| Michigan | 13,300 | 3.06 | 2.24 | $ 75.50 | $ 157,050 |
| New Hampshire | 1,770 | 2.62 | 1.91 | $ 86.50 | $ 179,920 |
| Connecticut | 4,140 | 2.50 | 1.82 | $ 80.39 | $ 167,220 |
| Oregon | 4,370 | 2.25 | 1.64 | $ 80.49 | $ 167,420 |
| New Mexico | 1,790 | 2.12 | 1.55 | $ 98.01 | $ 203,850 |
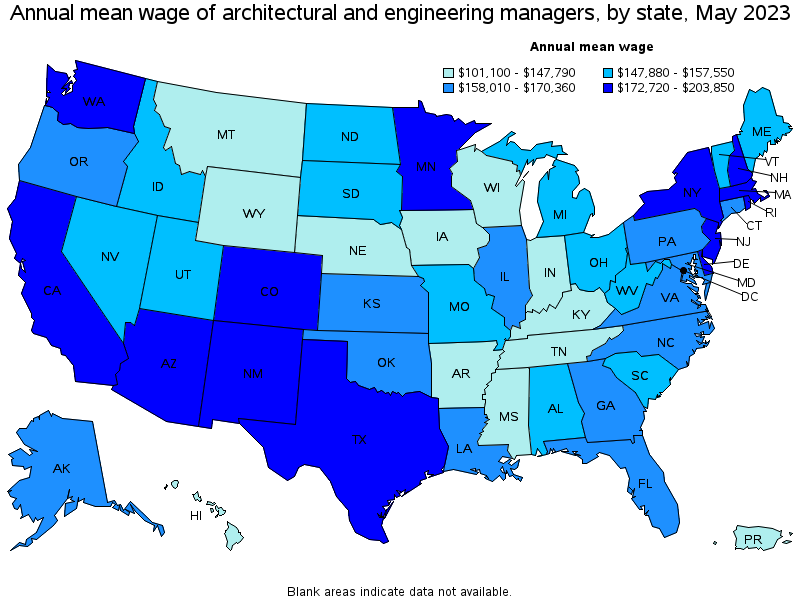
Top paying states for Architectural and Engineering Managers:
| State | Employment (1) | Employment per thousand jobs | Location quotient (9) | Hourly mean wage | Annual mean wage (2) |
|---|---|---|---|---|---|
| New Mexico | 1,790 | 2.12 | 1.55 | $ 98.01 | $ 203,850 |
| California | 35,630 | 1.99 | 1.45 | $ 96.87 | $ 201,480 |
| Colorado | 4,090 | 1.44 | 1.06 | $ 90.20 | $ 187,620 |
| Rhode Island | 310 | 0.64 | 0.47 | $ 89.53 | $ 186,220 |
| Washington | 5,560 | 1.59 | 1.16 | $ 89.43 | $ 186,020 |
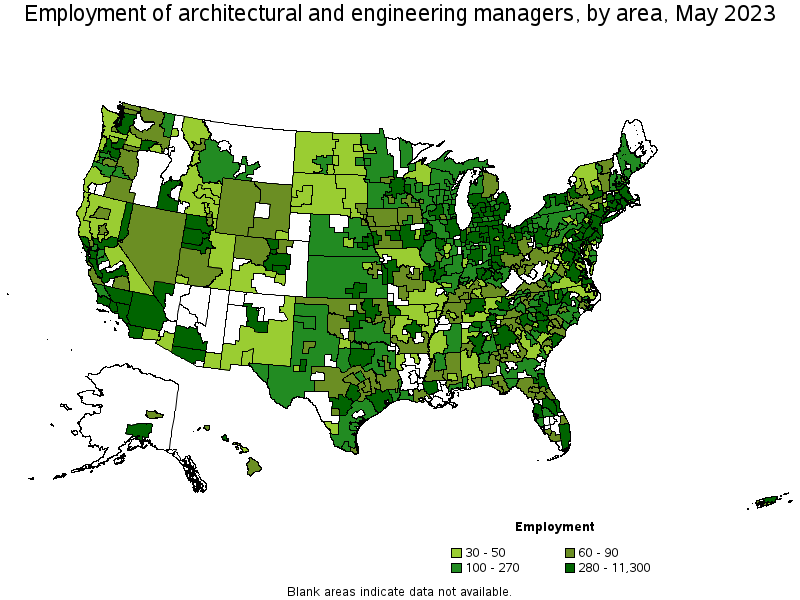
Metropolitan areas with the highest employment level in Architectural and Engineering Managers:
| Metropolitan area | Employment (1) | Employment per thousand jobs | Location quotient (9) | Hourly mean wage | Annual mean wage (2) |
|---|---|---|---|---|---|
| Los Angeles-Long Beach-Anaheim, CA | 11,300 | 1.83 | 1.33 | $ 89.67 | $ 186,510 |
| Detroit-Warren-Dearborn, MI | 8,420 | 4.43 | 3.24 | $ 77.72 | $ 161,650 |
| New York-Newark-Jersey City, NY-NJ-PA | 7,390 | 0.78 | 0.57 | $ 91.33 | $ 189,970 |
| Boston-Cambridge-Nashua, MA-NH | 6,730 | 2.44 | 1.78 | $ 90.01 | $ 187,210 |
| San Jose-Sunnyvale-Santa Clara, CA | 6,720 | 5.88 | 4.30 | $ 117.12 | $ 243,600 |
| Chicago-Naperville-Elgin, IL-IN-WI | 6,240 | 1.38 | 1.01 | $ 78.08 | $ 162,410 |
| San Francisco-Oakland-Hayward, CA | 6,230 | 2.57 | 1.88 | $ 105.99 | $ 220,450 |
| Dallas-Fort Worth-Arlington, TX | 5,930 | 1.50 | 1.09 | $ 92.49 | $ 192,370 |
| Houston-The Woodlands-Sugar Land, TX | 5,760 | 1.81 | 1.32 | $ 88.70 | $ 184,500 |
| Washington-Arlington-Alexandria, DC-VA-MD-WV | 5,260 | 1.70 | 1.24 | $ 84.28 | $ 175,290 |
Metropolitan areas with the highest concentration of jobs and location quotients in Architectural and Engineering Managers:
| Metropolitan area | Employment (1) | Employment per thousand jobs | Location quotient (9) | Hourly mean wage | Annual mean wage (2) |
|---|---|---|---|---|---|
| San Jose-Sunnyvale-Santa Clara, CA | 6,720 | 5.88 | 4.30 | $ 117.12 | $ 243,600 |
| Huntsville, AL | 1,280 | 5.08 | 3.71 | $ 78.95 | $ 164,210 |
| Detroit-Warren-Dearborn, MI | 8,420 | 4.43 | 3.24 | $ 77.72 | $ 161,650 |
| Dubuque, IA | 260 | 4.42 | 3.23 | $ 72.28 | $ 150,340 |
| Midland, MI | 140 | 3.77 | 2.75 | $ 82.77 | $ 172,160 |
| Palm Bay-Melbourne-Titusville, FL | 860 | 3.65 | 2.66 | $ 82.80 | $ 172,220 |
| Ann Arbor, MI | 770 | 3.59 | 2.63 | $ 82.12 | $ 170,810 |
| Corvallis, OR | 130 | 3.39 | 2.47 | $ 77.37 | $ 160,930 |
| Cumberland, MD-WV | 120 | 3.30 | 2.41 | $ 66.93 | $ 139,220 |
| Boulder, CO | 630 | 3.26 | 2.38 | $ 93.62 | $ 194,730 |
Top paying metropolitan areas for Architectural and Engineering Managers:
| Metropolitan area | Employment (1) | Employment per thousand jobs | Location quotient (9) | Hourly mean wage | Annual mean wage (2) |
|---|---|---|---|---|---|
| San Jose-Sunnyvale-Santa Clara, CA | 6,720 | 5.88 | 4.30 | $ 117.12 | $ 243,600 |
| San Francisco-Oakland-Hayward, CA | 6,230 | 2.57 | 1.88 | $ 105.99 | $ 220,450 |
| Midland, TX | 290 | 2.54 | 1.86 | $ 98.24 | $ 204,340 |
| Santa Cruz-Watsonville, CA | 90 | 0.87 | 0.64 | $ 96.93 | $ 201,620 |
| Albuquerque, NM | 1,250 | 3.17 | 2.31 | $ 94.34 | $ 196,230 |
| Boulder, CO | 630 | 3.26 | 2.38 | $ 93.62 | $ 194,730 |
| Seattle-Tacoma-Bellevue, WA | 4,030 | 1.94 | 1.42 | $ 92.49 | $ 192,390 |
| Dallas-Fort Worth-Arlington, TX | 5,930 | 1.50 | 1.09 | $ 92.49 | $ 192,370 |
| Colorado Springs, CO | 440 | 1.41 | 1.03 | $ 91.82 | $ 190,990 |
| Bridgeport-Stamford-Norwalk, CT | 1,140 | 2.84 | 2.07 | $ 91.63 | $ 190,590 |
Nonmetropolitan areas with the highest employment in Architectural and Engineering Managers:
| Nonmetropolitan area | Employment (1) | Employment per thousand jobs | Location quotient (9) | Hourly mean wage | Annual mean wage (2) |
|---|---|---|---|---|---|
| West Northwestern Ohio nonmetropolitan area | 480 | 1.92 | 1.40 | $ 67.56 | $ 140,530 |
| Balance of Lower Peninsula of Michigan nonmetropolitan area | 410 | 1.56 | 1.14 | $ 69.26 | $ 144,060 |
| Southeast Iowa nonmetropolitan area | 350 | 1.63 | 1.19 | $ 73.95 | $ 153,810 |
| North Northeastern Ohio nonmetropolitan area (noncontiguous) | 340 | 1.06 | 0.77 | $ 66.93 | $ 139,210 |
| Northern Indiana nonmetropolitan area | 340 | 1.58 | 1.16 | $ 69.20 | $ 143,930 |
Nonmetropolitan areas with the highest concentration of jobs and location quotients in Architectural and Engineering Managers:
| Nonmetropolitan area | Employment (1) | Employment per thousand jobs | Location quotient (9) | Hourly mean wage | Annual mean wage (2) |
|---|---|---|---|---|---|
| West Northwestern Ohio nonmetropolitan area | 480 | 1.92 | 1.40 | $ 67.56 | $ 140,530 |
| West Central-Southwest New Hampshire nonmetropolitan area | 170 | 1.70 | 1.24 | $ 78.17 | $ 162,600 |
| Southeast Iowa nonmetropolitan area | 350 | 1.63 | 1.19 | $ 73.95 | $ 153,810 |
| Northern Indiana nonmetropolitan area | 340 | 1.58 | 1.16 | $ 69.20 | $ 143,930 |
| Balance of Lower Peninsula of Michigan nonmetropolitan area | 410 | 1.56 | 1.14 | $ 69.26 | $ 144,060 |
Top paying nonmetropolitan areas for Architectural and Engineering Managers:
| Nonmetropolitan area | Employment (1) | Employment per thousand jobs | Location quotient (9) | Hourly mean wage | Annual mean wage (2) |
|---|---|---|---|---|---|
| West Texas Region of Texas nonmetropolitan area | 130 | 0.65 | 0.48 | $ 97.82 | $ 203,470 |
| Southwest New York nonmetropolitan area | 200 | 1.15 | 0.84 | $ 92.12 | $ 191,610 |
| West North Dakota nonmetropolitan area | 40 | 0.32 | 0.23 | $ 86.93 | $ 180,820 |
| Big Thicket Region of Texas nonmetropolitan area | 60 | 0.59 | 0.43 | $ 83.06 | $ 172,760 |
| Central New Hampshire nonmetropolitan area | 110 | 1.23 | 0.90 | $ 81.28 | $ 169,060 |
These estimates are calculated with data collected from employers in all industry sectors, all metropolitan and nonmetropolitan areas, and all states and the District of Columbia. The top employment and wage figures are provided above. The complete list is available in the downloadable XLS files.
The percentile wage estimate is the value of a wage below which a certain percent of workers fall. The median wage is the 50th percentile wage estimate—50 percent of workers earn less than the median and 50 percent of workers earn more than the median. More about percentile wages.
(1) Estimates for detailed occupations do not sum to the totals because the totals include occupations not shown separately. Estimates do not include self-employed workers.
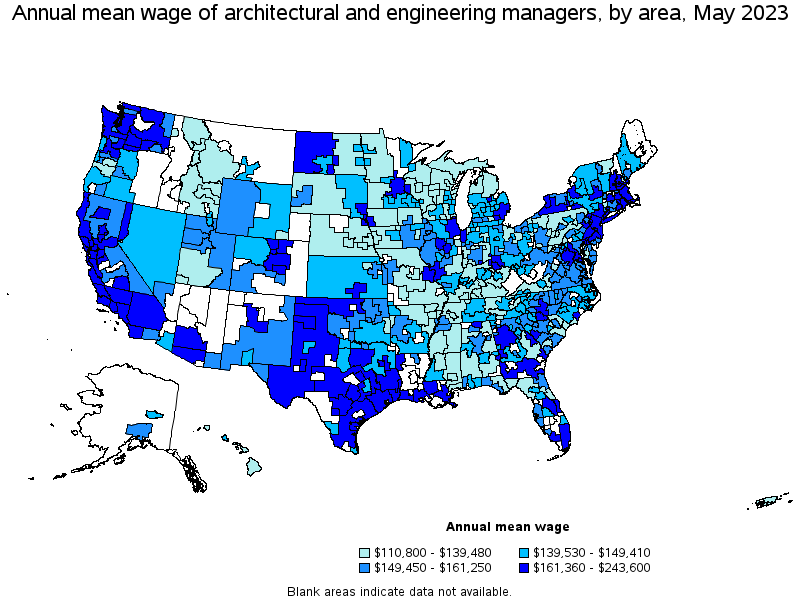
(2) Annual wages have been calculated by multiplying the hourly mean wage by a "year-round, full-time" hours figure of 2,080 hours; for those occupations where there is not an hourly wage published, the annual wage has been directly calculated from the reported survey data.
(3) The relative standard error (RSE) is a measure of the reliability of a survey statistic. The smaller the relative standard error, the more precise the estimate.
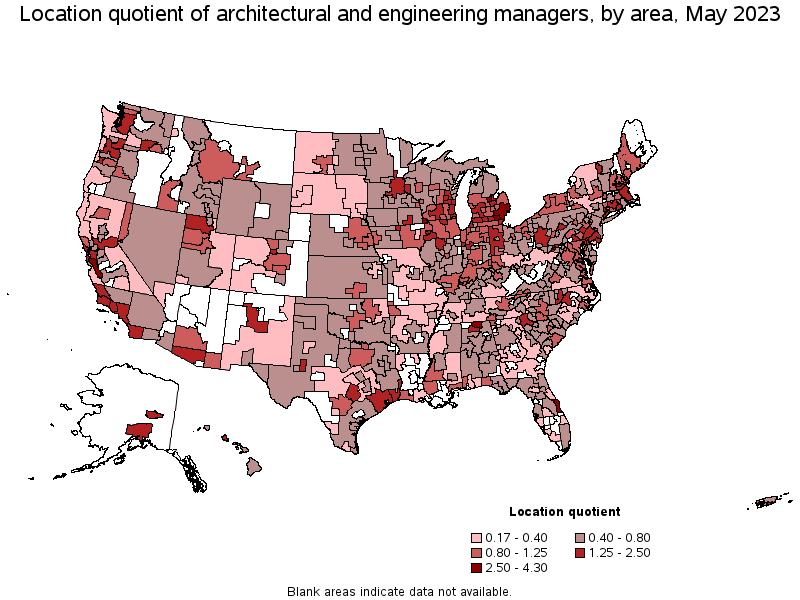
(9) The location quotient is the ratio of the area concentration of occupational employment to the national average concentration. A location quotient greater than one indicates the occupation has a higher share of employment than average, and a location quotient less than one indicates the occupation is less prevalent in the area than average.
Other OEWS estimates and related information:
May 2023 National Occupational Employment and Wage Estimates
May 2023 State Occupational Employment and Wage Estimates
May 2023 Metropolitan and Nonmetropolitan Area Occupational Employment and Wage Estimates
May 2023 National Industry-Specific Occupational Employment and Wage Estimates
Last Modified Date: April 3, 2024