Department of Labor Logo United States Department of Labor
Dot gov

The .gov means it's official.
Federal government websites often end in .gov or .mil. Before sharing sensitive information, make sure you're on a federal government site.

Https

The site is secure.
The https:// ensures that you are connecting to the official website and that any information you provide is encrypted and transmitted securely.

International Labor Comparisons

International Comparisons of Annual Labor Force Statistics, 1970-2012

REPORT (PDF)
Technical notes (PDF)
Country notes (PDF)
Tables by indicator (XLS), and tables by country (XLS)

Inquiries and Feedback

Elimination of ILC
  • BLS has eliminated the International Labor Comparisons (ILC) program. This is the last scheduled release of new data on international comparisons of labor force statistics.

Highlights

The unemployment rate is the unemployed as a percentage of the labor force; it is the most widely used measure of an economy’s unused labor supply. In 2012, the United States had the 6th highest unemployment rate of the 16 countries covered. Spain ranked the highest followed closely by South Africa, while the Republic of Korea maintained the lowest unemployment rate for the year. For more details on unemploy-ment rates, see page 2 or the Technical Notes.

Highlights
 

The employment growth rate measures the change in the number of persons working for a given period. From 2011 to 2012, employment increased in 12 of the 16 countries compared. Mexico had the highest growth, followed by Turkey. New Zealand showed no change. Spain experienced the steepest decline in employment. For more details on employment, see page 7 or the Technical Notes.

Back to Top Back to Top

Unemployment rates


Unemployment rates, 2006-2012
 

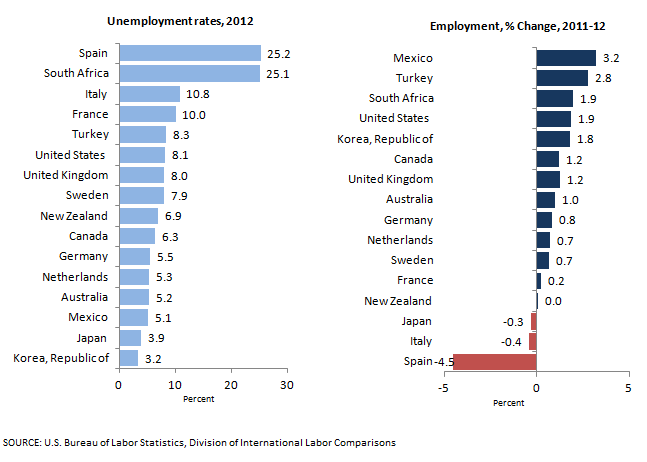
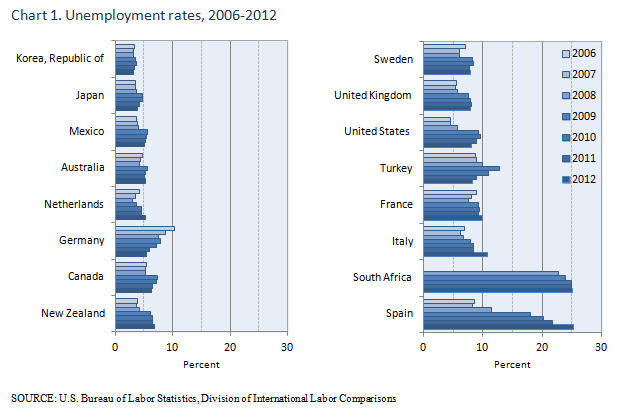
Over the last 7 years, the unemployment rates for the United States and most other countries remained below 10 percent, even during the downturn of the 2009 global recession. However, rates in Spain and South Africa were higher than 15 percent during the period.

Table 1. Unemployment rates (in percent)
  1970 1980 1990 2000 2006 2007 2008 2009 2010 2011 2012

United States

4.9 7.1 5.6 4.0 4.6 4.6 5.8 9.3 9.6 8.9 8.1

Australia

1.7 6.1 6.9 6.3 4.8 4.4 4.2 5.6 5.2 5.1 5.2

Canada

5.7 7.3 7.7 6.1 5.5 5.2 5.3 7.3 7.1 6.5 6.3

France

2.5 5.6 8.0 8.6 8.9 8.1 7.5 9.2 9.4 9.3 10.0

Germany

0.5 2.8 5.0 7.8 10.3 8.7 7.6 7.8 7.1 5.9 5.5

Italy

3.2 4.4 7.0 10.1 6.9 6.2 6.8 7.9 8.5 8.5 10.8

Japan

1.2 2.0 2.0 4.4 3.6 3.6 3.7 4.8 4.7 4.2 3.9

Korea, Republic of

4.4 5.2 2.4 b 4.4 3.4 3.2 3.2 3.6 3.7 3.4 3.2

Mexico

NA NA NA NA 3.7 3.8 4.1 5.6 b 5.4 5.3 5.1

Netherlands

NA 6.0 7.6 b 3.1 4.3 3.5 3.0 3.7 b 4.5 4.5 5.3

New Zealand

NA NA 8.0 6.1 3.8 3.7 4.2 6.1 6.5 6.5 6.9

South Africa

NA NA NA NA NA NA 22.8 23.9 24.9 24.9 25.1

Spain

NA 11.3 15.2 12.0 8.6 8.3 11.4 18.1 20.2 21.8 25.2

Sweden

1.5 2.0 1.8 5.8 7.0 6.1 6.1 8.3 8.5 7.7 7.9

Turkey

NA NA NA NA 8.8 9.0 9.9 12.8 10.9 9.0 8.3

United Kingdom

NA 6.8 7.1 5.5 5.5 5.4 5.7 7.6 7.9 8.1 8.0

Note:
NA Not available.
(b) indicates a break in series; see country notes for break year and more information.

Source: U.S. Bureau of Labor Statistics, International Labor Comparisons
 

Back to Top Back to Top

Unemployment rates by sex


Unemployment rates by sex, 2012
 

Historically, unemployment rates have been higher for women than for men; however, in recent years the reverse has been true in an increasing number of countries. In 2012, unemployment rates for men were higher than for women in 7 of the 16 countries compared: the United States, Canada, Germany, Republic of Korea, Netherlands, Sweden, and the United Kingdom.

Table 2. Unemployment rates by sex (in percent)
  2008 2009 2010 2011 2012
Men Women Men Women Men Women Men Women Men Women

United States

6.1 5.4 10.3 8.1 10.5 8.6 9.4 8.5 8.2 7.9

Australia

4.0 4.6 5.7 5.4 5.1 5.4 4.9 5.3 5.2 5.3

Canada

5.8 4.8 8.5 6.1 7.8 6.2 7.0 5.9 6.7 5.8

France

7.0 7.9 9.1 9.4 9.1 9.7 8.9 9.7 9.9 10.0

Germany

7.5 7.7 8.2 7.3 7.6 6.5 6.2 5.6 5.7 5.2

Italy

5.6 8.5 6.9 9.3 7.7 9.7 7.7 9.6 10.0 11.9

Japan

3.2 4.3 4.4 5.2 4.5 5.0 4.1 4.4 3.6 4.2

Korea, Republic of

3.6 2.6 4.1 3.0 4.0 3.3 3.6 3.1 3.4 3.0

Mexico

3.9 4.3 5.5 5.6 b 5.5 b 5.4 5.3 5.3 5.0 5.1

Netherlands

2.8 3.3 3.7 3.7 b 4.4 b 4.5 4.5 4.4 5.4 5.2

New Zealand

4.1 4.2 6.1 6.1 6.2 6.9 6.3 6.7 6.5 7.3

South Africa

19.8 26.4 22.0 26.2 22.8 27.5 22.5 27.8 22.9 27.8

Spain

10.1 13.1 17.9 18.5 19.9 20.6 21.4 22.2 24.9 25.5

Sweden

5.8 6.3 8.6 7.9 8.6 8.4 7.8 7.6 8.2 7.6

Turkey

9.6 10.5 12.6 13.3 10.4 12.0 8.3 10.7 7.7 10.0

United Kingdom

6.2 5.1 8.7 6.4 8.7 6.9 8.8 7.3 8.4 7.4

Note:
(b) indicates a break in series; see country notes for break year and more information.

Source: U.S. Bureau of Labor Statistics, International Labor Comparisons
 

Back to Top Back to Top

Unemployment rates by age


Unemployment rates by age, 2012
 

For nearly all countries shown, unemployment rates for teens (15-19) have historically been higher than rates for the other age groups compared. Turkey and the Republic of Korea were the only two countries to have higher unemployment rates for young adults (20-24) than for teens. Japan’s unemployment rates for teens and young adults were virtually the same. Spain and Italy had the largest increases in teen unemployment over the 2009-2012 period.

Table 3. Unemployment rates by age (in percent)
  2009 2010 2011 2012
15-19 20-24 25+ 15-19 20-24 25+ 15-19 20-24 25+ 15-19 20-24 25+

United States

24.3 14.7 7.9 25.9 15.5 8.2 24.4 14.6 7.6 24.0 13.3 6.8

Australia

16.5 8.2 4.3 16.8 8.1 3.8 16.1 8.3 3.7 16.7 8.6 3.9

Canada

18.5 11.2 6.1 18.6 10.7 5.9 17.7 10.1 5.4 18.7 10.0 5.1

France

30.9 21.6 7.6 29.7 21.4 7.9 29.4 20.5 7.9 32.8 21.9 8.4

Germany

11.3 11.1 7.3 10.7 9.5 6.8 10.0 8.2 5.6 9.2 7.9 5.2

Italy

40.3 23.0 6.5 45.8 25.0 7.1 48.7 26.3 7.0 56.9 32.1 9.0

Japan

9.5 8.9 4.4 9.9 9.0 4.3 9.0 7.9 3.9 7.6 7.5 3.5

Korea, Republic of

12.3 9.5 3.2 12.1 9.4 3.3 10.6 9.4 3.0 8.7 9.0 2.8

Mexico

11.2 10.1 4.3 b 11.0 b 9.5 b 4.2 10.9 9.7 4.1 10.5 9.5 3.9

Netherlands

9.4 6.1 2.9 b 11.2 b 7.0 b 3.7 10.5 5.7 3.9 12.8 7.2 4.5

New Zealand

23.4 11.5 4.0 24.7 12.0 4.5 25.7 12.2 4.4 25.8 13.1 4.9

South Africa

NA NA 19.3 NA NA 20.3 NA NA 20.6 NA NA 20.7

Spain

56.4 34.0 16.0 62.3 37.7 18.1 64.6 43.2 19.5 73.3 49.7 22.8

Sweden

35.9 20.0 5.9 35.6 19.9 6.2 33.9 18.1 5.5 35.8 19.0 5.7

Turkey

22.0 24.3 10.5 17.7 21.9 8.9 15.0 18.5 7.3 13.9 17.5 6.9

United Kingdom

26.8 15.3 5.6 29.1 15.3 5.8 31.2 16.5 5.8 30.5 16.9 5.7

Note:
NA Not available.
(b) indicates a break in series; see country notes for break year and more information.
Lower age limits for teens vary by country, see technical notes.

Source: U.S. Bureau of Labor Statistics, International Labor Comparisons
 

Back to Top Back to Top

Labor force participation rates by sex


Labor force participation rates by sex, 2012
 

The labor force participation rate is the ratio of actual labor force (employed and unemployed) as a percent of the potential labor force (working age population). For more information, see the technical notes.

In 2012, labor force participation rates were higher for men than for women in all 16 countries compared. The lowest gender gaps were in Sweden and Canada, while the largest disparity in gender participation existed in Turkey, Mexico and the Republic of Korea.

Table 4. Labor force participation rates by sex
  2009 2010 2011 2012
Men Women Total Men Women Total Men Women Total Men Women Total

United States

72.0 59.2 65.4 71.2 58.6 64.7 70.5 58.1 64.1 70.2 57.7 63.7

Australia

73.3 60.1 66.7 73.2 59.8 66.4 73.1 60.0 66.5 72.6 59.9 66.2

Canada

72.0 62.5 67.2 71.8 62.4 67.0 71.7 62.2 66.8 71.4 62.1 66.7

France

61.1 50.9 55.8 61.0 51.0 55.8 60.7 50.9 55.6 61.1 51.2 55.9

Germany

65.3 52.1 58.5 65.1 52.4 58.6 65.6 53.2 59.2 65.5 53.2 59.2

Italy

59.4 38.2 48.4 59.0 38.2 48.1 58.7 38.4 48.1 59.2 39.7 49.0

Japan

71.3 48.1 59.3 70.9 48.1 59.1 70.5 47.7 58.7 69.8 47.7 58.4

Korea, Republic of

73.1 49.2 60.8 73.0 49.4 61.0 73.1 49.7 61.1 73.3 49.9 61.3

Mexico

76.7 41.1 57.9 b 76.5 b 40.7 b 57.6 76.4 41.2 57.8 76.7 42.0 58.4

Netherlands

72.9 59.8 66.2 b 71.1 b 58.4 b 64.6 70.3 58.3 64.2 70.9 58.9 64.8

New Zealand

74.6 62.2 68.2 74.4 62.1 68.1 74.6 62.5 68.4 74.0 62.6 68.2

South Africa

63.7 49.0 56.1 61.8 47.4 54.3 61.2 47.9 54.3 61.7 48.3 54.8

Spain

68.4 51.4 59.7 67.8 52.1 59.8 67.2 52.8 59.8 66.7 53.2 59.8

Sweden

68.9 60.7 64.8 69.3 60.3 64.7 69.3 61.0 65.1 69.2 61.3 65.2

Turkey

69.1 24.1 46.2 69.6 25.6 47.2 70.6 26.7 48.3 70.0 27.2 48.3

United Kingdom

70.2 56.8 63.4 69.8 56.8 63.2 69.7 57.0 63.2 69.8 57.2 63.4

Note:
(b) indicates a break in series; see country notes for break year and more information.

Source: U.S. Bureau of Labor Statistics, International Labor Comparisons
 

Back to Top Back to Top

Labor force participation rates by age


Labor force participation rates by age, 2012
 

In 2012, participation rates were highest among young adults between the ages of 20 to 24 in 6 of the 10 countries for which data were available. The United Kingdom had the highest participation rates for young adults while the Republic of Korea had the lowest rates for this age group.

Adults over 25 had higher participation rates than young adults and teens (15-19) in the other 4 countries compared, which included the Republic of Korea, Mexico, Spain and Turkey.

Table 5. Labor force participation rates by age
  2009 2010 2011 2012
15-19 20-24 25+ 15-19 20-24 25+ 15-19 20-24 25+ 15-19 20-24 25+

United States

37.5 72.9 67.0 34.9 71.4 66.5 34.1 71.3 65.8 34.3 70.9 65.4

Canada

58.6 76.7 66.9 57.2 76.2 66.9 57.2 76.1 66.6 55.4 75.2 66.6

Germany

31.3 70.3 59.6 30.3 69.5 59.7 30.3 70.3 60.3 28.4 68.9 60.5

Japan

14.9 68.3 61.4 14.5 68.1 61.3 14.0 68.0 60.8 14.2 67.5 60.5

Korea, Republic of

6.2 49.2 67.0 7.0 48.9 67.1 7.6 48.0 67.3 7.7 48.9 67.3

Mexico

29.0 60.1 64.3 b 28.9 b 60.6 b 63.8 28.7 60.1 63.9 28.4 60.5 64.6

New Zealand

51.0 73.4 69.7 47.8 73.2 69.8 45.6 74.6 70.2 44.3 75.0 70.0

Spain

24.3 65.9 61.1 21.2 64.0 61.5 19.2 62.6 61.7 17.3 60.6 61.9

Turkey

25.6 48.9 49.0 25.0 49.6 50.3 24.9 51.5 51.3 23.7 50.4 51.5

United Kingdom

46.4 82.0 63.1 44.4 81.9 63.0 43.4 81.6 63.1 44.0 81.8 63.2

Note:
(b) indicates a break in series; see country notes for break year and more information.
Lower age limits for teens vary by country, see technical notes.

Source: U.S. Bureau of Labor Statistics, International Labor Comparisons
 

Back to Top Back to Top

Employment-population ratios and composition of employment by sector


Employment-population ratios and composition of employment by sector, 1970-2012
 

The percentage of the working age population employed has remained between 50 and 65 percent in most countries covered over the past 40 years, but the share of the working age population employed in each sector has shifted over time. The share of the working age population employed in agriculture dropped by more than half in all countries covered except the Netherlands, and the share of the working age population employed in industry (manufacturing, mining, and construction) fell in all countries covered except the Republic of Korea and Turkey. In contrast, the share of the working age population employed in services increased in all countries covered, and by 2012, the share was nearly at or above 40 percent in the majority of countries covered.

Table 6. Employment shares by sector (in percent)
  1980 2012
Agriculture Industry Services Not Employed Agriculture Industry Services Not employed

United States

2.0 17.3 39.8 40.8 0.9 10.1 47.6 41.4

Australia

3.8 16.7 37.8 41.7 1.8 12.2 48.7 37.3

Canada

3.0 16.5 40.9 39.7 1.4 12.0 49.1 37.5

France

5.6 19.1 28.1 47.2 1.5 10.3 38.5 49.7

Germany

2.8 22.8 27.6 46.9 0.9 15.0 40.0 44.0

Italy

6.5 17.0 22.4 54.0 1.6 11.6 30.5 56.3

Japan

6.2 21.5 33.6 38.7 2.1 13.9 40.2 43.8

Korea, Republic of

19.0 16.0 20.9 44.1 3.7 14.2 41.5 40.6

Mexico

NA NA NA NA 7.5 13.0 34.9 44.5

Netherlands

2.7 15.5 33.9 47.9 1.7 9.9 49.7 38.6

New Zealand

NA NA NA NA 4.3 12.1 47.1 36.5

South Africa

NA NA NA NA 2.0 9.4 29.6 59.0

Spain

8.3 16.1 20.3 55.3 1.9 8.8 34.1 55.2

Sweden

3.7 20.7 41.3 34.4 1.3 11.2 47.6 39.9

Turkey

NA NA NA NA 10.2 11.4 22.7 55.8

United Kingdom

1.5 21.1 35.9 41.5 0.7 10.3 47.4 41.6

Note:
NA Not available
Details on employment, see technical notes.

Source: U.S. Bureau of Labor Statistics, International Labor Comparisons
 

Back to Top Back to Top

Working age population


Working age population, 2012
 

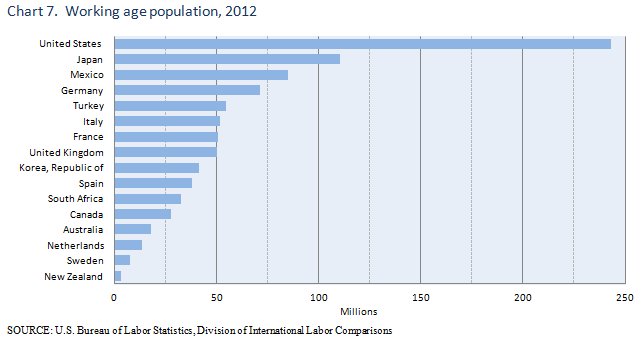
The working age population is the noninstitutional population generally 16 years and over, or the potential population available to work. For more information on working age population, see the technical notes.

The United States working age population was more than twice as large as the next largest country compared (Japan). Between 2006 and 2012, the working age population in the United States grew faster than in Japan and in all European countries compared, but grew more slowly than in the remaining countries.

Table 7. Working age population, in thousands, 1970-2012
  1970 1980 1990 2000 2006 2007 2008 2009 2010 2011 2012

United States

137,085 167,745 189,164 212,577 228,815 231,867 233,788 235,801 237,830 239,618 243,284

Australia

8,819 10,778 13,051 14,902 16,371 16,701 17,020 17,400 17,773 18,052 18,332

Canada

14,528 18,032 20,852 23,687 25,711 26,094 26,486 26,883 27,250 27,578 27,922

France

36,980 40,601 44,152 46,871 49,250 49,559 49,826 50,057 50,294 50,557 50,782

Germany

46,094 49,848 53,438 69,365 70,892 70,968 71,021 70,943 70,858 70,978 71,274

Italy

40,279 43,860 48,016 48,029 49,913 50,301 50,711 51,064 51,311 51,579 51,729

Japan

78,616 89,078 100,656 108,120 110,059 110,419 110,630 110,761 110,881 110,882 110,752

Korea, Republic of

17,468 24,463 30,887 36,186 38,762 39,170 39,598 40,092 40,590 41,052 41,582

Mexico

NA NA NA NA 74,282 75,538 76,761 78,314 b 81,969 83,399 85,023

Netherlands

NA 10,588 11,865 b 12,703 13,128 13,190 13,271 13,368 13,460 13,540 13,629

New Zealand

NA NA 2,612 2,938 3,252 3,297 3,335 3,379 3,427 3,465 3,492

South Africa

NA NA NA NA NA NA 30,967 31,494 32,007 32,494 32,959

Spain

NA 26,370 30,160 33,430 36,920 37,575 38,112 38,325 38,375 38,398 38,334

Sweden

6,106 6,441 6,823 7,043 7,312 7,387 7,467 7,547 7,620 7,682 7,732

Turkey

NA NA NA NA 49,174 49,994 50,772 51,686 52,541 53,593 54,724

United Kingdom

NA 42,582 44,717 46,085 48,197 48,611 48,998 49,355 49,726 50,095 50,473

Note:
NA Not available
(b) indicates a break in series; see country notes for break year and more information.

Source: U.S. Bureau of Labor Statistics, International Labor Comparisons
 

Back to Top Back to Top

Technical Notes

This report presents selected labor force statistics adjusted to U.S. concepts for 1970 onward for the United States and fifteen foreign countries: Australia, Canada, France, Germany, Italy, Japan, the Republic of Korea, Mexico, the Netherlands, New Zealand, South Africa, Spain, Sweden, Turkey, and the United Kingdom. For more information see technical notes or country notes.


UNEMPLOYMENT
In the United States, unemployment includes all persons who, during the reference week:

•  Had no employment,

•  Were available for work, except for temporary illness, and

•  Had actively sought work during the 4-week period ending with the reference week.

Active job search methods are those that have the potential to result in a job offer without further action on the part of the jobseeker. For example, sending a resume to an employer would be considered active, whereas simply reading newspaper advertisements would not.

Persons who were waiting to start a new job must have fulfilled these criteria to be considered unemployed. However, persons who were waiting to be recalled to a job from which they had been laid off need not have been looking for work.

The unemployment rate represents the percentage of persons in the labor force who are unemployed.


EMPLOYMENT
According to U.S. definitions, employment includes all persons who, during the reference week:

•  Worked at least 1 hour as paid employees, worked in their own business, profession, or on their own farm, or worked at least 15 hours as unpaid workers in a family-operated enterprise, and

•  All those who did not work but had jobs or businesses from which they were temporarily absent due to vacation, illness, bad weather, childcare problems, maternity or paternity leave, labor- management dispute, job training, or other family or personal reasons, regardless of whether they were paid for the time off or were seeking other jobs.

Each employed person is counted only once, even if he or she holds more than one job. For purposes of industry classification, multiple jobholders are counted in the job at which they worked the greatest number of hours during the reference week.

Persons whose only activity consisted of work around their own house (painting, repairing, or own home housework) or volunteer work for religious, charitable, and other organizations are excluded.


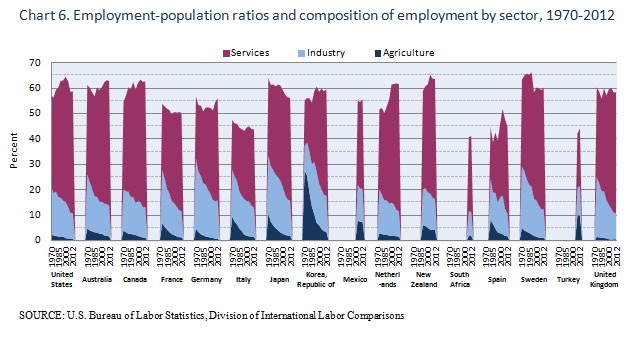
EMPLOYMENT BY SECTOR
Employment levels and distributions are shown for four broad economic sectors: agriculture, industry, manufacturing (a sub-sector of industry), and services.

Sectoral employment data are based on the North American Industry Classification System (NAICS) for the United States for 2000 onward, Canada for 1976 onward, and Mexico for 2005 onward. Data for Japan are based on the Japanese Standard Industrial Classification System (JSIC). For all other countries covered, sectoral employment data are based on the International Standard Industrial Classification (ISIC). Effects of the change in classification system are discussed in the country notes.


LABOR FORCE
The labor force is comprised of persons who are in employment and unemployment. All members of the working-age population are eligible for inclusion in the labor force, and those 16 and over (in the United States; age limits vary by country) who have a job or are actively looking for one are so classified. All others—those who have no job and are not looking for one—are counted as "not in the labor force."

The labor force participation rate represents the proportion of the working-age population that is in the labor force. Conversely, the inactivity rate represents the proportion of the working-age population that is not in the labor force. All persons in the civilian non-institutional working-age population who are neither employed nor unemployed are considered not in the labor force. Many who do not participate in the labor force are going to school or are retired. Family responsibilities keep others out of the labor force. Still others have a physical or mental disability which prevents them from participating in labor force activities.


WORKING-AGE POPULATION
The labor market statistics provided in this report describe the working-age population. In the United States, the working-age population is more specifically known as the civilian non- institutional working-age population:

•  "Civilian" refers to persons who are not on active duty in the military;Had no employment,

•  "Non-institutional" refers to persons who are not in institutions, such as prison inmates or those in a mental institution; and

•  "Working-age" refers to persons 16 years of age and older.


Last Modified Date: June 7, 2013