
An official website of the United States government
An official website of the United States government
The .gov means it's official.
Federal government websites often end in .gov or .mil. Before sharing sensitive information,
make sure you're on a federal government site.
The site is secure.
The
https:// ensures that you are connecting to the official website and that any
information you provide is encrypted and transmitted securely.
The healthcare and social assistance sector comprises establishments providing healthcare and social assistance for individuals. The sector includes both healthcare and social assistance because it is sometimes difficult to distinguish between the boundaries of these two activities. The industries in this sector are arranged on a continuum starting with those establishments providing medical care exclusively, continuing with those providing healthcare and social assistance, and finally finishing with those providing only social assistance.
The healthcare and social assistance sector consists of these subsectors: (1) Ambulatory Healthcare Services: NAICS 621; (2) Hospitals: NAICS 622; (3) Nursing and Residential Care Facilities: NAICS 623; (4) Social Assistance: NAICS 624.
Between 1993 and 2021 there were 96 major work stoppages in healthcare and social assistance sector. Almost all (88 percent) occurred in hospitals. Nursing and residential care services, and ambulatory healthcare services accounted for about five percent each. Finally, the social assistance industry comprised about 2 percent. (See chart 1).

| Industry (NAICS) | Major work stoppages |
|---|---|
|
Hospitals (622) |
85 |
|
Nursing and Residential Care Facilities (623) |
4 |
|
Ambulatory Healthcare Services (621) |
5 |
|
Social Assistance (624) |
2 |
|
Source: U.S. Bureau of Labor Statistics, Major Work Stoppages Program. |
|
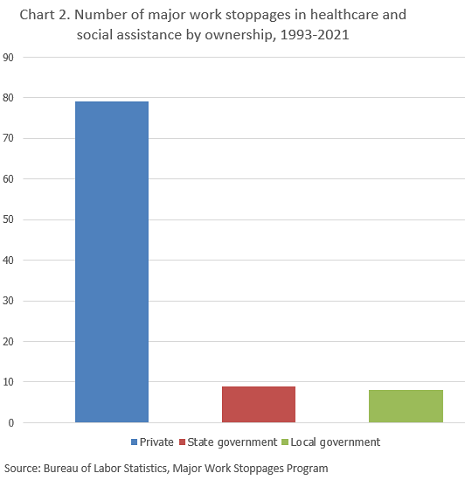
In oppose to educational services sector, where the vast majority of major work stoppages occurred at the state and local government level, the major work stoppages in healthcare and social assistance prevail in private sector by a great margin. (See chart 2).
| Ownership | Number of major work stoppages |
|---|---|
|
Private |
79 |
|
State government |
9 |
|
Local government |
8 |
|
Source: U.S. Bureau of Labor Statistics, Major Work Stoppages Program. |
|
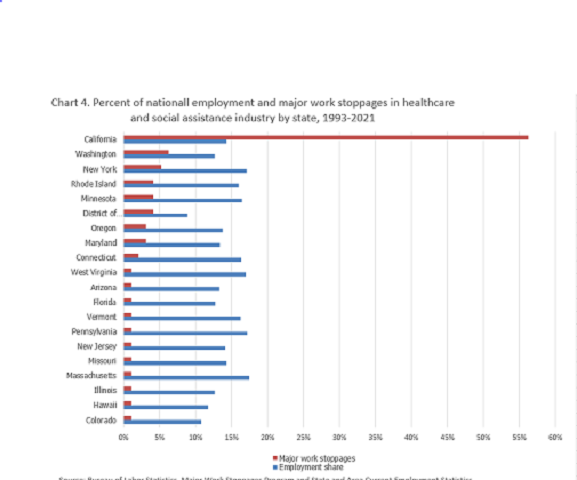
There were 20,230,000 workers employed in healthcare and social assistance in December 2021 nationwide. Within the healthcare and social assistance industry, California had the highest number of workers employed in 2021, 2,485,100 (14 percent). California had the highest number of major work stoppages (54) registered in the state since 1993 as well. Moreover, the number of major work stoppages in California accounted for 56 percent of the total number.

| State | Number of major work stoppages |
|---|---|
|
California |
54 |
|
Washington |
6 |
|
New York |
5 |
|
District of Columbia |
4 |
|
Minnesota |
4 |
|
Rhode Island |
4 |
|
Maryland |
3 |
|
Oregon |
3 |
|
Connecticut |
2 |
|
Arizona |
1 |
|
Colorado |
1 |
|
Florida |
1 |
|
Illinois |
1 |
|
Hawaii |
1 |
|
Pennsylvania |
1 |
|
Massachusetts |
1 |
|
Missouri |
1 |
|
New Jersey |
1 |
|
Vermont |
1 |
|
West Virginia |
1 |
|
Source: U.S. Bureau of Labor Statistics, Major Work Stoppages Program. |
|
Massachusetts has the largest share of national employment in healthcare and social assistance industry. California has the largest number of major work stoppages between 1993 and 2021.
| State | Employment share | Major work stoppages |
|---|---|---|
|
California |
14.3% | 56.3% |
|
Washington |
12.6% | 6.3% |
|
New York |
17.1% | 5.2% |
|
District of Columbia |
8.8% | 4.2% |
|
Minnesota |
16.5% | 4.2% |
|
Rhode Island |
16.0% | 4.2% |
|
Maryland |
13.3% | 3.1% |
|
Oregon |
13.8% | 3.1% |
|
Connecticut |
16.3% | 2.1% |
|
Colorado |
10.8% | 1.0% |
|
Hawaii |
11.8% | 1.0% |
|
Illinois |
12.7% | 1.0% |
|
Massachusetts |
17.5% | 1.0% |
|
Missouri |
14.3% | 1.0% |
|
New Jersey |
14.2% | 1.0% |
|
Pennsylvania |
17.2% | 1.0% |
|
Vermont |
16.2% | 1.0% |
|
Florida |
12.8% | 1.0% |
|
Arizona |
13.3% | 1.0% |
|
West Virginia |
17.0% | 1.0% |
|
Source: U.S. Bureau of Labor Statistics, Major Work Stoppages Program. |
||
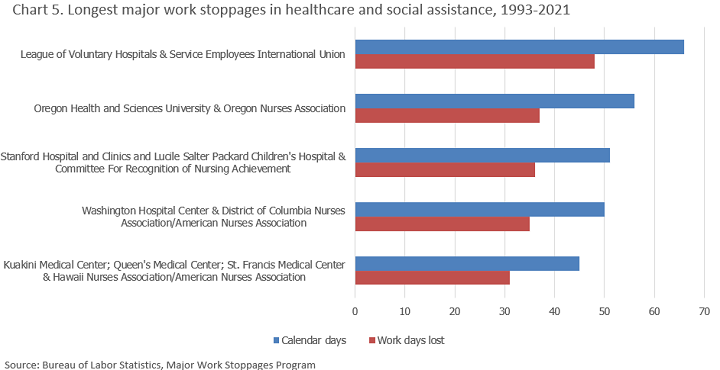
The longest work stoppage in the healthcare and social assistance industry between 1993 and 2021 occurred in 1996 in New York. Almost 6,000 workers participated in it. The number of work days lost was 48, while the overall length stretched through 66 calendar days. The Oregon Health and Sciences university in Portland, Oregon was the second longest with 37 lost work days and 56 calendar days. It was initiated by Oregon nurses association in 2001.
| Organization(s) involved | State(s) | Area(s) | Ownership | Union | Work stoppage beginning date | Work stoppage ending date | Calendar days | Work days lost | Number of workers |
|---|---|---|---|---|---|---|---|---|---|
|
League of Voluntary Hospitals & Service Employees International Union |
NY | New York | Private Industry | Service Employees International Union | 6/24/1996 | 8/28/1996 | 66 | 48 | 5,800 |
|
Oregon Health and Sciences University & Oregon Nurses Association |
OR | Portland | Private Industry | Oregon Nurses Association | 12/17/2001 | 2/10/2002 | 56 | 37 | 1,000 |
|
Stanford Hospital and Clinics and Lucile Salter Packard Children's Hospital & Committee For Recognition of Nursing Achievement |
CA | Palo Alto | Private Industry | Committee For Recognition of Nursing Achievement | 6/7/2000 | 7/27/2000 | 51 | 36 | 1,700 |
|
Washington Hospital Center & District of Columbia Nurses Association/American Nurses Association |
DC | Washington | Private Industry | District of Columbia Nurses Association/American Nurses Association | 9/20/2000 | 11/8/2000 | 50 | 35 | 1,000 |
|
Kuakini Medical Center; Queen's Medical Center; St. Francis Medical Center & Hawaii Nurses Association/American Nurses Association[1] |
HI | Honolulu | Private Industry | Hawaii Nurses Association/American Nurses Association | 12/3/2002 | 1/16/2003 | 45 | 31 | 1,400 |
|
[1] Stoppage began on 12/02/2002, but involved less than 1,000 workers until 12/03/2002. On 01/17/2003, the number of workers involved decreased below 1,000. Source: U.S. Bureau of Labor Statistics, Major Work Stoppages Program. |
|||||||||
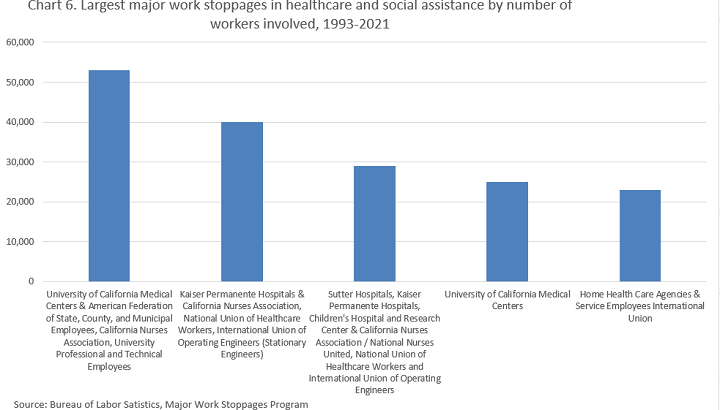
Three out of the five largest major work stoppages in the healthcare and social assistance between 1993 and 2021 happened in the private industry, however the largest one occurred in the state government. Also, four out of five happened in California. The largest number of workers involved in a major work stoppage was 53,000 in 2018. The dispute between the University of California medical center and the American Federation of State, County, and Municipal Employees, the California Nurses Association and the University Professional and Technical Employees led to a 3 day work stoppage.
| Organization(s) involved | State(s) | Area(s) | Ownership | Union | Work stoppage beginning date | Work stoppage ending date | Number of workers | Days idle, cumulative for this work stoppage | |
|---|---|---|---|---|---|---|---|---|---|
|
University of California Medical Centers & American Federation of State, County, and Municipal Employees, California Nurses Association, University Professional and Technical Employees |
CA | Statewide | State Government | American Federation of State, County, and Municipal Employees, California Nurses Association, University Professional and Technical Employees | 5/7/2018 | 5/9/2018 | 53,000 | 159,000 | |
|
Kaiser Permanente Hospitals & California Nurses Association, National Union of Healthcare Workers, International Union of Operating Engineers (Stationary Engineers) |
CA | Oakland | Private Industry | Service Employees International Union-United Healthcare Workers West (SEIU-UHW) Local 20 and Local 29, the California Nurses Association and National Union of Healthcare Workers (NUHW) | 11/18/2021 | 11/19/2021 | 40,000 | 40,000 | |
| Sutter Hospitals, Kaiser Permanente Hospitals, Children's Hospital and Research Center & California Nurses Association / National Nurses United, National Union of Healthcare Workers and International Union of Operating Engineers | CA | Statewide | Private Industry | California Nurses Association / National Nurses United, National Union of Healthcare Workers and International Union of Operating Engineers | 9/22/2011 | 9/22/2011 | 29,000 | 29,000 | |
|
University of California Medical Centers[1] |
CA | Statewide | State government | American Federation of State, County and Municipal Employees | 4/10/2019 | 11/13/2019 | 25,000 | 75,000 | |
|
Home Health Care Agencies & Service Employees International Union |
NY | New York | Private Industry | Service Employees International Union | 6/7/2004 | 6/9/2004 | 23,000 | 57,000 | |
|
[1] Estimates based on identified closings on 4/10, 5/16 and 11/13. Source: U.S. Bureau of Labor Statistics, Major Work Stoppages Program.NY |
|||||||||
The largest work stoppage in the healthcare and social assistance between 1993 and 2021 was registered in 1996 in New York with 272,000 days of cumulative idleness and 5,800 participants. The dispute between the League of Voluntary Hospitals and the Service Employees International Union lasted for 47 work days.
| Organization(s) involved | State(s) | Area(s) | Ownership | Union | Work stoppage beginning date | Work stoppage ending date | Number of workers | Days idle, cumulative for this work stoppage |
|---|---|---|---|---|---|---|---|---|
|
League of Voluntary Hospitals & Service Employees International Union |
NY | New York | Private Industry | Service Employees International Union | 6/24/1996 | 8/28/1996 | 5,800 | 272,600 |
|
University of California Medical Centers & American Federation of State, County, and Municipal Employees, California Nurses Association, University Professional and Technical Employees |
CA | Statewide | State Government | American Federation of State, County, and Municipal Employees, California Nurses Association, University Professional and Technical Employees | 5/7/2018 | 5/9/2018 | 53,000 | 159,000 |
|
Allina Health & Minnesota Nurses Association/National Nurses United |
MN | Minneapolis- St. Paul | Private Industry | Minnesota Nurses Association/National Nurses United | 9/5/2016 | 10/13/2016 | 4,800 | 129,600 |
|
University of California Medical Centers[1] |
CA | Statewide | State government | American Federation of State, County and Municipal Employees | 4/10/2019 | 11/13/2019 | 25,000 | 75,000 |
|
Connecticut nursing homes & Service Employees International Union[2] |
CT | Statewide | Private Industry | Service Employees International Union | 5/2/2001 | 5/24/2001 | 4,600 | 69,700 |
|
[1] Estimates based on identified closings on 4/10, 5/16 and 11/13. [2] Work stoppage started on 05/01/2001, and involve less than 1,000 workers until 05/02/2001. On 05/25/2001, the number decreased below 1,000 again. Source: U.S. Bureau of Labor Statistics, Major Work Stoppages Program. |
||||||||