An official website of the United States government
An official website of the United States government
The .gov means it's official.
Federal government websites often end in .gov or .mil. Before sharing sensitive information,
make sure you're on a federal government site.
The site is secure.
The
https:// ensures that you are connecting to the official website and that any
information you provide is encrypted and transmitted securely.
15-1739-SAN
Thursday, September 03, 2015
Employment increased in all 26 of California’s large counties from December 2013 to December 2014, the U.S. Bureau of Labor Statistics reported today. (Large counties are defined as those with employment of 75,000 or more as measured by 2013 annual average employment.) Regional Commissioner Richard J. Holden noted that employment increases ranged from 4.8 percent in San Mateo County to 0.3 percent in Kern County.
Nationally, employment advanced 2.2 percent from December 2013 to December 2014 as 319 of the 339 largest U.S. counties gained jobs. Weld, Colo., and Midland Texas, had the largest percentage increases in the country, each up 8.0 percent over the year. Atlantic, N.J., had the largest over-the-year decrease in employment, down 5.0 percent.
Among the 26 largest counties in California, employment was highest in Los Angeles (4,243,800) in December 2014, while Yolo had the smallest employment level (92,300). Together, California’s large counties accounted for 92.6 percent of total employment within the state. Nationwide, the 339 largest counties made up 72.1 percent of total U.S. employment.
Average weekly wages increased in 25 of the 26 largest counties in California from the fourth quarter of 2013 to the fourth quarter of 2014. Nineteen of these counties had annual wage gains at or above the national increase of 3.5 percent. San Mateo was the only county with a wage decrease, but by level had the highest average weekly wage in the state and the nation ($2,166). Ten additional large counties in the state had average weekly wages that exceeded the national average weekly wage of $1,035. (See table 1.)
Employment and wage levels (but not over-the-year changes) are also available for the 32 counties in California with employment below 75,000. All except one of these smaller counties had average weekly wages below the national average in the fourth quarter of 2014. (See table 2.)
Large county wage changesAverage weekly wages increased over the year in all but 1 of the 26 large counties in California in the fourth quarter of 2014. Yolo County’s 7.1-percent wage gain placed 10th among the nation’s 339 large counties. The over-the-year wage increase in Santa Clara County (6.8 percent) ranked 15th in the national ranking. Wage gains in three additional large counties—Tulare (6.2 percent, 23rd), Marin (5.9 percent, 29th), and Placer (5.8 percent, 31st)—placed in the top 10 percent of the national ranking.
Among the 339 largest U.S. counties, 332 recorded gains in average weekly wages. Benton, Ark., had the largest wage increase (9.9 percent). In contrast, seven large counties nationwide experienced over-the-year decreases in average weekly wages. San Mateo, Calif., had the largest over-the-year wage decline (-20.4 percent).
Large county average weekly wagesWeekly wages in 11 of the state’s 26 large counties were above the national average of $1,035 per week. In the fourth quarter of 2014, average weekly wages in San Mateo ($2,166), Santa Clara ($2,114), and San Francisco ($1,850) ranked in the top five nationally. In contrast, at $739 per week, wages in Tulare ranked 326th among the nation’s 339 largest counties.
Nationally, 95 large counties registered average weekly wages above the U.S. average of $1,035 in the fourth quarter of 2014. In addition to the three California counties mentioned above, New York, N.Y. ($2,138) and Suffolk, Mass. ($1,856) were in the top five nationwide.
Among the 244 counties with an average weekly wage below the U.S. average in the fourth quarter of 2014, Horry County, S.C., reported the lowest average weekly wage ($610), followed by the Texas counties of Cameron ($621) and Hidalgo ($641).
Average weekly wages in California’s smaller countiesAll except 1 of the 32 counties in California with employment below 75,000 had average weekly wages lower than the national average of $1,035. Among the smaller counties, Alpine County had the highest average weekly wage at $1,055. Mariposa County reported the lowest weekly wage among all counties in the state, averaging $648 in the fourth quarter of 2014. (See table 2.)
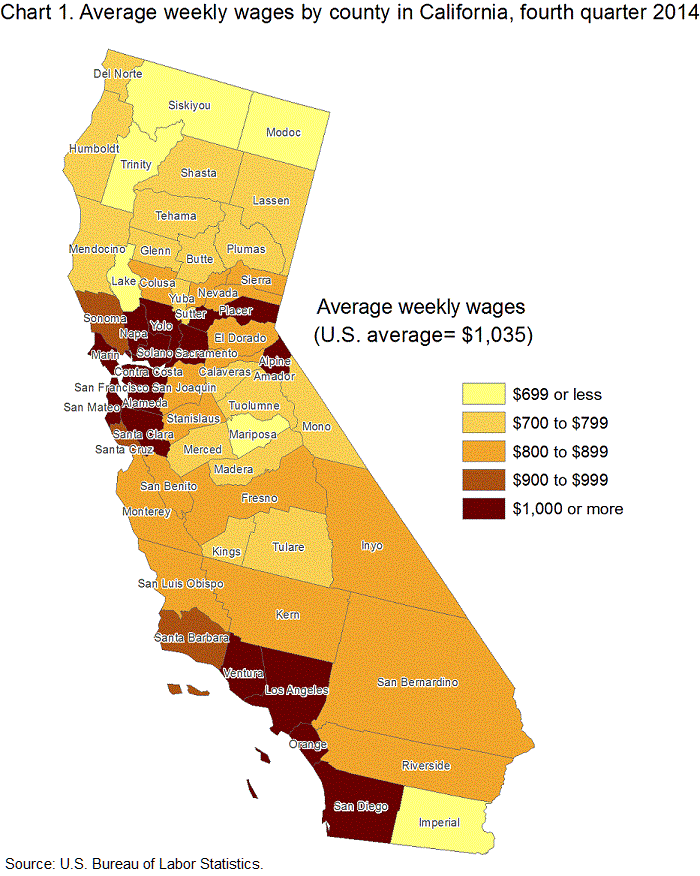
When all 58 counties in California were considered, 6 had wages below $700. Seventeen counties had average weekly wages ranging from $700 to $799, 16 had wages from $800 to $899, 3 had wages from $900 to $999, and 16 had wages at or above $1,000. (See chart 1.)
Additional statistics and other informationQCEW data for states have been included in this release in table 3. For additional information about quarterly employment and wages data, please read the Technical Note or visit www.bls.gov/cew.
Employment and Wages Annual Averages Online features comprehensive information by detailed industry on establishments, employment, and wages for the nation and all states. The 2013 edition of this publication, which was published in September 2014, contains selected data produced by Business Employment Dynamics (BED) on job gains and losses, as well as selected data from the first quarter 2014 version of the national news release. Tables and additional content from Employment and Wages Annual Averages 2013 are now available online at https://www.bls.gov/cew/publications/employment-and-wages-annual-averages/2013/home.htm. The 2014 edition of Employment and Wages Annual Averages Online will be available in September 2015.
The County Employment and Wages release for first quarter 2015 is scheduled to be released on Thursday, September 17, 2015.
Average weekly wage data by county are compiled under the Quarterly Census of Employment and Wages (QCEW) program, also known as the ES-202 program. The data are derived from summaries of employment and total pay of workers covered by state and federal unemployment insurance (UI) legislation and provided by State Workforce Agencies (SWAs). The 9.2 million employer reports cover 134.0 million full- and part-time workers. The average weekly wage values are calculated by dividing quarterly total wages by the average of the three monthly employment levels of those covered by UI programs. The result is then divided by 13, the number of weeks in a quarter. It is to be noted, therefore, that over-the-year wage changes for geographic areas may reflect shifts in the composition of employment by industry, occupation, and such other factors as hours of work. Thus, wages may vary among counties, metropolitan areas, or states for reasons other than changes in the average wage level. Data for all states, Metropolitan Statistical Areas (MSAs), counties, and the nation are available on the BLS Web site at www.bls.gov/cew/; however, data in QCEW press releases have been revised (see Technical Note below) and may not match the data contained on the Bureau’s Web site.
QCEW data are not designed as a time series. QCEW data are simply the sums of individual establishment records reflecting the number of establishments that exist in a county or industry at a point in time. Establishments can move in or out of a county or industry for a number of reasons–some reflecting economic events, others reflecting administrative changes.
The preliminary QCEW data presented in this release may differ from data released by the individual states as well as from the data presented on the BLS Web site. These potential differences result from the states’ continuing receipt, review and editing of UI data over time. On the other hand, differences between data in this release and the data found on the BLS Web site are the result of adjustments made to improve over-the-year comparisons. Specifically, these adjustments account for administrative (noneconomic) changes such as a correction to a previously reported location or industry classification. Adjusting for these administrative changes allows users to more accurately assess changes of an economic nature (such as a firm moving from one county to another or changing its primary economic activity) over a 12-month period. Currently, adjusted data are available only from BLS press releases.
Information in this release will be made available to sensory impaired individuals upon request. Voice phone: (202) 691-5200; Federal Relay Service: (800) 877-8339.
| Area | Employment | Average Weekly Wage (1) | |||||
|---|---|---|---|---|---|---|---|
| December 2014 (thousands) | Percent change, December 2013-14 (2) | National ranking by percent change (3) | Average weekly wage | National ranking by level (3) | Percent change, fourth quarter 2013-14 (2) | National ranking by percent change (3) | |
|
United States (4) |
139,204.8 | 2.2 | -- | $1,035 | -- | 3.5 | -- |
|
California |
16,068.5 | 2.6 | -- | 1,209 | 6 | 2.9 | 41 |
|
Alameda, Calif. |
708.7 | 2.8 | 104 | 1,319 | 24 | 4.4 | 81 |
|
Contra Costa, Calif. |
344.1 | 1.8 | 174 | 1,215 | 43 | 2.1 | 278 |
|
Fresno, Calif. |
349.4 | 0.6 | 284 | 808 | 294 | 4.9 | 50 |
|
Kern, Calif. |
306.9 | 0.3 | 303 | 873 | 239 | 2.7 | 235 |
|
Los Angeles, Calif. |
4,243.8 | 1.6 | 197 | 1,201 | 49 | 3.5 | 168 |
|
Marin, Calif. |
112.0 | 0.6 | 284 | 1,280 | 27 | 5.9 | 29 |
|
Monterey, Calif. |
159.4 | 1.9 | 162 | 851 | 261 | 3.7 | 143 |
|
Orange, Calif. |
1,506.0 | 2.6 | 112 | 1,162 | 55 | 4.3 | 87 |
|
Placer, Calif. |
144.6 | 3.4 | 71 | 1,034 | 96 | 5.8 | 31 |
|
Riverside, Calif. |
641.2 | 3.5 | 66 | 803 | 301 | 4.0 | 113 |
|
Sacramento, Calif. |
620.7 | 2.2 | 140 | 1,095 | 68 | 2.7 | 235 |
|
San Bernardino, Calif. |
682.3 | 4.4 | 25 | 852 | 258 | 3.5 | 168 |
|
San Diego, Calif. |
1,359.7 | 1.9 | 162 | 1,138 | 58 | 2.6 | 244 |
|
San Francisco, Calif. |
659.1 | 4.4 | 25 | 1,850 | 5 | 4.9 | 50 |
|
San Joaquin, Calif. |
217.7 | 2.5 | 118 | 835 | 273 | 2.5 | 248 |
|
San Luis Obispo, Calif. |
109.4 | 1.8 | 174 | 837 | 270 | 3.7 | 143 |
|
San Mateo, Calif. |
385.0 | 4.8 | 18 | 2,166 | 1 | -20.4 | 339 |
|
Santa Barbara, Calif. |
186.5 | 2.5 | 118 | 981 | 138 | 4.9 | 50 |
|
Santa Clara, Calif. |
999.3 | 3.6 | 57 | 2,114 | 3 | 6.8 | 15 |
|
Santa Cruz, Calif. |
94.6 | 3.7 | 51 | 926 | 187 | 5.0 | 46 |
|
Solano, Calif. |
129.6 | 1.7 | 183 | 1,026 | 104 | 0.9 | 322 |
|
Sonoma, Calif. |
192.0 | 0.9 | 259 | 952 | 162 | 4.2 | 99 |
|
Stanislaus, Calif. |
170.3 | 2.5 | 118 | 832 | 277 | 3.9 | 125 |
|
Tulare, Calif. |
146.5 | 0.7 | 272 | 739 | 326 | 6.2 | 23 |
|
Ventura, Calif. |
317.5 | 0.9 | 259 | 1,025 | 107 | 5.0 | 46 |
|
Yolo, Calif. |
92.3 | 1.2 | 227 | 1,092 | 70 | 7.1 | 10 |
|
Footnotes: |
|||||||
|
Note: Data are preliminary. Covered employment and wages includes workers covered by Unemployment Insurance (UI) and Unemployment Compensation for Federal Employees (UCFE) programs. |
|||||||
| Area | Employment December 2014 | Average Weekly Wage (1) |
|---|---|---|
|
United States (2) |
139,204,840 | $1,035 |
|
California |
16,068,487 | 1,209 |
|
Alameda |
708,653 | 1,319 |
|
Alpine |
536 | 1,055 |
|
Amador |
11,443 | 816 |
|
Butte |
76,994 | 757 |
|
Calaveras |
8,238 | 708 |
|
Colusa |
7,894 | 851 |
|
Contra Costa |
344,074 | 1,215 |
|
Del Norte |
7,842 | 703 |
|
El Dorado |
50,559 | 899 |
|
Fresno |
349,436 | 808 |
|
Glenn |
8,188 | 734 |
|
Humboldt |
46,096 | 724 |
|
Imperial |
64,035 | 685 |
|
Inyo |
7,279 | 808 |
|
Kern |
306,904 | 873 |
|
Kings |
43,632 | 795 |
|
Lake |
14,985 | 661 |
|
Lassen |
10,472 | 793 |
|
Los Angeles |
4,243,837 | 1,201 |
|
Madera |
46,645 | 782 |
|
Marin |
111,966 | 1,280 |
|
Mariposa |
4,824 | 648 |
|
Mendocino |
31,341 | 704 |
|
Merced |
73,806 | 740 |
|
Modoc |
2,345 | 678 |
|
Mono |
6,574 | 717 |
|
Monterey |
159,400 | 851 |
|
Napa |
70,226 | 1,003 |
|
Nevada |
29,349 | 842 |
|
Orange |
1,505,987 | 1,162 |
|
Placer |
144,598 | 1,034 |
|
Plumas |
5,752 | 784 |
|
Riverside |
641,238 | 803 |
|
Sacramento |
620,734 | 1,095 |
|
San Benito |
15,008 | 851 |
|
San Bernardino |
682,327 | 852 |
|
San Diego |
1,359,701 | 1,138 |
|
San Francisco |
659,074 | 1,850 |
|
San Joaquin |
217,711 | 835 |
|
San Luis Obispo |
109,429 | 837 |
|
San Mateo |
384,952 | 2,166 |
|
Santa Barbara |
186,503 | 981 |
|
Santa Clara |
999,316 | 2,114 |
|
Santa Cruz |
94,644 | 926 |
|
Shasta |
62,168 | 784 |
|
Sierra |
546 | 827 |
|
Siskiyou |
12,499 | 699 |
|
Solano |
129,596 | 1,026 |
|
Sonoma |
192,046 | 952 |
|
Stanislaus |
170,313 | 832 |
|
Sutter |
27,062 | 751 |
|
Tehama |
16,407 | 763 |
|
Trinity |
2,491 | 677 |
|
Tulare |
146,544 | 739 |
|
Tuolumne |
16,834 | 783 |
|
Ventura |
317,505 | 1,025 |
|
Yolo |
92,333 | 1,092 |
|
Yuba |
16,213 | 887 |
|
Footnotes |
||
|
NOTE: Includes workers covered by Unemployment Insurance (UI) and Unemployment Compensation for Federal Employees (UCFE) programs. Data are preliminary. |
||
| State | Employment | Average weekly wage (1) | ||||
|---|---|---|---|---|---|---|
| December 2014 (thousands) | Percent change, December 2013-14 | Average weekly wage | National ranking by level | Percent change, fourth quarter 2013-14 | National ranking by percent change | |
|
United States (2) |
139,204.8 | 2.2 | $1,035 | -- | 3.5 | -- |
|
Alabama |
1,891.4 | 1.3 | 881 | 35 | 3.5 | 31 |
|
Alaska |
317.6 | 0.8 | 1,063 | 13 | 4.0 | 20 |
|
Arizona |
2,630.8 | 2.2 | 926 | 25 | 2.3 | 47 |
|
Arkansas |
1,180.5 | 2.2 | 807 | 47 | 4.5 | 5 |
|
California |
16,068.5 | 2.6 | 1,209 | 6 | 2.9 | 41 |
|
Colorado |
2,478.0 | 3.9 | 1,066 | 12 | 4.1 | 17 |
|
Connecticut |
1,681.2 | 1.2 | 1,278 | 4 | 2.7 | 45 |
|
Delaware |
433.0 | 2.9 | 1,049 | 16 | 1.5 | 51 |
|
District of Columbia |
736.9 | 0.9 | 1,696 | 1 | 3.7 | 28 |
|
Florida |
8,009.6 | 3.5 | 911 | 28 | 3.1 | 40 |
|
Georgia |
4,131.9 | 3.7 | 958 | 21 | 3.8 | 25 |
|
Hawaii |
638.3 | 0.7 | 908 | 29 | 4.2 | 15 |
|
Idaho |
650.7 | 2.5 | 782 | 50 | 4.0 | 20 |
|
Illinois |
5,844.1 | 1.4 | 1,089 | 8 | 2.8 | 42 |
|
Indiana |
2,946.5 | 1.7 | 846 | 41 | 3.9 | 22 |
|
Iowa |
1,527.6 | 1.1 | 870 | 38 | 4.3 | 11 |
|
Kansas |
1,377.2 | 1.3 | 855 | 39 | 2.6 | 46 |
|
Kentucky |
1,852.2 | 1.8 | 836 | 43 | 4.1 | 17 |
|
Louisiana |
1,954.0 | 2.1 | 923 | 26 | 3.8 | 25 |
|
Maine |
592.7 | 0.9 | 826 | 44 | 5.1 | 4 |
|
Maryland |
2,590.3 | 1.3 | 1,113 | 7 | 3.5 | 31 |
|
Massachusetts |
3,415.6 | 2.2 | 1,315 | 3 | 4.5 | 5 |
|
Michigan |
4,158.9 | 2.1 | 984 | 20 | 3.3 | 37 |
|
Minnesota |
2,762.9 | 1.4 | 1,024 | 17 | 3.6 | 30 |
|
Mississippi |
1,118.6 | 1.0 | 747 | 51 | 2.3 | 47 |
|
Missouri |
2,709.8 | 1.5 | 891 | 32 | 3.4 | 34 |
|
Montana |
442.2 | 0.5 | 794 | 48 | 4.5 | 5 |
|
Nebraska |
958.1 | 1.4 | 837 | 42 | 5.2 | 3 |
|
Nevada |
1,229.6 | 4.2 | 899 | 30 | 1.6 | 50 |
|
New Hampshire |
638.0 | 1.4 | 1,081 | 10 | 6.3 | 2 |
|
New Jersey |
3,933.6 | 1.3 | 1,211 | 5 | 2.0 | 49 |
|
New Mexico |
808.4 | 1.3 | 850 | 40 | 4.4 | 10 |
|
New York |
9,067.6 | 2.0 | 1,321 | 2 | 4.3 | 11 |
|
North Carolina |
4,141.8 | 2.4 | 890 | 33 | 3.4 | 34 |
|
North Dakota |
454.8 | 4.5 | 1,050 | 15 | 7.1 | 1 |
|
Ohio |
5,264.3 | 1.6 | 922 | 27 | 3.9 | 22 |
|
Oklahoma |
1,614.3 | 2.1 | 876 | 36 | 2.8 | 42 |
|
Oregon |
1,755.4 | 3.2 | 928 | 23 | 3.8 | 25 |
|
Pennsylvania |
5,716.5 | 1.2 | 1,013 | 18 | 3.7 | 28 |
|
Rhode Island |
471.5 | 1.9 | 1,003 | 19 | 4.5 | 5 |
|
South Carolina |
1,931.4 | 2.9 | 817 | 46 | 3.2 | 39 |
|
South Dakota |
412.5 | 1.3 | 791 | 49 | 4.2 | 15 |
|
Tennessee |
2,822.1 | 2.4 | 927 | 24 | 3.5 | 31 |
|
Texas |
11,662.7 | 3.7 | 1,070 | 11 | 4.3 | 11 |
|
Utah |
1,324.2 | 3.0 | 872 | 37 | 4.3 | 11 |
|
Vermont |
311.0 | 0.7 | 882 | 34 | 4.1 | 17 |
|
Virginia |
3,691.4 | 0.6 | 1,057 | 14 | 2.8 | 42 |
|
Washington |
3,069.7 | 3.2 | 1,082 | 9 | 4.5 | 5 |
|
West Virginia |
712.0 | 0.1 | 818 | 45 | 3.3 | 37 |
|
Wisconsin |
2,789.3 | 1.3 | 894 | 31 | 3.4 | 34 |
|
Wyoming |
283.6 | 1.5 | 952 | 22 | 3.9 | 22 |
|
Puerto Rico |
944.2 | -1.5 | 556 | (3) | 0.7 | (3) |
|
Virgin Islands |
38.5 | -0.3 | 746 | (3) | -1.2 | (3) |
|
Footnotes: |
||||||
|
Note: Data are preliminary. Covered employment and wages includes workers covered by Unemployment Insurance (UI) and Unemployment Compensation for Federal Employees (UCFE) programs. |
||||||
Last Modified Date: Thursday, September 03, 2015