An official website of the United States government
An official website of the United States government
The .gov means it's official.
Federal government websites often end in .gov or .mil. Before sharing sensitive information,
make sure you're on a federal government site.
The site is secure.
The
https:// ensures that you are connecting to the official website and that any
information you provide is encrypted and transmitted securely.
21-209-CHI
Friday, March 19, 2021
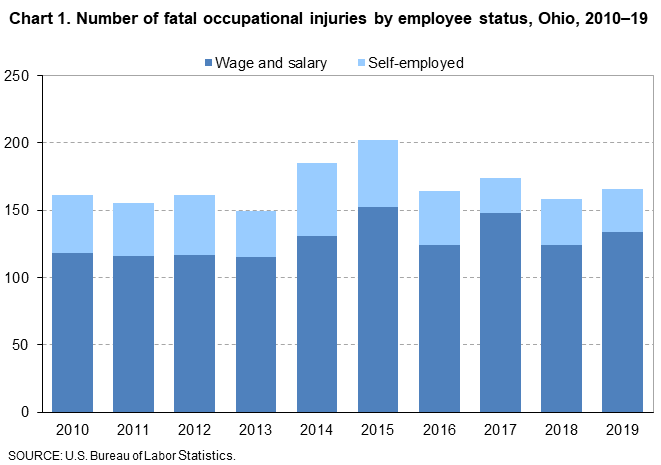
Fatal work injuries totaled 166 in 2019 for Ohio, the U.S. Bureau of Labor Statistics reported today. Regional Commissioner Jason Palmer noted that the number of work-related fatalities in Ohio was up from the previous year. (See chart 1.) Fatal occupational injuries in the state have ranged from a high of 222 in 1999 to a low of 137 in 2009.
Nationwide, a total of 5,333 fatal work injuries were recorded in 2019, a 2-percent increase from the 5,250 in 2018, according to the results from the Census of Fatal Occupational Injuries (CFOI) program. The 5,333 fatal occupational injuries in 2019 represents the largest annual number since 2007.
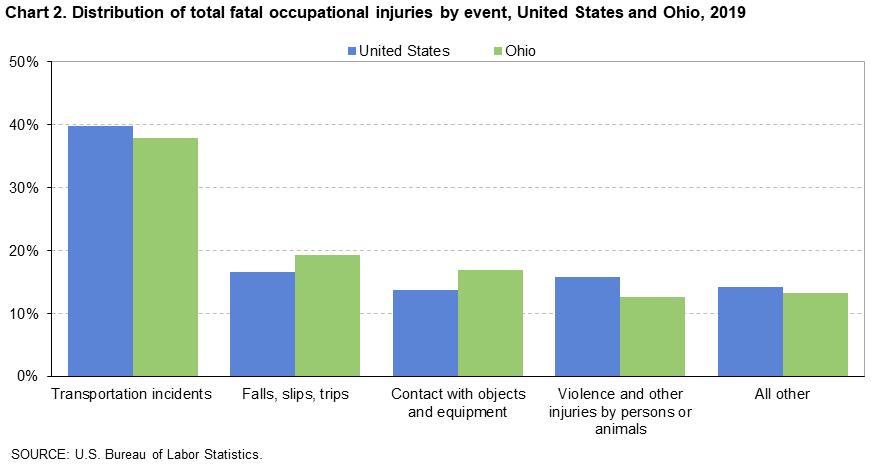
Fatal event or exposureIn Ohio, transportation incidents resulted in 63 fatal work injuries, and falls, slips, and trips accounted for 32 fatalities. These two major categories accounted for 57 percent of all workplace fatalities in the state. (See table 1.) Worker deaths from transportation incidents were up from 60 over the year, and worker fatalities due to falls, slips, and trips were up from 22.
Contact with objects or equipment was the third-most frequent fatal work event with 28 fatalities compared to 27 in the prior year. Violence and other injuries by persons or animals resulted in 21 work-related deaths, down from 25 in 2018.
Nationally, transportation incidents were the most frequent fatal workplace event in 2019, accounting for 40 percent of fatal work injuries. (See chart 2.) Falls, slips, and trips was the second-most common fatal event (17 percent), followed by violence and other injuries by persons or animals (16 percent).
The private transportation and warehousing industry had the highest number of fatalities in Ohio with 24. (See table 2.) Transportation incidents resulted in 22 of the 24 fatalities in the industry. The truck transportation sector accounted for 18 of the 24 workplace fatalities in the transportation and warehousing industry.
The private agriculture, forestry, fishing, and hunting industry had 18 workplace fatalities. The crop production sector accounted for nine, or 50 percent, of the fatal injuries in this industry.
OccupationThe transportation and material moving occupational group had the highest number of workplace fatalities with 50. (See table 3.) Motor vehicle operators accounted for 34 of the 50 fatalities among transportation and material moving workers. The construction and extraction occupational group had the second-highest number of workplace fatalities with 30. Construction trades workers suffered 26 of the work-related deaths within the construction and extraction group.
Additional highlightsMen accounted for 92 percent of the work-related fatalities in Ohio, similar to the national share. (See table 4.) Transportation incidents made up 35 percent of the fatalities for men in Ohio.
White non-Hispanics accounted for 84 percent of those who died from a workplace injury. Nationwide, this group accounted for 62 percent of work-related deaths.
Workers 25-54 years old accounted for 50 percent of the state’s work-related fatalities in 2019, compared to 55 percent of on-the-job fatalities nationally.
Of the 166 fatal work injuries in Ohio, 81 percent worked for wages and salaries; the remainder were self-employed. The most frequent fatal event for wage and salary workers was transportation incidents. For self-employed workers, both transportation incidents and contact with objects and equipment were the most frequent fatal events.
Information in this release incorporates revisions to both the North American Industry Classification System (NAICS) and the Standard Occupational Classification codes (SOC). Comparison of data for 2019 to prior years should be done with caution due to these changes, and thus analysis in this release is limited to 2019 for industries and occupations. More information on NAICS can be found at www.bls.gov/bls/naics.htm. More information on SOC can be found at www.bls.gov/soc/2018/home.htm.
Data in this news release are for reference year 2019. No changes in collection procedures or outputs were necessary due to COVID-19. Additional information is available at www.bls.gov/covid19/effects-of-covid-19-on-workplace-injuries-and-illnesses-compensation-and-occupational-requirements.htm.
Background of the program. The Census of Fatal Occupational Injuries (CFOI), part of the Bureau of Labor Statistics (BLS) Occupational Safety and Health Statistics (OSHS) program, is a count of all fatal work injuries occurring in the U.S. during the calendar year. The CFOI uses a variety of state, federal, and independent data sources to identify, verify, and describe fatal work injuries. This ensures counts are as complete and accurate as possible. For the 2019 national data, over 25,100 unique source documents were reviewed as part of the data collection process. For technical information and definitions for the CFOI, see the BLS Handbook of Methods on the BLS website at www.bls.gov/opub/hom/cfoi/home.htm and the CFOI definitions at www.bls.gov/iif/oshcfdef.htm.
Federal/State agency coverage. The CFOI includes data for all fatal work injuries, some of which may be outside the scope of other agencies or regulatory coverage. Comparisons between CFOI counts and those released by other agencies should account for the different coverage requirements and definitions used by each agency. For more information on the scope of CFOI, see www.bls.gov/iif/cfoiscope.htm and www.bls.gov/opub/hom/cfoi/concepts.htm.
Acknowledgments. BLS thanks the Ohio BWC Division of Safety and Hygiene for their efforts in collecting accurate, comprehensive, and useful data on fatal work injuries. BLS also appreciates the efforts of all federal, state, local, and private sector entities that provided source documents used to identify fatal work injuries. Among these agencies are the Occupational Safety and Health Administration; the National Transportation Safety Board; the U.S. Coast Guard; the Mine Safety and Health Administration; the Office of Workers’ Compensation Programs (Federal Employees' Compensation and Longshore and Harbor Workers' Compensation divisions); the Federal Railroad Administration; the National Highway Traffic Safety Administration; state vital statistics registrars, coroners, and medical examiners; state departments of health, labor, and industrial relations and workers' compensation agencies; state and local police departments; and state farm bureaus.
Information in this release will be made available to sensory impaired individuals upon request. Voice phone: (202) 691-5200; Federal Relay Service: (800) 877-8339.
| Event or exposure (1) | 2018 | 2019 | |
|---|---|---|---|
| Number | Number | Percent | |
Total | 158 | 166 | 100 |
Violence and other injuries by persons or animals | 25 | 21 | 13 |
Intentional injury by person | 25 | 19 | 11 |
Intentional injury by other person | 16 | 14 | 8 |
Shooting by other person--intentional | 14 | 9 | 5 |
Stabbing, cutting, slashing, piercing | -- | 2 | 1 |
Self-inflicted injury--intentional | 9 | 5 | 3 |
Hanging, strangulation, asphyxiation--intentional self-harm | 5 | 4 | 2 |
Transportation incidents | 60 | 63 | 38 |
Aircraft incidents | 2 | 11 | 7 |
Other in-flight crash | 2 | 9 | 5 |
Other in-flight crash due to mechanical failure | -- | 2 | 1 |
Other in-flight crash into structure, object, or ground | 2 | 7 | 4 |
Pedestrian vehicular incident | 13 | 11 | 7 |
Pedestrian struck by vehicle in work zone | 4 | 3 | 2 |
Pedestrian struck by forward-moving vehicle in work zone | 3 | 3 | 2 |
Pedestrian struck by vehicle on side of road | -- | 1 | 1 |
Pedestrian struck by forward-moving vehicle on side of road | -- | 1 | 1 |
Pedestrian struck by vehicle in nonroadway area | 6 | 5 | 3 |
Pedestrian struck by forward-moving vehicle in nonroadway area | -- | 3 | 2 |
Roadway incidents involving motorized land vehicle | 39 | 33 | 20 |
Roadway collision with other vehicle | 26 | 20 | 12 |
Roadway collision--moving in same direction | 10 | 4 | 2 |
Roadway collision--moving in opposite directions, oncoming | 5 | 9 | 5 |
Roadway collision--moving perpendicularly | 11 | 5 | 3 |
Roadway collision with object other than vehicle | 10 | 11 | 7 |
Vehicle struck object or animal on side of roadway | 10 | 7 | 4 |
Nonroadway incident involving motorized land vehicles | 5 | 8 | 5 |
Nonroadway noncollision incident | 5 | 6 | 4 |
Jack-knifed or overturned, nonroadway | 4 | 5 | 3 |
Fires and explosions | 1 | -- | -- |
Falls, slips, trips | 22 | 32 | 19 |
Falls to lower level | 19 | 24 | 14 |
Fall through surface or existing opening | 3 | 4 | 2 |
Other fall to lower level | 15 | 20 | 12 |
Other fall to lower level 6 to 10 feet | -- | 3 | 2 |
Other fall to lower level 11 to 15 feet | -- | 7 | 4 |
Other fall to lower level 26 to 30 feet | -- | 1 | 1 |
Exposure to harmful substances or environments | 22 | 21 | 13 |
Exposure to electricity | 4 | 6 | 4 |
Direct exposure to electricity | -- | 3 | 2 |
Indirect exposure to electricity | 3 | 3 | 2 |
Indirect exposure to electricity, greater than 220 volts | 3 | 3 | 2 |
Exposure to temperature extremes | -- | 3 | 2 |
Exposure to environmental heat | -- | 3 | 2 |
Exposure to other harmful substances | 17 | 12 | 7 |
Nonmedical use of drugs or alcohol--unintentional overdose | 15 | 12 | 7 |
Contact with objects and equipment | 27 | 28 | 17 |
Struck by object or equipment | 20 | 15 | 9 |
Struck by powered vehicle--nontransport | 6 | 6 | 4 |
Struck by other falling powered vehicle | -- | 1 | 1 |
Struck by falling object or equipment--other than powered vehicle | 12 | 8 | 5 |
Struck by object falling from vehicle or machinery--other than vehicle part | 7 | 3 | 2 |
Caught in or compressed by equipment or objects | 5 | 5 | 3 |
Struck, caught, or crushed in collapsing structure, equipment, or material | -- | 8 | 5 |
Overexertion and bodily reaction | -- | -- | -- |
Footnotes: | |||
NOTE: Data for all years are final. Totals for major categories may include subcategories not shown separately. For complete information on how the data are coded and presented see our definitions page at https://www.bls.gov/iif/oshcfdef.htm. Dashes indicate no data reported or data that do not meet publication criteria. CFOI fatal injury counts exclude illness-related deaths unless precipitated by an injury event. | |||
| Industry (1) | Number | Percent |
|---|---|---|
Total | 166 | 100 |
Private industry (2) | 155 | 93 |
Goods producing | -- | -- |
Natural resources and mining | 18 | 11 |
Agriculture, forestry, fishing and hunting | 18 | 11 |
Crop production | 9 | 5 |
Oilseed and grain farming | 6 | 4 |
Corn farming | 3 | 2 |
Animal production and aquaculture | 6 | 4 |
Cattle ranching and farming | 3 | 2 |
Dairy cattle and milk production | 3 | 2 |
Construction | -- | -- |
Service providing (3) | -- | -- |
Trade, transportation, and utilities | 46 | 28 |
Utilities | 1 | 1 |
Utilities | 1 | 1 |
Electric power generation, transmission and distribution | 1 | 1 |
Electric power generation | 1 | 1 |
Fossil fuel electric power generation | 1 | 1 |
Wholesale trade | 11 | 7 |
Merchant wholesalers, durable goods | 4 | 2 |
Machinery, equipment, and supplies merchant wholesalers | 1 | 1 |
Industrial machinery and equipment merchant wholesalers | 1 | 1 |
Merchant wholesalers, nondurable goods | 7 | 4 |
Retail trade | 10 | 6 |
Motor vehicle and parts dealers | 2 | 1 |
Automobile dealers | 1 | 1 |
Automotive parts, accessories, and tire stores | 1 | 1 |
Automotive parts and accessories stores | 1 | 1 |
Building material and garden equipment and supplies dealers | -- | -- |
Building material and supplies dealers | -- | -- |
Home centers | 1 | 1 |
Food and beverage stores | 3 | 2 |
Grocery stores | 3 | 2 |
Clothing and clothing accessories stores | 1 | 1 |
Clothing stores | 1 | 1 |
Transportation and warehousing | 24 | 14 |
Truck transportation | 18 | 11 |
General freight trucking | 11 | 7 |
General freight trucking, long-distance | 8 | 5 |
General freight trucking, long-distance, truckload | 4 | 2 |
Specialized freight trucking | 6 | 4 |
Specialized freight (except used goods) trucking, long-distance | 4 | 2 |
Financial activities | -- | -- |
Real estate and rental and leasing | 3 | 2 |
Professional and business services | 10 | 6 |
Professional, scientific, and technical services | 4 | 2 |
Professional, scientific, and technical services | 4 | 2 |
Management, scientific, and technical consulting services | 1 | 1 |
Environmental consulting services | 1 | 1 |
Other professional, scientific, and technical services | 1 | 1 |
Photographic services | 1 | 1 |
Photography studios, portrait | 1 | 1 |
Administrative and support and waste management and remediation services | 6 | 4 |
Administrative and support services | 6 | 4 |
Educational and health services | -- | -- |
Leisure and hospitality | 13 | 8 |
Arts, entertainment, and recreation | 4 | 2 |
Accommodation and food services | 9 | 5 |
Food services and drinking places | 9 | 5 |
Drinking places (alcoholic beverages) | 2 | 1 |
Drinking places (alcoholic beverages) | 2 | 1 |
Restaurants and other eating places | 6 | 4 |
Restaurants and other eating places | 6 | 4 |
Limited-service restaurants | 2 | 1 |
Other services, except public administration | 6 | 4 |
Other services, except public administration | 6 | 4 |
Repair and maintenance | 5 | 3 |
Automotive repair and maintenance | 4 | 2 |
Electronic and precision equipment repair and maintenance | 1 | 1 |
Electronic and precision equipment repair and maintenance | 1 | 1 |
Personal and laundry services | 1 | 1 |
Drycleaning and laundry services | 1 | 1 |
Coin-operated laundries and drycleaners | 1 | 1 |
Government (4) | 11 | 7 |
Federal government | -- | -- |
State government | -- | -- |
Local government | 9 | 5 |
Footnotes: | ||
NOTE: Data for all years are final. Totals for major categories may include subcategories not shown separately. For complete information on how the data are coded and presented see our definitions page at https://www.bls.gov/iif/oshcfdef.htm. Dashes indicate no data reported or data that do not meet publication criteria. CFOI fatal injury counts exclude illness-related deaths unless precipitated by an injury event. | ||
| Occupation (1) | Number | Percent |
|---|---|---|
Total | 166 | 100 |
Management occupations | 10 | 6 |
Top executives | 1 | 1 |
Chief executives | 1 | 1 |
Chief executives | 1 | 1 |
Other management occupations | 9 | 5 |
Business and financial operations occupations | -- | -- |
Computer and mathematical occupations | -- | -- |
Architecture and engineering occupations | -- | -- |
Life, physical, and social science occupations | -- | -- |
Community and social service occupations | -- | -- |
Legal occupations | -- | -- |
Educational instruction and library occupations | -- | -- |
Arts, design, entertainment, sports, and media occupations | -- | -- |
Healthcare practitioners and technical occupations | 5 | 3 |
Healthcare diagnosing or treating practitioners | 5 | 3 |
Healthcare support occupations | -- | -- |
Protective service occupations | 6 | 4 |
Firefighting and prevention workers | 1 | 1 |
Law enforcement workers | 3 | 2 |
Police officers | 3 | 2 |
Food preparation and serving related occupations | 8 | 5 |
Food and beverage serving workers | 1 | 1 |
Fast food and counter workers | 1 | 1 |
Fast food and counter workers | 1 | 1 |
Other food preparation and serving related workers | 3 | 2 |
Miscellaneous food preparation and serving related workers | 3 | 2 |
Building and grounds cleaning and maintenance occupations | 7 | 4 |
Supervisors of building and grounds cleaning and maintenance workers | 1 | 1 |
First-line supervisors of building and grounds cleaning and maintenance workers | 1 | 1 |
First-line supervisors of housekeeping and janitorial workers | 1 | 1 |
Grounds maintenance workers | 4 | 2 |
Grounds maintenance workers | 4 | 2 |
Personal care and service occupations | -- | -- |
Sales and related occupations | 6 | 4 |
Retail sales workers | 3 | 2 |
Office and administrative support occupations | -- | -- |
Farming, fishing, and forestry occupations | 7 | 4 |
Construction and extraction occupations | 30 | 18 |
Supervisors of construction and extraction workers | 4 | 2 |
First-line supervisors of construction trades and extraction workers | 4 | 2 |
First-line supervisors of construction trades and extraction workers | 4 | 2 |
Construction trades workers | 26 | 16 |
Brickmasons, blockmasons, and stonemasons | 1 | 1 |
Brickmasons and blockmasons | 1 | 1 |
Carpenters | 3 | 2 |
Carpenters | 3 | 2 |
Cement masons, concrete finishers, and terrazzo workers | 1 | 1 |
Cement masons and concrete finishers | 1 | 1 |
Construction laborers | 11 | 7 |
Construction laborers | 11 | 7 |
Roofers | 3 | 2 |
Roofers | 3 | 2 |
Installation, maintenance, and repair occupations | 12 | 7 |
Vehicle and mobile equipment mechanics, installers, and repairers | 3 | 2 |
Other installation, maintenance, and repair occupations | 7 | 4 |
Maintenance and repair workers, general | 3 | 2 |
Maintenance and repair workers, general | 3 | 2 |
Production occupations | 12 | 7 |
Metal workers and plastic workers | 6 | 4 |
Welding, soldering, and brazing workers | 2 | 1 |
Welders, cutters, solderers, and brazers | 1 | 1 |
Welding, soldering, and brazing machine setters, operators, and tenders | 1 | 1 |
Textile, apparel, and furnishings workers | 1 | 1 |
Laundry and dry-cleaning workers | 1 | 1 |
Laundry and dry-cleaning workers | 1 | 1 |
Other production occupations | 3 | 2 |
Transportation and material moving occupations | 50 | 30 |
Air transportation workers | 8 | 5 |
Aircraft pilots and flight engineers | 8 | 5 |
Commercial pilots | 8 | 5 |
Motor vehicle operators | 34 | 20 |
Driver/sales workers and truck drivers | 32 | 19 |
Driver/sales workers | 3 | 2 |
Heavy and tractor-trailer truck drivers | 24 | 14 |
Light truck drivers | 5 | 3 |
Passenger vehicle drivers | 2 | 1 |
Bus drivers, school | 2 | 1 |
Material moving workers | 8 | 5 |
Laborers and material movers | 5 | 3 |
Laborers and freight, stock, and material movers, hand | 3 | 2 |
Military specific occupations (2) | -- | -- |
Footnotes: | ||
NOTE: Data for all years are final. Totals for major categories may include subcategories not shown separately. For complete information on how the data are coded and presented see our definitions page at https://www.bls.gov/iif/oshcfdef.htm. Dashes indicate no data reported or data that do not meet publication criteria. CFOI fatal injury counts exclude illness-related deaths unless precipitated by an injury event. | ||
| Worker characteristics | 2018 | 2019 | |
|---|---|---|---|
| Number | Number | Percent | |
Total | 158 | 166 | 100 |
Employee status | |||
Wage and salary workers (1) | 124 | 134 | 81 |
Self-employed (2) | 34 | 32 | 19 |
Gender | |||
Men | 146 | 152 | 92 |
Women | 12 | 14 | 8 |
Age (3) | |||
20 to 24 years | 10 | 8 | 5 |
25 to 34 years | 23 | 22 | 13 |
35 to 44 years | 31 | 28 | 17 |
45 to 54 years | 37 | 33 | 20 |
55 to 64 years | 35 | 41 | 25 |
65 years and over | 20 | 31 | 19 |
Race or ethnic origin (4) | |||
White, non-Hispanic | 120 | 140 | 84 |
Black or African-American, non-Hispanic | 22 | 15 | 9 |
Hispanic or Latino | 11 | 9 | 5 |
Asian, non-Hispanic | 4 | 1 | 1 |
Footnotes: | |||
NOTE: Data for all years are final. Totals for major categories may include subcategories not shown separately. For complete information on how the data are coded and presented see our definitions page at https://www.bls.gov/iif/oshcfdef.htm. Dashes indicate no data reported or data that do not meet publication criteria. CFOI fatal injury counts exclude illness-related deaths unless precipitated by an injury event. | |||
Last Modified Date: Friday, March 19, 2021