An official website of the United States government
An official website of the United States government
The .gov means it's official.
Federal government websites often end in .gov or .mil. Before sharing sensitive information,
make sure you're on a federal government site.
The site is secure.
The
https:// ensures that you are connecting to the official website and that any
information you provide is encrypted and transmitted securely.
19-2183-CHI
Wednesday, February 12, 2020
Fatal work injuries totaled 32 in 2018 for South Dakota, the U.S. Bureau of Labor Statistics reported today. Assistant Commissioner for Regional Operations Charlene Peiffer noted that the number of work-related fatalities in South Dakota was up from the previous year. Fatal occupational injuries in the state have ranged from a high of 46 in 1999 to a low of 20 in 2013.
Nationwide, a total of 5,250 fatal work injuries were recorded in 2018, up from the 5,147 fatal injuries in 2017, according to the results from the Census of Fatal Occupational Injuries (CFOI) program.
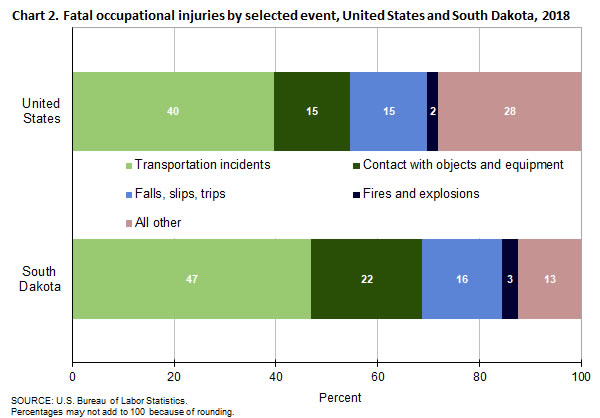
Type of incidentIn South Dakota, transportation incidents resulted in 15 fatal work injuries, and contact with objects and equipment accounted for 7 fatalities. These two major categories accounted for 69 percent of all workplace fatalities in the state. (See table 1.) Worker deaths from transportation incidents were down from 17 over the year, and worker fatalities due to contact with objects and equipment were up from 4. Falls, slips, or trips was the third-most frequent fatal work event with five fatalities compared to the six in the prior year.
Nationally, transportation incidents were the most frequent fatal workplace event in 2018, accounting for 40 percent of fatal work injuries. (See chart 2.) Violence and other injuries by persons or animals was the second-most common fatal event (16 percent), followed by falls, slips, and trips (15 percent) and contact with objects and equipment (15 percent).
IndustryThe private agriculture, forestry, fishing, and hunting industry had the highest number of fatalities in South Dakota with 12, up from 6 in the previous year. (See table 2.) Transportation incidents resulted in 8 of the 12 fatalities in the industry. The cattle ranching and farming sector accounted for 7 of the 12 workplace fatalities in the private agriculture, forestry, fishing, and hunting industry.
The private construction industry had seven workplace fatalities in 2018, compared to the six that were reported in the previous year. The specialty trade contractors sector accounted for 5, or 71 percent, of the fatal injuries in this industry. The private transportation and warehousing industry had 5 work-related deaths in 2018; six were reported in 2017.
OccupationThe management occupational group had the highest number of workplace fatalities with 11. (See table 3.) Farmers, ranchers, and other agricultural managers accounted for 9 of the 11 fatalities among managerial workers. The transportation and material moving occupational group had the second-highest number of workplace fatalities with eight. Heavy and tractor-trailer truck drivers suffered all eight of the work-related deaths within the transportation and material moving group.
Additional highlightsMen accounted for 94 percent of the work-related fatalities in South Dakota, similar to the national share. (See table 4.) Transportation incidents made up 50 percent of the fatalities for men in South Dakota.
White non-Hispanics accounted for 88 percent of those who died from a workplace injury. Nationwide, this group accounted for 65 percent of work-related deaths.
Workers 25-54 years old accounted for 41 percent of the state’s work-related fatalities in 2018, compared to 58 percent of on-the-job fatalities nationally.
Of the 32 fatal work injuries in South Dakota, 59 percent worked for wages and salaries; the remainder were self-employed. The most frequent fatal event for both wage and salary workers and self-employed workers was transportation incidents.
Background of the program. The Census of Fatal Occupational Injuries (CFOI), part of the Bureau of Labor Statistics (BLS) Occupational Safety and Health Statistics (OSHS) program, is a count of all fatal work injuries occurring in the U.S. during the calendar year. The CFOI uses a variety of state, federal, and independent data sources to identify, verify, and describe fatal work injuries. This ensures counts are as complete and accurate as possible. For the 2018 national data, over 24,800 unique source documents were reviewed as part of the data collection process. For technical information and definitions for the CFOI, see the BLS Handbook of Methods on the BLS website at www.bls.gov/opub/hom/cfoi/home.htm.
Federal/State agency coverage. The CFOI includes data for all fatal work injuries, some of which may be outside the scope of other agencies or regulatory coverage. Comparisons between CFOI counts and those released by other agencies should account for the different coverage requirements and definitions used by each agency. For more information on the scope of CFOI, see www.bls.gov/iif/cfoiscope.htm and www.bls.gov/opub/hom/cfoi/concepts.htm.
Acknowledgments. BLS appreciates the efforts of all federal, state, local, and private sector entities that provided source documents used to identify fatal work injuries. Among these agencies are the Occupational Safety and Health Administration; the National Transportation Safety Board; the U.S. Coast Guard; the Mine Safety and Health Administration; the Office of Workers’ Compensation Programs (Federal Employees' Compensation and Longshore and Harbor Workers' Compensation divisions); the Federal Railroad Administration; the National Highway Traffic Safety Administration; state vital statistics registrars, coroners, and medical examiners; state departments of health, labor, and industrial relations and workers' compensation agencies; state and local police departments; and state farm bureaus.
Information in this release will be made available to sensory impaired individuals upon request. Voice phone: (202) 691-5200; Federal Relay Service: (800) 877-8339.
| Event or exposure (1) | 2017 | 2018 | |
|---|---|---|---|
| Number | Number | Percent | |
Total | 30 | 32 | 100 |
Violence and other injuries by persons or animals | 2 | -- | -- |
Transportation incidents | 17 | 15 | 47 |
Aircraft incidents | -- | 1 | 3 |
Other in-flight crash | -- | 1 | 3 |
Other in-flight crash into structure, object, or ground | -- | 1 | 3 |
Roadway incidents involving motorized land vehicle | 13 | 7 | 22 |
Roadway collision with other vehicle | 4 | 2 | 6 |
Roadway collision--moving perpendicularly | -- | 2 | 6 |
Roadway noncollision incident | 6 | 5 | 16 |
Jack-knifed or overturned, roadway | 5 | 4 | 13 |
Nonroadway incident involving motorized land vehicles | -- | 6 | 19 |
Nonroadway noncollision incident | -- | 6 | 19 |
Jack-knifed or overturned, nonroadway | -- | 6 | 19 |
Fires and explosions | -- | 1 | 3 |
Fires | -- | 1 | 3 |
Other structural fire without collapse | -- | 1 | 3 |
Falls, slips, trips | 6 | 5 | 16 |
Falls to lower level | 6 | 4 | 13 |
Other fall to lower level | 4 | 4 | 13 |
Other fall to lower level less than 6 feet | -- | 1 | 3 |
Exposure to harmful substances or environments | 2 | -- | -- |
Exposure to electricity | -- | 1 | 3 |
Direct exposure to electricity | -- | 1 | 3 |
Direct exposure to electricity, greater than 220 volts | -- | 1 | 3 |
Contact with objects and equipment | 3 | 7 | 22 |
Struck by object or equipment | 3 | 5 | 16 |
Struck by powered vehicle--nontransport | 3 | 3 | 9 |
Caught in or compressed by equipment or objects | -- | 1 | 3 |
Caught in running equipment or machinery | -- | 1 | 3 |
Caught in running equipment or machinery during regular operation | -- | 1 | 3 |
Overexertion and bodily reaction | -- | -- | -- |
Footnotes: | |||
NOTE: Data for all years are final. Totals for major categories may include subcategories not shown separately. Percentages may not add to totals because of rounding. CFOI fatality counts exclude illness-related deaths unless precipitated by an injury event. Dashes indicate no data reported or data that do not meet publication criteria. | |||
| Industry (1) | 2017 | 2018 | |
|---|---|---|---|
| Number | Number | Percent | |
Total | 30 | 32 | 100 |
Private industry | 30 | 31 | 97 |
Goods producing | 14 | 20 | 63 |
Natural resources and mining | 6 | 12 | 38 |
Agriculture, forestry, fishing and hunting | 6 | 12 | 38 |
Crop production | 3 | 4 | 13 |
Oilseed and grain farming | 2 | 4 | 13 |
Other grain farming | 1 | 2 | 6 |
Oilseed and grain combination farming | 1 | 2 | 6 |
Animal production and aquaculture | 2 | 8 | 25 |
Cattle ranching and farming | 2 | 7 | 22 |
Beef cattle ranching and farming, including feedlots | 1 | 7 | 22 |
Beef cattle ranching and farming | 1 | 7 | 22 |
Construction | 6 | 7 | 22 |
Construction | 6 | 7 | 22 |
Specialty trade contractors | 4 | 5 | 16 |
Foundation, structure, and building exterior contractors | 2 | 1 | 3 |
Siding contractors | -- | 1 | 3 |
Other specialty trade contractors | -- | 4 | 13 |
Site preparation contractors | -- | 4 | 13 |
Nonresidential site preparation contractors | -- | 3 | 9 |
Manufacturing | 2 | 1 | 3 |
Manufacturing | 2 | 1 | 3 |
Machinery manufacturing | 1 | 1 | 3 |
Other general purpose machinery manufacturing | -- | 1 | 3 |
All other general purpose machinery manufacturing | -- | 1 | 3 |
Scale and balance (except laboratory) manufacturing | -- | 1 | 3 |
Service providing | 16 | 11 | 34 |
Trade, transportation, and utilities | 11 | 7 | 22 |
Transportation and warehousing | 6 | 5 | 16 |
Truck transportation | -- | 5 | 16 |
Specialized freight trucking | 2 | 3 | 9 |
Information | 1 | -- | -- |
Financial activities | 1 | -- | -- |
Real estate and rental and leasing | -- | 1 | 3 |
Real estate | -- | 1 | 3 |
Lessors of real estate | -- | 1 | 3 |
Lessors of residential buildings and dwellings | -- | 1 | 3 |
Professional and business services | -- | -- | -- |
Educational and health services | 1 | 1 | 3 |
Educational services | -- | 1 | 3 |
Educational services | -- | 1 | 3 |
Elementary and secondary schools | -- | 1 | 3 |
Elementary and secondary schools | -- | 1 | 3 |
Leisure and hospitality | 2 | 1 | 3 |
Accommodation and food services | -- | 1 | 3 |
Accommodation | -- | 1 | 3 |
Traveler accommodation | -- | 1 | 3 |
Hotels (except casino hotels) and motels | -- | 1 | 3 |
Other services, except public administration | -- | -- | -- |
Government (2) | -- | 1 | 3 |
Federal government | -- | -- | -- |
State government | -- | -- | -- |
Local government | -- | 1 | 3 |
Footnotes: | |||
NOTE: Data for all years are final. Totals for major categories may include subcategories not shown separately. Percentages may not add to totals because of rounding. CFOI fatality counts exclude illness-related deaths unless precipitated by an injury event. Dashes indicate no data reported or data that do not meet publication criteria. | |||
| Occupation (1) | 2017 | 2018 | |
|---|---|---|---|
| Number | Number | Percent | |
Total | 30 | 32 | 100 |
Management occupations | 5 | 11 | 34 |
Top executives | -- | 1 | 3 |
Chief executives | -- | 1 | 3 |
Chief executives | -- | 1 | 3 |
Other management occupations | 5 | 10 | 31 |
Farmers, ranchers, and other agricultural managers | 5 | 9 | 28 |
Farmers, ranchers, and other agricultural managers | 5 | 9 | 28 |
Property, real estate, and community association managers | -- | 1 | 3 |
Property, real estate, and community association managers | -- | 1 | 3 |
Business and financial operations occupations | 1 | -- | -- |
Computer and mathematical occupations | -- | -- | -- |
Architecture and engineering occupations | -- | -- | -- |
Life, physical, and social science occupations | -- | -- | -- |
Community and social services occupations | -- | -- | -- |
Legal occupations | -- | -- | -- |
Education, training, and library occupations | -- | 1 | 3 |
Preschool, primary, secondary, and special education school teachers | -- | 1 | 3 |
Elementary and middle school teachers | -- | 1 | 3 |
Elementary school teachers, except special education | -- | 1 | 3 |
Arts, design, entertainment, sports, and media occupations | -- | -- | -- |
Healthcare practitioners and technical occupations | -- | -- | -- |
Healthcare support occupations | -- | -- | -- |
Protective service occupations | -- | 1 | 3 |
Fire fighting and prevention workers | -- | 1 | 3 |
Firefighters | -- | 1 | 3 |
Firefighters | -- | 1 | 3 |
Food preparation and serving related occupations | -- | -- | -- |
Building and grounds cleaning and maintenance occupations | -- | -- | -- |
Personal care and service occupations | 1 | -- | -- |
Sales and related occupations | 2 | -- | -- |
Office and administrative support occupations | -- | -- | -- |
Farming, fishing, and forestry occupations | 2 | 4 | 13 |
Agricultural workers | -- | 4 | 13 |
Graders and sorters, agricultural products | -- | 1 | 3 |
Graders and sorters, agricultural products | -- | 1 | 3 |
Miscellaneous agricultural workers | -- | 3 | 9 |
Farmworkers, farm, ranch, and aquacultural animals | -- | 3 | 9 |
Construction and extraction occupations | 5 | 5 | 16 |
Supervisors of construction and extraction workers | -- | 3 | 9 |
First-line supervisors of construction trades and extraction workers | -- | 3 | 9 |
First-line supervisors of construction trades and extraction workers | -- | 3 | 9 |
Installation, maintenance, and repair occupations | -- | -- | -- |
Production occupations | -- | -- | -- |
Transportation and material moving occupations | 10 | 8 | 25 |
Motor vehicle operators | 7 | 8 | 25 |
Driver/sales workers and truck drivers | 7 | 8 | 25 |
Heavy and tractor-trailer truck drivers | 5 | 8 | 25 |
Military specific occupations (2) | -- | -- | -- |
Footnotes: | |||
NOTE: Totals for major categories may include subcategories not shown separately. Percentages may not add to totals because of rounding. CFOI fatality counts exclude illness-related deaths unless precipitated by an injury event. Dashes indicate no data reported or data that do not meet publication criteria. | |||
| Worker characteristics | 2017 | 2018 | |
|---|---|---|---|
| Number | Number | Percent | |
Total | 30 | 32 | 100 |
Employee status | |||
Wage and salary workers (1) | 19 | 19 | 59 |
Self-employed (2) | 11 | 13 | 41 |
Gender | |||
Men | 26 | 30 | 94 |
Women | 4 | -- | -- |
Age (3) | |||
25 to 34 years | 4 | 5 | 16 |
35 to 44 years | 3 | 3 | 9 |
45 to 54 years | 4 | 5 | 16 |
55 to 64 years | 10 | 3 | 9 |
65 years and over | 8 | 13 | 41 |
Race or ethnic origin (4) | |||
White, non-Hispanic | 28 | 28 | 88 |
Black or African-American, non-Hispanic | -- | -- | -- |
Hispanic or Latino | -- | -- | -- |
Footnotes: | |||
NOTE: Data for all years are final. Totals for major categories may include subcategories not shown separately. Percentages may not add to totals because of rounding. CFOI fatality counts exclude illness-related deaths unless precipitated by an injury event. Dashes indicate no data reported or data that do not meet publication criteria. | |||
Last Modified Date: Wednesday, February 12, 2020