An official website of the United States government
An official website of the United States government
The .gov means it's official.
Federal government websites often end in .gov or .mil. Before sharing sensitive information,
make sure you're on a federal government site.
The site is secure.
The
https:// ensures that you are connecting to the official website and that any
information you provide is encrypted and transmitted securely.
21-176-PHI
Friday, January 29, 2021
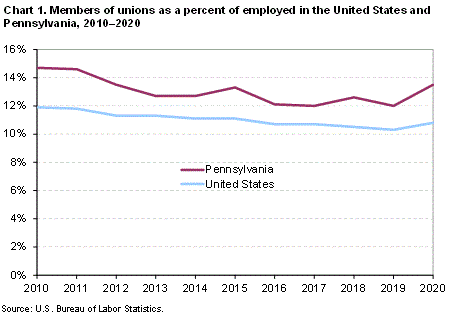
In 2020, union members accounted for 13.5 percent of wage and salary workers in Pennsylvania, compared with 12.0 percent in 2019, the U.S. Bureau of Labor Statistics reported today. Acting Regional Commissioner Frank Waligorski noted that the union membership rate for the state was at its peak in 1989, when it averaged 20.9 percent, and at its low point in 2017 and 2019 at 12.0 percent. (See chart 1 and table A.) Nationwide, union members accounted for 10.8 percent of employed wage and salary workers in 2020, up by 0.5 percentage point from 2019. Since 1989, when comparable state data became available, union membership rates in Pennsylvania have been above the U.S. average.
Pennsylvania had 717,000 union members in 2020. In addition to these members, another 58,000 wage and salary workers in Pennsylvania were represented by a union on their main job or covered by an employee association or contract while not union members themselves.
Nationwide, 14.3 million wage and salary workers were union members in 2020 and 1.7 million wage and salary workers were not affiliated with a union but had jobs covered by a union contract. The number of wage and salary workers belonging to unions (14.3 million) was down by 321,000, or 2.2 percent, from 2019. However, the decline in total wage and salary employment was 9.6 million (mostly among nonunion workers), or 6.7 percent. The disproportionately large decline in total wage and salary employment compared with the decline in the number of union members led to an increase in the union membership rate.
| Year | Total employed | Members of unions (1) | Represented by unions (2) | ||
|---|---|---|---|---|---|
| Total | Percent of employed | Total | Percent of employed | ||
|
2010 |
5,224 | 770 | 14.7 | 831 | 15.9 |
|
2011 |
5,348 | 779 | 14.6 | 846 | 15.8 |
|
2012 |
5,452 | 734 | 13.5 | 787 | 14.4 |
|
2013 |
5,501 | 701 | 12.7 | 754 | 13.7 |
|
2014 |
5,525 | 703 | 12.7 | 754 | 13.7 |
|
2015 |
5,601 | 747 | 13.3 | 804 | 14.4 |
|
2016 |
5,686 | 685 | 12.1 | 724 | 12.7 |
|
2017 |
5,543 | 665 | 12.0 | 723 | 13.0 |
|
2018 |
5,575 | 701 | 12.6 | 748 | 13.4 |
|
2019 |
5,642 | 676 | 12.0 | 740 | 13.1 |
|
2020 |
5,307 | 717 | 13.5 | 775 | 14.6 |
|
Footnotes: |
|||||
|
Note: Data refer to the sole or principal job of full- and part-time wage and salary workers. All self-employed workers are excluded, both those with incorporated businesses as well as those with unincorporated businesses. Updated population controls are introduced annually with the release of January data. |
|||||
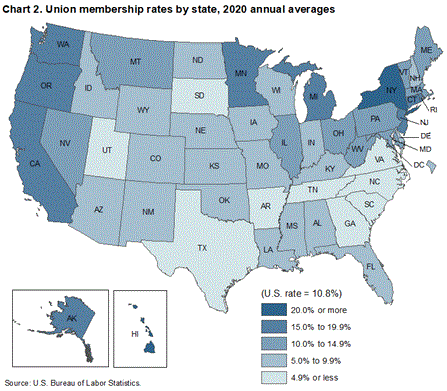
In 2020, 30 states and the District of Columbia had union membership rates below that of the U.S. average, 10.8 percent, while 20 states had rates above it. Nine states had union membership rates below 5.0 percent in 2020. South Carolina had the lowest rate (2.9 percent). The next lowest rates were in North Carolina and Utah (3.1 percent and 3.7 percent, respectively). Two states had union membership rates over 20.0 percent in 2020: Hawaii (23.7 percent) and New York (22.0 percent). (See chart 2.)
Data on union members for 2020 reflect the impact on the labor market of the coronavirus (COVID-19) pandemic and efforts to contain it. Comparisons with union membership measures for earlier years, including metrics such as the union membership rate should be interpreted with caution. The overall union membership rate and the rates by many demographic and employment characteristics increased despite declines in the number of union members. These increases reflect the disproportionately large decline in total wage and salary employment (mostly among nonunion workers) compared with the decline in the number of union members. Increases in median weekly earnings reflect the disproportionately large decline in employment in 2020, notably among lower-paid workers, such as those in the leisure and hospitality industry. More information on labor market developments in recent months is available at www.bls.gov/covid19/effects-of-covid-19-pandemic-and-response-on-the-employment-situation-news-release.htm.
The estimates in this release are obtained from the Current Population Survey (CPS), which provides basic information on the labor force, employment, and unemployment. The survey is conducted monthly for the Bureau of Labor Statistics by the U.S. Census Bureau from a scientifically selected national sample of about 60,000 eligible households. The union membership data are tabulated from one-quarter of the CPS monthly sample and are limited to wage and salary workers. All self-employed workers are excluded.
Beginning in January of each year, data reflect revised population controls used in the CPS. Additional information about population controls is available on the BLS website at www.bls.gov/cps/documentation.htm.
Information about the reliability of data from the CPS and guidance on estimating standard errors is available at www.bls.gov/cps/documentation.htm#reliability.
DefinitionsThe principal definitions used in this release are described briefly below.
Union members. Data refer to members of a labor union or an employee association similar to a union.
Union membership rate. Data refer to the proportion of total wage and salary workers who are union members.
Represented by unions. Data refer to both union members and workers who report no union affiliation but whose jobs are covered by a union or an employee association contract.
Wage and salary workers. Workers who receive wages, salaries, commissions, tips, payment in kind, or piece rates. The group includes employees in both the private and public sectors. Union membership and earnings data exclude all self-employed workers, both those with incorporated businesses as well as those with unincorporated businesses.
Information in this release will be made available to individuals with sensory impairments upon request. Voice phone: 202-691-5200; Federal Relay Service: 800-877-8339.
Last Modified Date: Friday, January 29, 2021