An official website of the United States government
An official website of the United States government
The .gov means it's official.
Federal government websites often end in .gov or .mil. Before sharing sensitive information,
make sure you're on a federal government site.
The site is secure.
The
https:// ensures that you are connecting to the official website and that any
information you provide is encrypted and transmitted securely.
14-2194-PHI
Friday, November 28, 2014
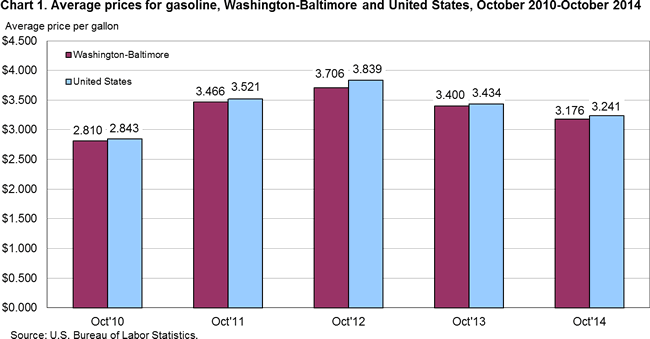
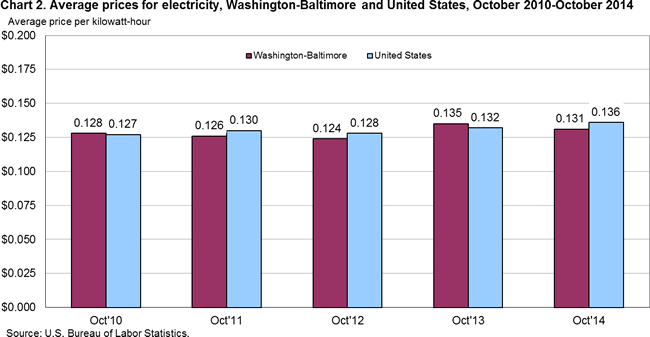
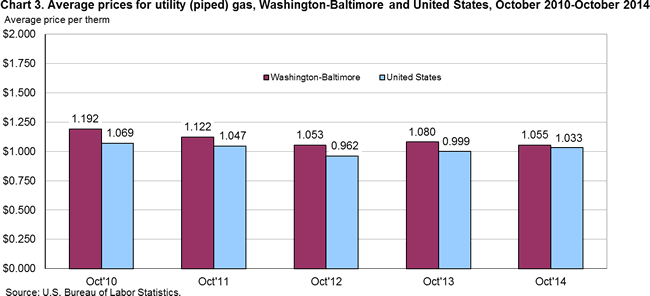
Gasoline prices averaged $3.176 a gallon in the Washington-Baltimore area in October 2014, the U.S. Bureau of Labor Statistics reported today. Sheila Watkins, the Bureau’s regional commissioner, noted that area gasoline prices decreased 6.6 percent from last October when they averaged $3.400 per gallon. Washington area households paid an average of 13.1 cents per kilowatt hour (kWh) of electricity in October 2014, down 3.0 percent since October 2013. The average cost of utility (piped) gas at $1.055 per therm in October was less than the $1.080 per them spent last year, a decrease of 2.3 percent. (All data in this release are not seasonally adjusted; accordingly, over-the-year analysis is used throughout.)
At $3.176 a gallon, Washington area consumers paid close to the national average of $3.241 for gasoline in October 2014. A year earlier, the price for a gallon of gasoline in the Washington area was also similar to the national average. In fact, the local prices for a gallon of gasoline in October have differed by less than 4 percent from the national average in each of the last five years. (See chart 1 and table 1.)
The 13.1 cents per kWh that Washington households paid for electricity in October 2014 was close to the nationwide average of 13.6 cents. Last year, electricity prices for consumers in Washington were also close to those for the nation. In fact, in the month of October, local prices for electricity were similar to those for the nation for the last five years. (See chart 2.)
In October 2014, the price paid by Washington area consumers for utility (piped) gas, commonly referred to as natural gas, at $1.055 per therm, was slightly higher than the national average of $1.033. A year earlier, local area prices for natural gas were 8.1 percent higher than those nationwide. From 2010 to 2013, the per-therm cost for natural gas in Washington exceeded the U.S. average by 7 percent or more in the month of October. (See chart 3.)
The Washington-Baltimore, D.C.-Md.-Va.-W.Va. Consolidated Metropolitan Statistical Area includes the District of Columbia; Baltimore City and the counties of Anne Arundel, Baltimore, Calvert, Carroll, Charles, Frederick, Harford, Howard, Montgomery, Prince George’s, Queen Anne’s, and Washington in Maryland; the cities of Alexandria, Fairfax, Falls Church, Fredericksburg, Manassas, and Manassas Park and the counties of Arlington, Clarke, Culpeper, Fairfax, Fauquier, King George, Loudoun, Prince William, Spotsylvania, Stafford, and Warren in Virginia; and the counties of Berkeley and Jefferson in West Virginia.
Additional Information
Information in this release will be made available to sensory impaired individuals upon request. Voice phone: 202-691-5200; Federal Relay Services: 1-800-877-8339.
Average prices are estimated from Consumer Price Index (CPI) data for selected commodity series to support the research and analytic needs of CPI data users. Average prices for electricity, utility (piped) gas, and gasoline are published monthly for the U.S. city average, the 4 regions, the 3 population size classes, 10 region/size-class cross-classifications, and the 14 largest local index areas. For electricity, average prices per kilowatt-hour (kWh) are published. For utility (piped) gas, average prices per therm are published. For gasoline, the average price per gallon is published. Average prices for commonly available grades of gasoline are published as well as the average price across all grades.
All eligible prices are converted to a price per normalized quantity. These prices are then used to estimate a price for a defined fixed quantity. The average price per kilowatt-hour represents the total bill divided by the kilowatt-hour usage. The total bill is the sum of all items applicable to all consumers appearing on an electricity bill including, but not limited to, variable rates per kWh, fixed costs, taxes, surcharges, and credits. This calculation also applies to the average price per therm for utility (piped) gas.
| Year and Month | Gasoline per gallon | Electricity per kWh | Utility (piped) gas per therm | |||
|---|---|---|---|---|---|---|
| United States | Washington-Baltimore | United States | Washington-Baltimore | United States | Washington-Baltimore | |
| 2013 | ||||||
October | 3.434 | 3.400 | 0.132 | 0.135 | 0.999 | 1.080 |
November | 3.310 | 3.330 | 0.130 | 0.131 | 0.999 | 1.106 |
December | 3.333 | 3.438 | 0.131 | 0.131 | 0.998 | 1.101 |
| 2014 | ||||||
January | 3.378 | 3.443 | 0.134 | 0.130 | 1.040 | 1.115 |
February | 3.422 | 3.393 | 0.134 | 0.129 | 1.078 | 1.175 |
March | 3.590 | 3.545 | 0.135 | 0.129 | 1.154 | 1.333 |
April | 3.717 | 3.680 | 0.131 | 0.129 | 1.137 | 1.229 |
May | 3.745 | 3.700 | 0.136 | 0.129 | 1.111 | 1.169 |
June | 3.750 | 3.688 | 0.143 | 0.128 | 1.088 | 1.174 |
July | 3.690 | 3.664 | 0.143 | 0.129 | 1.093 | 1.150 |
August | 3.540 | 3.478 | 0.143 | 0.131 | 1.060 | 1.044 |
September | 3.463 | 3.377 | 0.141 | 0.135 | 1.058 | 1.058 |
October | 3.241 | 3.176 | 0.136 | 0.131 | 1.033 | 1.055 |
Last Modified Date: Friday, November 28, 2014