
An official website of the United States government
An official website of the United States government
The .gov means it's official.
Federal government websites often end in .gov or .mil. Before sharing sensitive information,
make sure you're on a federal government site.
The site is secure.
The
https:// ensures that you are connecting to the official website and that any
information you provide is encrypted and transmitted securely.
The BLS productivity program will introduce a new methodology for estimating hours worked in the major sector Productivity and Costs news release on November 3, 2022. This new methodology uses all-employee hours from the BLS establishment survey, the Current Employment Statistics (CES) survey, as the main source of data. The CES all-employee hours series was first introduced in March 2006 as a research series and became the official BLS hours series in 2010. The new methodology for estimating hours worked improves on the current methodology,[1] which uses the CES production and nonsupervisory employee (henceforth referred to as production employees) hours data.[2]
The new methodology uses the CES all-employee hours data and therefore eliminates the need to separately estimate hours worked by production and nonproduction employees.[3] However, as with the current methodology, it is necessary to adjust CES hours paid data to an hours-worked concept. The new methodology can be expressed as:

 is the hours-worked-to-hours-paid adjustment ratio. The ideal ratio, HWHP*, compares hours worked to hours paid and can be written as:
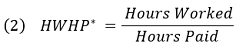
where hours worked include paid hours worked and hours of unpaid off-the-clock (OTC) work, and hours paid include paid hours worked and hours of paid time off (PTO).[4] Equation (2) can be decomposed into the product of two separate adjustment ratios:
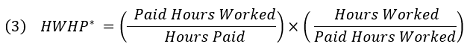
The first term is the PTO adjustment, or PTO ratio, and is a ratio of paid hours worked (hours paid – hours of paid time off) to hours paid and is conceptually the same as the HWHP ratio used in the current methodology. The current methodology uses the HWHP ratio for production employees from the National Compensation Survey (NCS), which is an establishment survey that collects data on all forms of compensation, including paid leave.[5] The NCS HWHP ratios adjust hours paid for paid time off (annual leave earned, including paid holidays, and average annual sick leave taken), but do not account for OTC hours. The second term in the HWHP ratio is the OTC adjustment, or OTC ratio, and is a ratio of hours worked (paid hours worked plus OTC hours) to paid hours worked.
In the new methodology, the PTO ratio is constructed from NCS data as is currently done, except that it is calculated for all employees rather than production employees. Because the NCS PTO ratio is calculated from establishment data, the maintained assumption is that estimates of the level of PTO hours are more accurate than those that would be obtained from CPS data. And because the NCS PTO data are based on annual leave earned and average sick leave taken, the NCS PTO ratio is free of seasonal variation.
The OTC ratio is constructed from Current Population Survey (CPS) data. Note that, even though we estimate the PTO ratio from the NCS and the OTC ratio from the CPS, they are constructed to be consistent with each other. That is, the denominator in the OTC ratio is conceptually the same as the numerator in the PTO ratio. Thus, equation (3) becomes:

The methodology for calculating the OTC ratio using CPS data is detailed in the Monthly Labor Review article, “Improving Estimates of Hours Worked for U.S. Productivity Measurement,” by Lucy P. Eldridge, Sabrina Wulff Pabilonia, Drake Palmer, Jay Stewart and Jerin Varghese. The article describes the current methodology, discusses the advantages of making the change to the all-employee hours series, describes the new methodology, and compares the new all-employee-hours-based series to the current methodology.
The new hours methodology is a notable improvement over the current methodology, especially the incorporation of off-the-clock hours. The new methodology estimates off-the-clock work for all full-time salaried employees, while the current methodology makes only a partial adjustment for nonproduction employees.[6] However, it is important to note that the new methodology produces results that are similar, but not identical, to the current methodology. Both series have nearly identical long-run growth rates, but aggregate hours worked are estimated to be about 2.8 percent higher on average using the new method. See the table comparing the U.S. nonfarm economy hours by sector using the old and new method.
The following charts compare the research hours series constructed using the new all-employee hours methodology with the current methodology.[7]
Figure 1 compares the new hours worked for employees in the private nonfarm sector to the current published series. Both series have the same general trend and nearly identical long-run growth rates, which is not too surprising because changes in hours are driven primarily by changes in employment and all series use the same CES employment data. However, the hours worked levels for the new series are about 2.8 percent higher than the current methodology over the 2006 – 2021 period, which reflects the new methodology’s ability to measure OTC hours.
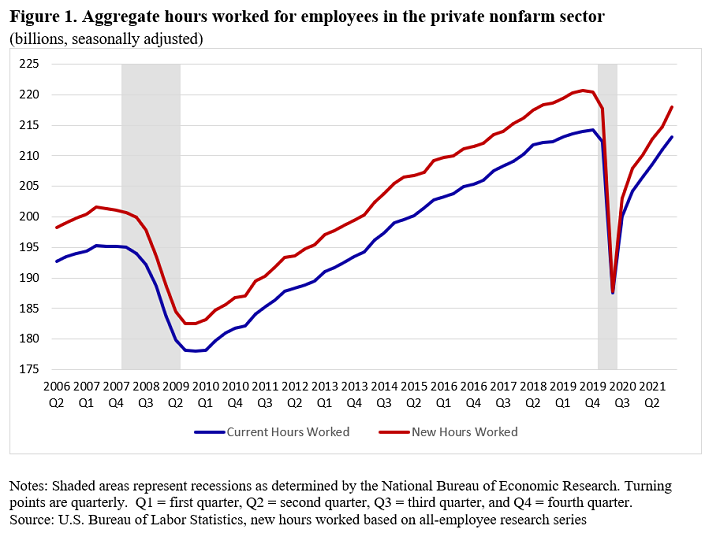
Figure 1 Data, Aggregate hours worked for employees in the private nonfarm sector, 2006 Q2 - 2021 Q4
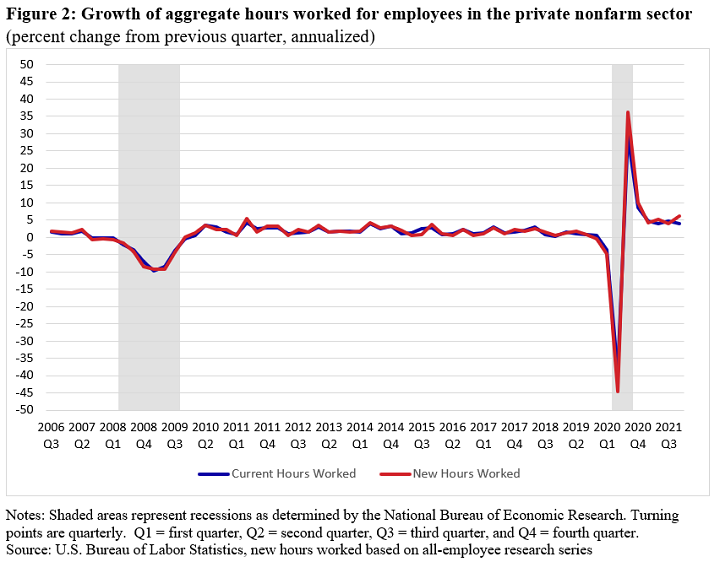
The main difference between the new and old series is that they tell somewhat different stories about quarter-to-quarter growth of hours worked. Figure 2 compares the annualized quarterly growth rates from the new and current series. The two series are very close to each other, although there are notable differences in the two recessions. During the Great Recession, the decline in aggregate hours was greater for the new series, compared with the current series, in four of the six recession quarters. And the new series exhibited greater hours growth in the quarters immediately following the end of the recession. During the COVID-19 pandemic recession, the new series fell faster than the current series and recovered faster than the current series. These differences can be seen in Table 1. Although it is difficult to pinpoint the exact cause of these differences, they are consistent with the new series doing a better job of capturing OTC work.
| Hours Worked Series | 2007 Q4 – 2009 Q3 | 2009 Q3 – 2010 Q3 | 2019 Q4 – 2020 Q2 | 2020 Q2 – 2021 Q2 |
|---|---|---|---|---|
|
New Methodology |
−5.4 | 1.8 | −27.4 | 13.2 |
|
Current Methodology |
−5.1 | 1.6 | −23.4 | 11.2 |
|
Source: U.S. Bureau of Labor Statistics, new series based on all-employee research series |
||||
Figures 3 and 4 and Table 2 show the same comparisons for the manufacturing sector.
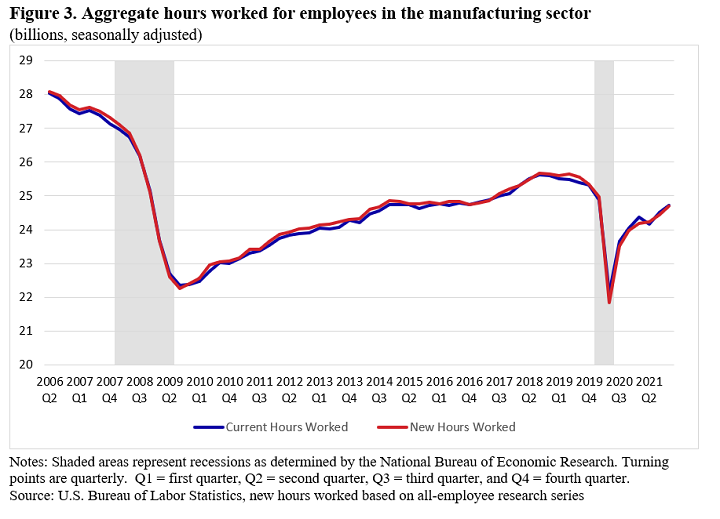
Figure 3 Data, Aggregate hours worked for employees in the manufacturing sector, 2006 Q2 - 2021 Q4
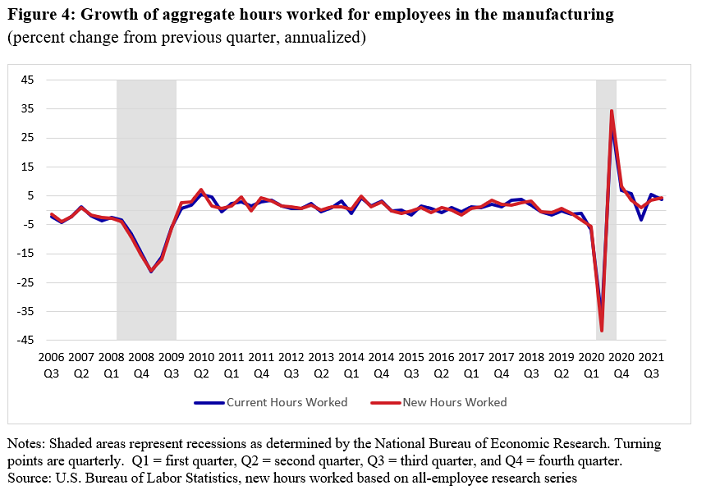
| Hours Worked Series | 2007 Q4 – 2009 Q3 | 2009 Q3 – 2010 Q3 | 2019 Q4 – 2020 Q2 | 2020 Q2 – 2021 Q2 |
|---|---|---|---|---|
|
New Methodology |
−11.4 | 3.6 | −27.0 | 11.0 |
|
Current Methodology |
−10.5 | 3.0 | −24.2 | 9.3 |
|
Source: U.S. Bureau of Labor Statistics, new series based on all-employee research series |
||||
[1] See the BLS Handbook of Methods for details on the current methodology. For quarterly series prior to 2006 Q2 and annual series prior to 2007, the new hours worked time series is constructed by linking the level of the new hours worked series to the movements of the previous series. This approach prevents a break in the series.
[2] The CES instructs respondents to classify employees as production or nonproduction employees in goods-producing industries and as nonsupervisory or supervisory employees in service-providing industries. This results in some inconsistencies in how some employees are classified. For example, an accountant who does not supervise other employees would be classified as a nonproduction employee if employed in a goods-producing industry but as a nonsupervisory employee in a service-providing industry. Moreover, a record analysis survey (U.S. Bureau of Labor Statistics, 1983) showed that respondents do not always follow CES instructions when classifying their employees.
[3] There will be no change to the measurement of hours worked by the self-employed and unpaid family workers.
[4] The subscript denoting all employees is dropped from this point forward.
[5] The primary use of the NCS data is to construct the Employment Cost Index (ECI). Prior to 2000, the HWHP ratio was estimated using data from the now-discontinued Hours at Work Survey.
[6] In the nonproduction-worker-to-production-worker hours ratio used in the current methodology, both the numerator and denominator are actual hours worked. However, to be conceptually consistent with the CES data, the denominator should be hours paid, which excludes off-the-clock hours worked by salaried production employees. That is, this ratio implicitly assumes that production workers are paid for all of the hours they work. However, according to the CPS, about 30 percent of production workers are paid a salary. Thus, the nonproduction-worker-to-production-worker hours ratio is biased downward and therefore does not capture all of the OTC hours worked by salaried nonproduction workers.
[7] The official series released in November 2022 will track the research series closely, but there may be slight differences.