- Annual Data on Labor Productivity and Related Measures
- Analysis
- Inquiries and Feedback

An official website of the United States government
An official website of the United States government
The .gov means it's official.
Federal government websites often end in .gov or .mil. Before sharing sensitive information,
make sure you're on a federal government site.
The site is secure.
The
https:// ensures that you are connecting to the official website and that any
information you provide is encrypted and transmitted securely.
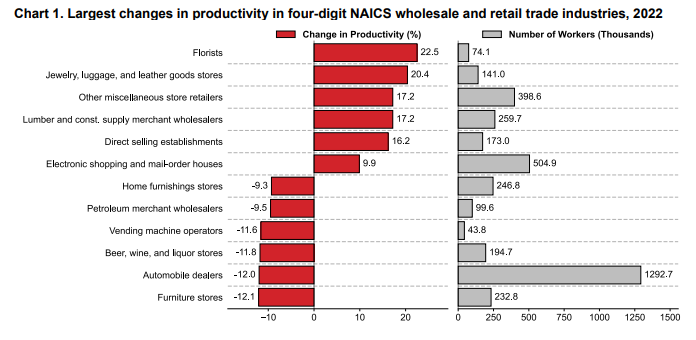
On May 25, 2023, the Bureau of Labor Statistics (BLS) updated measures for 46 detailed industries Productivity and Costs by Industry: Wholesale Trade and Retail Trade Industries - 2022. Chart 1 from the news release illustrates the NAICS four–digit trade industries with the largest increases and decreases in labor productivity in 2022 as well as their employment. The six industries with the highest productivity growth reported increases in output while all six industries with the largest declines reported growth in hours worked.
In 2022, the wholesale trade sector[1] comprised 5.96 million workers[2], roughly 3.9 percent of nonfarm businesses sector payroll employment, and 6.3 percent of U.S. Gross Domestic Product (GDP).[3] The retail trade sector[4] employed approximately 15.48 million people, or 10.1 percent of all total nonfarm employees in 2022, and contributed 5.8 percent to GDP.
This webpage takes a closer look at the drivers behind recent output trends, with a particular emphasis on the role of price changes over time.
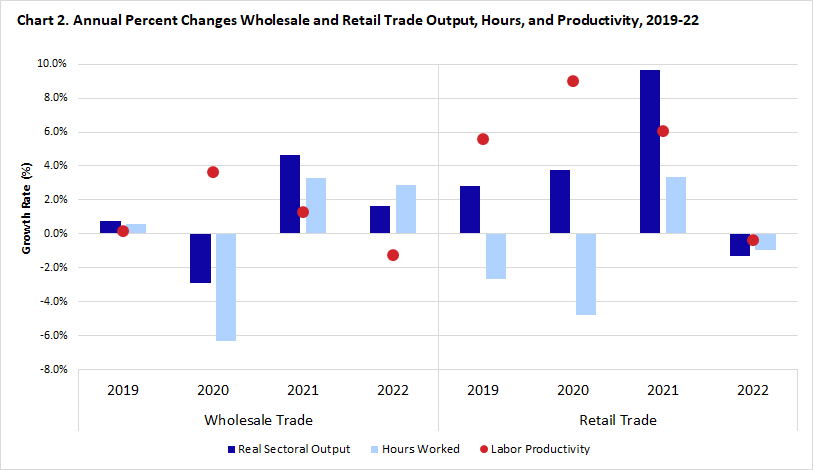
After experiencing growth in 2020 and 2021, productivity declined in the wholesale and retail trade sectors in 2022. Yet, productivity declines in the two sectors were brought on by very different dynamics. Chart 2 highlights recent output, hours worked, and productivity trends in the two trade sectors. In the wholesale trade sector (NAICS 42), 2022 was the first year since 2011 that productivity fell and growth in hours worked outpaced output growth. Labor productivity declined 1.2 percent as output (+1.6 percent) rose more slowly than hours worked (+2.9 percent). In the retail trade sector (NAICS 44-45), output fell faster (-1.3 percent) than hours worked (-1.0 percent) leading to a 0.4 percent drop in labor productivity in 2022. Output, hours, and productivity have not all declined in the same year for the retail trade sector since 2008.
So, what happened to output in 2022? If we break the measure down further, the answer seems to be a story of prices.
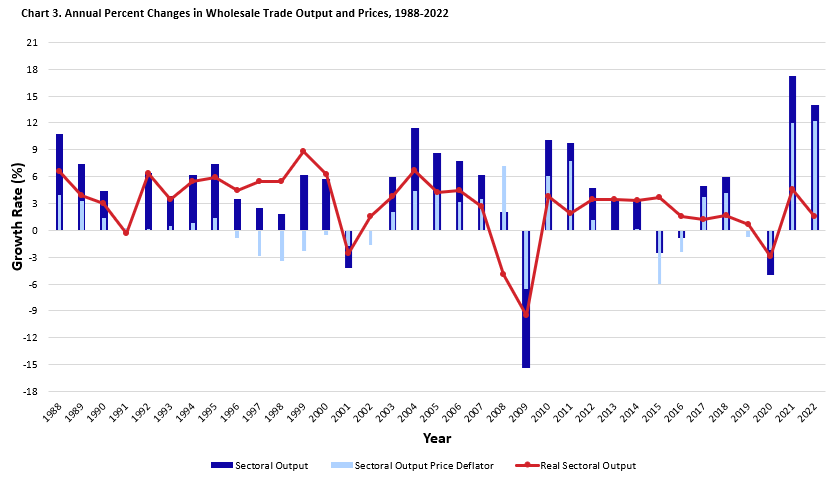
Contributing to its slower output growth, the wholesale trade sector experienced the largest growth in prices (+12.2 percent) in 2022 since measurement began in 1987. The wholesale trade sector consists of 19 NAICS four-digit industries and 3 three-digit industries. In all but 1 of four-digit wholesale industries, prices rose. Lumber and other construction materials merchant wholesalers (NAICS 4233) were the only exception with prices falling 7.5 percent. Adding to the notable changes in 2022, 9 of the 19 four-digit industries and 2 of the 3 NAICS three-digit industries had record price growth. Petroleum (NAICS 4247) prices rose by 51.8 percent in 2022, the largest increase in the wholesale sector by far. Despite the rise in prices, real sectoral output grew in 12 of the 22 wholesale industries as sectoral output rose across the board.
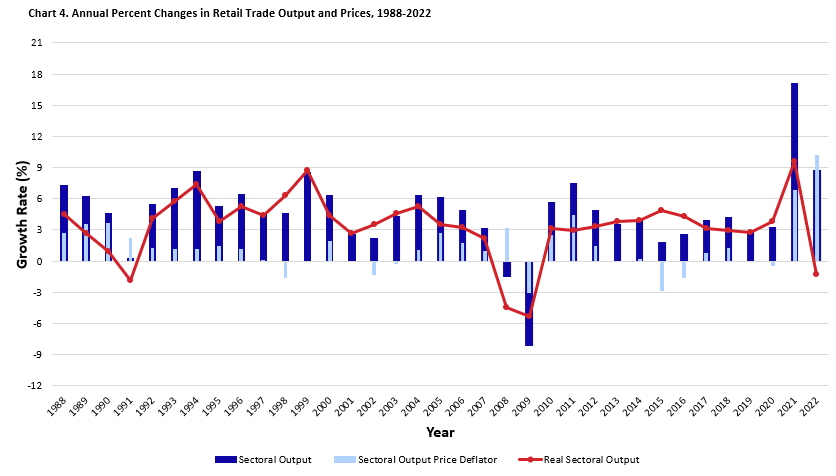
In 2022, the retail trade sector also had the largest growth in prices in its series (+10.2 percent). The retail trade sector includes 27 NAICS four-digit industries and 12 three-digit industries. Outside of declines in electronics and appliance stores (NAICS 4431), prices rose in all retail four-digit industries. Like wholesale trade, there were several industries with the highest price growth in the history of the series (going back to 1987). Ten of the three-digit and 20 of the four-digit NAICS industries had record price growth. Gasoline stations (NAICS 4471) had the largest increase, with prices rising 28.3 percent. Real output declined in 21 of the 39 retail industries as the growth in prices outpaced the growth in sectoral output.
2022 was a tumultuous year for automobile dealers (NAICS 4411). Productivity fell for the first time since the Great Recession due to hours increasing while output declined. Productivity growth was positive in 2020 and 2021 but for different reasons. In 2020, hours and output declined but the drop in hours was greater than the decline in output. In 2021, output and hours both rebounded but output grew faster than hours worked.
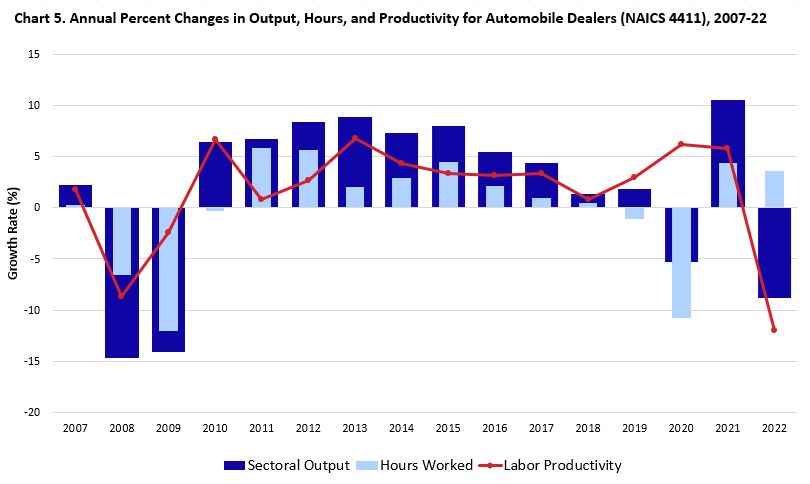
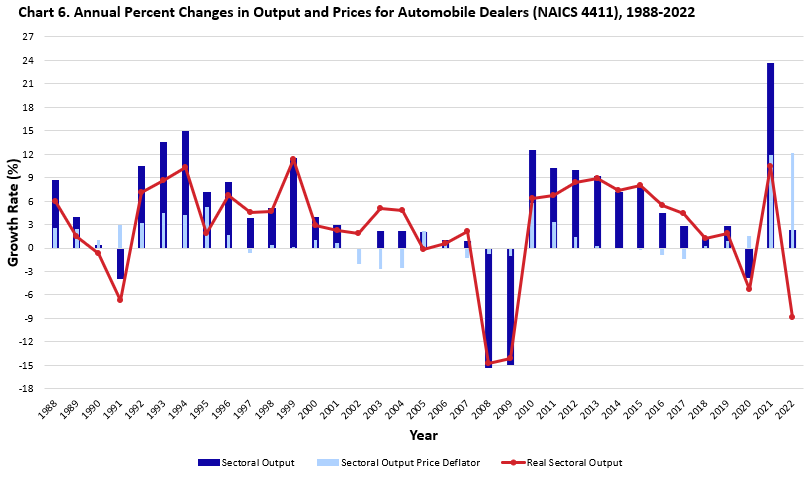
The drop in output in 2022 was a result of several factors including inventories, prices, and interest rates. Inventories at motor vehicle dealers were low due in part to the chip shortage and supply chain disruptions.[5] Prices for automobile dealers increased over ten percent in both 2021 and 2022 which may have influenced consumer behavior to purchase fewer vehicles and encouraged people to hold onto their vehicles longer. The average age of U.S. cars and light trucks climbed to a record 12.5 years in 2022 adding 3 months from the prior year.[6]
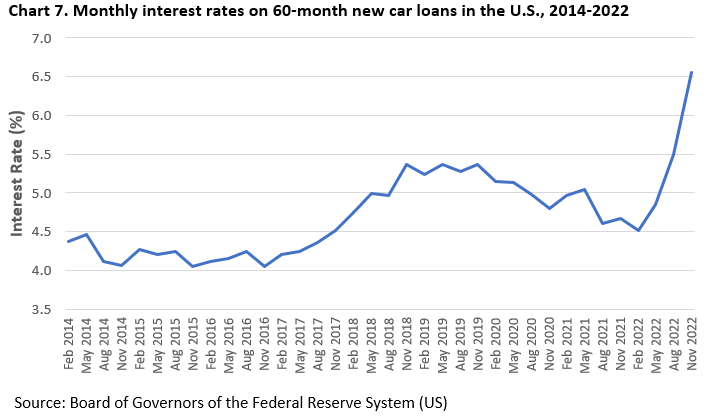
Interest rates were also a factor in the lower sales for automobiles in 2022. Though monthly interest rates on 60-month new car loans remained largely flat through 2021, they jumped from about 4 percent to just over 6 percent through 2022.
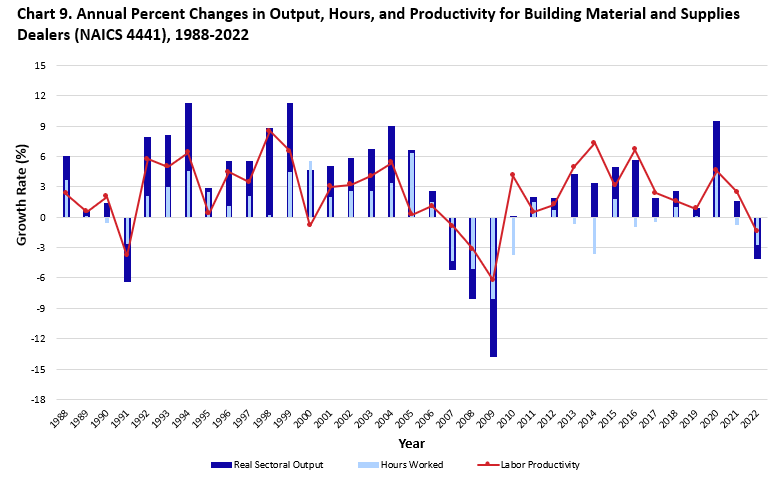
Building material and supplies dealers (NAICS 4441) showed an overall output decline even as their revenue continued to increase post-pandemic. The price surges in 2021 and 2022 increased overall industry revenue even as fewer goods crossed the checkout counter.
Consumers spent money on home improvements during the pandemic, according to Harvard University’s Joint Center for Housing Studies.[7] Coupled with the disruption of supply chains for many construction materials, this created product shortages and prices rose precipitously.[8]
Though revenue rose nearly seven percent in 2022 in this industry, adjusting for the extreme price effects showed an overall real output decline. These price increases are the largest seen in this industry since the start of the series in 1987.
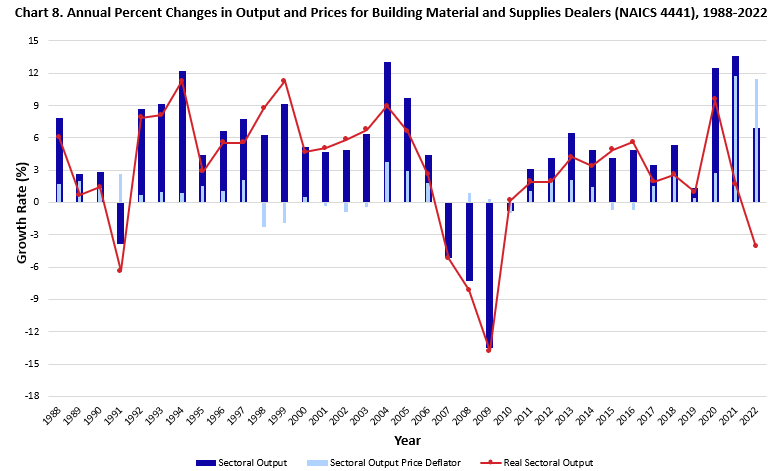
Fewer hours were worked in this industry in 2022 as the home improvement boom continued to subside, but the decline in hours was exceeded by the decline in output, leading to an overall decrease in labor productivity in the industry.
Industries at a Glance: Wholesale Trade
Industries at a Glance: Retail Trade
[1] The wholesale trade sector refers to the 2-digit North American Industry Classification System (NAICS) code 42 Wholesale Trade.
[2] Source: BLS Current Employment Statistics Databases
[3] Source: BEA Gross Domestic Product By Industry. Using the interactive data tool, select Value Added by Industry, then Value added by Industry as a Percentage of Gross Domestic Product.
[4] The retail trade sector refers to the 2-digit North American Industry Classification System (NAICS) code 44-45 Retail Trade.
[5] Source: ACV Actions blog post on Car Chip Shortage-What Dealers Need to Know in 2022, May 27, 2022
[6] Source: S&P Global Mobility, May 15, 2023
Last Modified Date: August 7, 2023