
An official website of the United States government
An official website of the United States government
The .gov means it's official.
Federal government websites often end in .gov or .mil. Before sharing sensitive information,
make sure you're on a federal government site.
The site is secure.
The
https:// ensures that you are connecting to the official website and that any
information you provide is encrypted and transmitted securely.
On June 29, 2023, the Bureau of Labor Statistics (BLS) updated measures of productivity and costs through 2021 for urban transit systems (NAICS 4851). These measures were originally introduced on August 22, 2018. More information can be found in an article written by BLS economists in the Monthly Labor Review (MLR). The current data reference period for these data series lag other service industries, including those in the transportation sector, by one year. BLS cannot publish urban transit systems productivity series until all source data based on the latest fully closed report year are available.
Urban transit systems is a passenger transportation industry primarily operated by state and local governments. There are various modes of transportation included in this industry, including buses, subways, and light rail systems. These systems are of vital importance to the well-being of America’s urban population, as they provide access to jobs, education, health-care, and recreation for millions of people each day. In 2021, urban transit systems employed 387,256 workers, close to as many as the scheduled air transportation industry (about 417,600).
In order to measure how efficiently transportation services are provided, the BLS productivity program has developed a measure of labor productivity for urban transit systems. Underlying this measure are series of both output and hours worked. These series make use of data from the Federal Transportation Administration’s National Transit Database (NTD) and from the American Public Transportation Association (APTA).
To create your own tables and charts by industry and indicator, use our urban transit dashboard.
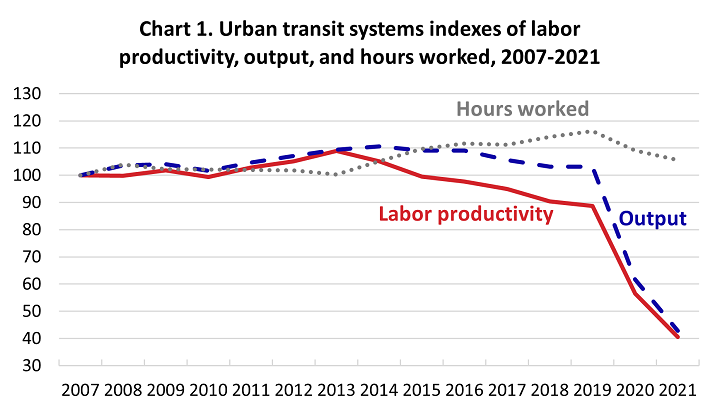
Chart 1 shows that labor productivity growth in urban transit systems was modestly positive from 2007 to 2013, growing by an average annual rate of 1.4 percent. Over that period, the average annual growth of output outpaced that of hours worked, 1.5 percent to 0.1 percent. However, between 2013 and 2019, the trends in output and hours worked reversed, with output declining by an annual average of 1.0 percent while hours worked grew by an average of 2.5 percent. In 2020, the COVID-19 pandemic caused a dramatic disruption in the operations of urban transit systems nationwide. Due to decreased ridership,[1] output fell by 40.3 percent while hours worked declined by 6.2 percent. This caused a drop in labor productivity of 36.3 percent in 2020. The impact of the pandemic continued to be seen in 2021. Output fell by another 30.5 percent while hours worked dropped by 3.3 percent. Consequently, labor productivity declined by 28.2 percent from 2020 to 2021.
Urban transit systems include various transportation modes (see the FAQ section below for a full list of these modes). Let’s take a closer look at how transit modes have contributed to industry output growth since 2007.
| Year | Total bus (1) | Regional rail (2) | Heavy rail | Surface rail (3) |
|---|---|---|---|---|
|
2007 |
20,424 | 11,137 | 16,138 | 1,930 |
|
2008 |
21,204 | 11,032 | 16,850 | 2,081 |
|
2009 |
21,105 | 11,129 | 16,805 | 2,196 |
|
2010 |
20,574 | 10,774 | 16,407 | 2,173 |
|
2011 |
20,709 | 11,384 | 17,317 | 2,294 |
|
2012 |
21,423 | 11,194 | 17,516 | 2,415 |
|
2013 |
21,553 | 11,819 | 18,005 | 2,481 |
|
2014 |
21,732 | 11,691 | 18,339 | 2,583 |
|
2015 |
21,203 | 11,782 | 18,283 | 2,532 |
|
2016 |
20,822 | 11,856 | 18,357 | 2,667 |
|
2017 |
19,623 | 12,336 | 17,591 | 2,690 |
|
2018 |
18,980 | 12,694 | 16,914 | 2,645 |
|
2019 |
18,738 | 12,804 | 17,366 | 2,596 |
|
2020 |
12,852 | 6,093 | 8,947 | 1,762 |
|
2021 |
8,908 | 3,746 | 7,405 | 1,001 |
|
Compound annual percent change, 2007-2021 |
-5.8% | -7.5% | -5.4% | -4.6% |
| Notes: (1) This includes bus, commuter bus, and bus rapid transit. (2) This includes commuter rail and hybrid rail. (3) This includes light rail and streetcar. Source: U.S. Bureau of Labor Statistics. |
||||
Table 1 shows that surface rail, which includes both light rail and streetcar, recorded the greatest increase in passenger miles traveled (PMT) prior to the pandemic. Surface rail PMT increased from 1.9 billion in 2007 to 2.6 billion in 2019 – an average rate of 2.5 percent annually. The next fastest growing transit mode was regional rail, which increased PMT from 11.1 billion to 12.8 billion over the same period (an average annual rate of 1.2 percent). On the other hand, passenger miles traveled on buses fell between 2007 and 2019, by an annual average of 0.7 percent.
All major modes of transportation in the NTD data recorded steep declines in ridership in 2020 and 2021. Regional rail PMT declined by over two-thirds, from 12.8 billion in 2019 down to only 3.7 billion in 2021. Heavy rail also saw a severe drop in ridership, with PMT falling from 17.4 billion in 2019 down to 7.4 billion in 2021. Similarly, miles traveled on bus systems fell to 8.9 billion in 2021, fewer than half of their level in 2019 (18.7 billion).
According to a report from APTA, ridership declines were especially steep in cities with high levels of technology-focused employment, where workers were able to work from home during the pandemic. Also, transit systems in college towns were severely affected as many universities were closed during much of 2020.[2]
The two panes of Chart 2 compare the productivity trend of urban transit systems with three other transportation industries for which BLS publishes productivity measures. (Both predominantly passenger- and freight-carrying industries are included here.) Chart 2a shows the period prior to the pandemic. Productivity growth in urban transit systems was about the median for these industries between 2007 and 2013. However, urban transit systems’ decline in labor productivity from 2013 to 2019 was unique among the illustrated industries.
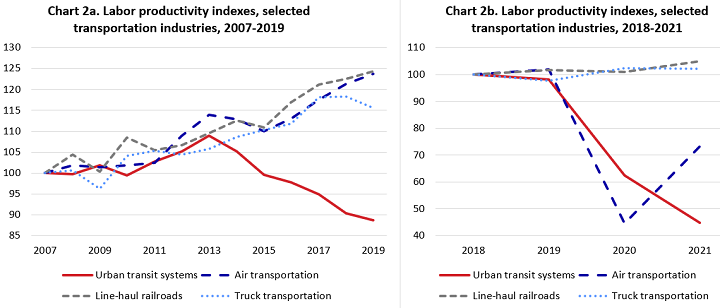
Chart 2b rebases the indexes to 2018 and expands the y-axis to show how the pandemic affected these transportation industries in 2020. Both urban transit systems and air transportation had steep declines in output, as passenger travel was sharply curtailed. At the same time, these industries both maintained a relatively consistent level of employment. As a result, both air transportation and urban transit systems had historically large declines in the productivity index in 2020. In 2021 there was a resurgence of leisure travel, causing output and productivity to bounce back in air transportation. On the other hand, ridership and productivity continued to decline in urban transit systems in 2021. This likely reflects the continuing lack of demand for business travel, especially commuting.
Because flat or declining output (ridership) has contributed to the poor productivity performance of transit systems, it can be instructive to look at potential riders’ alternative options. Commuting and other work-related purposes are the most important reason[3] for using urban transit systems. The Census Bureau’s 5-year American Community Survey[4] provides data on commuting modes. From the 2009 release (2005-09 data) through the 2020 release (2016-20 data), the share of Americans who commute to work using public transportation reported by the ACS has remained stable at about 5%. Given the increasing number of overall trips to and from work estimated by the ACS over time, this means that prior to the pandemic, more Americans than ever are using transit to commute to or from work.
Through 2019, the decline in transit ridership came from non-work related travel, such as shopping, errands, and social and recreational activities.[5] These are activities where other options could substitute for transit use. Private driving is the most common mode of travel nationwide. Other substitutes can include ride-hailing services, on-line shopping, and social media. Notably, the steady decline in transit ridership nationally since 2014 coincides with the increasing popularity of these information technology-enabled trends.
In the 2021 release of the ACS (2017-21 data), the share of workers commuting via public transportation fell to 2.5 percent. This drop in public transit commuting can be blamed on the pandemic, as more workers used private transportation or instead worked from home. Naturally, this change in commuting patterns caused the steep decline in ridership that we see in the output series of urban transit systems.
Chart 3 decomposes the measure of hours worked for urban transit systems. From 2007 to 2013, a modest fall in employees’ average weekly hours (-0.6 percent per year) counteracted a similarly modest rise (0.6 percent per year) in industry employment. (Average weekly hours worked are equivalent to annual hours divided by 52.) As a result, total hours worked for the industry were about the same in 2013 as in 2007, increasing by an average 0.1 percent annually.
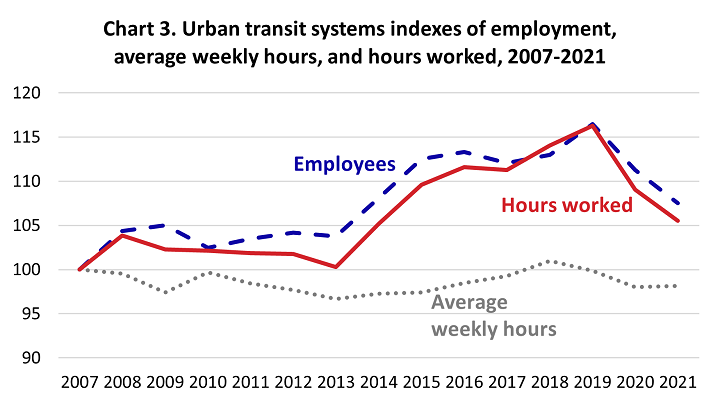
From 2013 to 2021, employment increased by an average of 0.4 percent per year, compared to a slight uptick in average hours worked per employee of 0.2 percent per year. Thus, industry hours worked rose by an average annual rate of 0.6 percent, mostly because there were more workers who each worked a relatively stable number of hours. This is still the case when considering the entire 2007-21 time period measured by BLS: growth in employment was responsible for all of the increase in total hours worked.
The BLS productivity program frequently defines the output of transportation industries (such as air transportation and line-haul railroads) as the distance passengers or freight are carried. Urban transit systems conforms to this precedent. Annual output is defined as the total number of miles that passengers travel in revenue service. These data come from the NTD and are given the acronym PMT (passenger miles traveled).
It is important to distinguish PMT from other types of data used in some measures of efficiency or effectiveness. These include passenger trips, vehicle miles, or seats available. While these alternative metrics have their uses, PMT are the superior data for measuring labor productivity. This is because PMT best capture the total volume of service consumed by the public.
The total expenses (operating expenses and capital expenses) of the transit modes serve as weights in the aggregation of PMT. In our model, total expenses serve as a proxy for the quality of the transit modes. We assume that municipalities are willing to pay more to build and operate modes of transportation that provide benefits such as speed, reliability, or comfort. Other benefits may accrue to the community such as traffic abatement or pollution reduction. In summary, transportation modes with higher total expenses (such as light rail) are assumed to be of higher quality, and are therefore given more weight in the industry output index.
Hours worked combines data from both NTD and APTA. APTA provides the count of total industry workers. APTA data are used because they include both directly operated employment (i.e. vehicles are operated directly by a transit agency’s own employees) as well as contracted employment. An adjustment is made to exclude the employment of transportation modes which fall outside the NAICS definition.
Hours worked are then calculated by multiplying the total employment by a measure of average employee hours. However, APTA does not report employee hours. Therefore, we use NTD data, which provide employee hours worked for all modes (albeit only for directly operated transit systems).
Productivity in transit: a new measure of labor productivity for urban transit systems
Industries at a Glance: Transit and Ground Passenger Transportation
Overview of BLS Productivity Statistics
[1] See pages 2 and 3 in APTA's Impact of COVID-19 on Public Transit Agencies policy brief from March 2020.
[3] Source: Productivity in Transit article, endnote 72
[5] The Department of Transportation’s National Household Transportation Survey measures the purposes of transit trips. However, the survey sample changed between the last two releases, in 2009 and 2017, to include more urban households and cell-phone-only households. This makes it difficult to compare survey results between the two releases.