An official website of the United States government
An official website of the United States government
The .gov means it's official.
Federal government websites often end in .gov or .mil. Before sharing sensitive information,
make sure you're on a federal government site.
The site is secure.
The
https:// ensures that you are connecting to the official website and that any
information you provide is encrypted and transmitted securely.
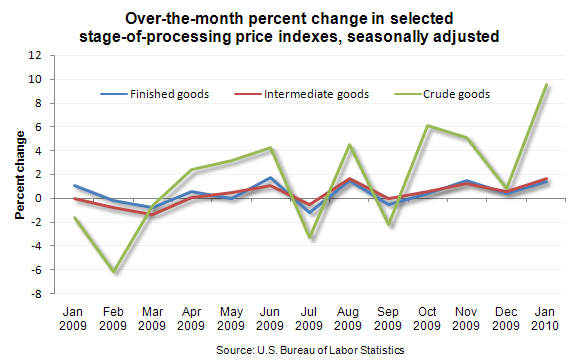
The Producer Price Index for Finished Goods rose 1.4 percent in January, seasonally adjusted. At the earlier stages of processing, prices received by manufacturers of intermediate goods climbed 1.7 percent, and the crude goods index jumped 9.6 percent.
In January, the increase of 1.4 percent in the Producer Price Index for Finished Goods followed a 0.4-percent advance in December and a 1.5-percent rise in November. About three-fourths of the broad-based January advance in the finished goods index can be traced to higher prices for energy goods, which jumped 5.1 percent. The indexes for finished goods less foods and energy and for finished consumer foods also contributed to the finished goods increase, rising 0.3 percent and 0.4 percent, respectively.
The Producer Price Index for Intermediate Materials, Supplies, and Components climbed 1.7 percent in January, its largest increase since a similar 1.7-percent advance in August 2009. Accounting for about three-fourths of the January rise, prices for intermediate energy goods jumped 6.9 percent. The index for intermediate materials less foods and energy also contributed to this advance, increasing 0.5 percent. By contrast, prices for intermediate foods and feeds fell 0.3 percent.
The Producer Price Index for Crude Materials for Further Processing climbed 9.6 percent in January. About three-quarters of this broad-based monthly advance is attributable to a 16.8-percent jump in prices for crude energy materials. Also contributing to the January increase, in roughly equal proportions, the index for crude nonfood materials less energy rose 6.6 percent and prices for crude foodstuffs and feedstuffs moved up 3.2 percent.
These data are from the BLS Producer Price Index program. To learn more, see "Producer Price Indexes — January 2010" (HTML) (PDF), news release USDL-10-0206. Indexes for September 2009 have been recalculated to incorporate late reports and corrections by respondents. All producer price indexes are subject to revision 4 months after original publication.
Bureau of Labor Statistics, U.S. Department of Labor, The Economics Daily, Producer prices in January 2010 — stage-of-processing indexes at https://www.bls.gov/opub/ted/2010/ted_20100225.htm (visited April 18, 2024).