An official website of the United States government
An official website of the United States government
The .gov means it's official.
Federal government websites often end in .gov or .mil. Before sharing sensitive information,
make sure you're on a federal government site.
The site is secure.
The
https:// ensures that you are connecting to the official website and that any
information you provide is encrypted and transmitted securely.
The Bureau of Labor Statistics (BLS) Labor Productivity and Costs (LPC) program produces quarterly estimates of labor productivity growth. For these estimates, BLS combines output data from the U.S. Bureau of Economic Analysis (BEA) with employment and hours data compiled from three BLS surveys: the Current Employment Statistics (CES) survey, the Current Population Survey (CPS), and the National Compensation Survey (NCS).1 Two of these data sources—the BEA output data and the CES employment and hours data—are revised multiple times after they are initially released.2 To convey the ranges of such revisions, beginning in 2021, the LPC news releases were updated to include intervals computed using the methodology discussed in this article.3 (See the box for new wording in the LPC news release about the size of the revisions.)
Changes to the language in the table notes in the labor productivity and costs (LPC) news release
The following “Reliability” note was included with the table notes in the LPC news releases through the fourth quarter of 2020:
RELIABILITY: Productivity and cost measures are regularly revised as more complete information becomes available. The measures are first published within 40 days of the close of the reference period; revisions appear 30 days later, and second revisions after an additional 60 days. In the business sector, the third publication (second revision) of a quarterly index of output per hour of all persons has differed from the initial value by between –1.4 and 1.4 index points approximately 95 percent of the time. This interval is based on the performance of this measure between the fourth quarter of 1995 and the third quarter of 2020.
The following “Size of Revisions” note replaced the earlier “Reliability” note and has been included with the table notes in the LPC news releases since the beginning of 2021:
SIZE OF REVISIONS: Productivity and cost measures are revised on a regular schedule as more complete data become available. The first estimate is published within 40 days of the close of the reference quarter, the second estimate approximately 30 days later, and the third estimate approximately 60 days after the second estimate. Based on past revisions, the third estimate of nonfarm business sector quarterly labor productivity growth has differed from the first estimate by –1.0 to +1.4 percentage point about 80 percent of the time. This interval is based on estimates for reference quarters from the first quarter of 2001 to the fourth quarter of 2020. For more about revisions to labor productivity growth, see “How large are revisions to estimates of quarterly labor productivity growth?” at www.bls.gov/osmr/research-papers/2021/ec210040.htm.
For each reference quarter, BLS releases three regularly scheduled estimates of labor productivity growth. The first preliminary estimate (prelim) is issued within 40 days of the end of the reference quarter. This initial estimate is revised as new data become available. The first revised estimate (R1) is released 30 days after prelim, and the second revised estimate (R2) is released 60 days after that. R2 is the last regularly scheduled release covering the reference period. The release dates of the prelim and R1 estimates are about 1 week after BEA’s “advance” and “second” release of gross domestic product (GDP) estimates. The R2 estimate is released at the same time as the prelim estimate of the following quarter, because the R1-to-R2 revisions are generally not large enough to warrant a separate news release. Subsequent revisions to the R2 estimates, such as those due to the BEA comprehensive revisions to the national income and product accounts, can be large and can occur long after the reference quarter. Thus, the estimates are never really “final.” In this article, we focus on revisions to the prelim and R1 estimates relative to the R2 estimates.4
Early GDP estimates are subject to substantial revisions because they are based on “partial and preliminary source data as well as trend projections when data are not available.”5 The source data for these early estimates “come from a mixture of survey, tax, and other business and administrative data as well as various indicators, such as heating degree days.”6 Another source of revisions to GDP is the recalculation of seasonal factors.
The main source of revisions to the hours data is revisions to the CES estimates. There are three regularly scheduled releases of estimates for each reference month. The first CES estimates are usually released on the first Friday after the reference month, and the second and third estimates are released in the following 2 months. These revisions are primarily due to the collection of additional data and the recalculation of seasonal adjustment factors. In addition, CES estimates for the previous year are revised each February, when the CES employment data are benchmarked to data from the Quarterly Census of Employment and Wages (QCEW) and seasonal adjustment models are updated.7 Revisions to hours growth are typically smaller than revisions to output growth.
The revisions described above result from what Manski refers to as “transitory uncertainty,” meaning that the estimates improve in quality as more data become available and estimates are revised.8 This uncertainty can be distinguished from conceptual uncertainty (such as ambiguity) or uncertainty resulting from sampling error. Manski argues that statistical agencies should do a better job of conveying uncertainty in official statistics.
A 2019 paper by Galvão, Mitchell, and Runge considers how best to convey information to the public about the magnitudes of revisions.9 After analyzing the views of both expert and general-public users of GDP growth statistics, the authors support presenting intervals that are based on historical revisions at the time the estimates are released. They conclude that it is more valuable to data users to quantify uncertainty than to provide qualitative descriptions. Galvão et al. also argue that quantifying uncertainty “decreases the chance that the public misinterprets the uncertainty information given to them” and “does not reduce trust in the statistical office or encourage the view that data revisions are due to vested interests at the ONS [the United Kingdom’s Office of National Statistics] or the Government.”10
Confidence intervals based on deviations from sample means are a standard way of conveying uncertainty in survey-based statistics such as the unemployment rate and payroll employment. But, as noted by Fixler, Kanal, and Tien, it is not feasible to calculate conventional confidence intervals for GDP estimates, because GDP estimates are compiled from a number of survey, nonsurvey, and administrative sources.11 Although BEA does not publish intervals for its advance GDP estimates, they can be constructed under the assumption that each revised estimate is a better estimate of a true value, by using the methods presented by Fixler, Greenaway-McGrevy, and Grimm and by Fixler, Kanal, and Tien.12 These intervals characterize the likely size of revisions.
Instead of standard confidence intervals, some organizations publish “prediction intervals” that are based on revisions to preliminary estimates.13 For example, for its revenue projections, the Australian Treasury reports 70- and 90-percent intervals that are based on historical forecasting errors. The Federal Reserve Board (FRB) produces 70-percent intervals for its Industrial Production Index (IPI) that are based on historical revisions to preliminary estimates.
For this study, we develop intervals that are based on historical revisions. Our focus is on prelim-to-R2 and R1-to-R2 revisions. We begin by summarizing the revisions and examining factors that might affect the size and direction of the revisions. We then consider alternative ways of constructing intervals for the quarterly estimates of aggregate U.S. nonfarm labor productivity growth. Our main focus is on estimates of growth from the previous quarter because those estimates receive the most attention. We report results for three alternative approaches to constructing intervals. The first approach is the modified confidence interval methodology discussed by Fixler, Greenaway-McGrevy, and Grimm and Fixler, Kanal, and Tien.14 The second approach is model based, which allows us to control for differences across quarters. And the third approach constructs intervals based on percentiles of historical revisions, similar to the reliability estimates for the FRB’s IPI. For each method, we generate 70-, 80-, and 90-percent intervals.
In the sections that follow, we describe the data, examine the sources of revisions, and compare methods for constructing prediction intervals. We also discuss special methods used for the 2020 estimates.
Our data cover reference quarters from Q1 2000 to Q4 2019.15 We excluded Q4 2018, because there was no preliminary estimate as a result of the U.S. federal government shutdown that occurred in early 2019.16 We experimented with extending the series back to the mid-1990s, but our analysis indicated that the nature and timing of revisions in the 1990s differed significantly from those in the 2000s and 2010s. (See the appendix.)
We begin our analysis by summarizing past revisions.17 We look at the magnitude and distribution of the revisions and consider whether there are systematic patterns that we could use to generate more precise intervals. Table 1 shows summary statistics for prelim-to-R2 and R1-to-R2 revisions for quarter-to-quarter and year-over-year productivity growth.
| Statistic | Quarter-to-quarter | Year-over-year | ||
|---|---|---|---|---|
| Prelim-to-R2 | R1-to-R2 | Prelim-to-R2 | R1-to-R2 | |
Mean | 0.14 | 0.04 | 0.03 | -0.01 |
Median | 0.30 | 0.10 | 0.10 | 0.00 |
10th percentile | -1.10 | -0.50 | -0.50 | -0.20 |
90th percentile | 1.30 | 0.60 | 0.40 | 0.20 |
Standard deviation | 1.04 | 0.64 | 0.32 | 0.24 |
Skewness | -1.17 | -0.76 | -0.99 | -1.69 |
Kurtosis | 5.41 | 7.10 | 3.53 | 7.31 |
Number of sign changes | 7 | 6 | 3 | 1 |
Number of observations | 79 | 79 | 79 | 79 |
Note: Data for fourth quarter 2018 were missing (prelim-to-R2 revisions) or excluded (R1-to-R2 revisions) because of the U.S. federal government shutdown that occurred from December 22, 2018, to January 25, 2019. Skewness and kurtosis for a normal distribution would be 0.0 and 3.0, respectively. Prelim = first preliminary labor productivity and costs (LPC) estimates; R1 = first revised LPC estimates; R2 = second revised LPC estimates; Q1 = first quarter; Q4 = fourth quarter. Growth estimates are in percent. Source: U.S. Bureau of Labor Statistics. | ||||
Looking at the quarter-to-quarter revisions, we see that both mean and median R1-to-R2 revisions are substantially smaller than the prelim-to-R2 revisions. The mean of 0.14 for the prelim-to-R2 revisions suggests a slight downward bias in the preliminary release, but it is not statistically significant. We also see that there is considerably more variability in the prelim-to-R2 revisions—the standard deviation is more than 60 percent larger than that for R1-to-R2 revisions, and the difference between the 90th percentile and the 10th percentile is more than twice as large for the prelim-to-R2 revisions. The skewness statistics indicate that both distributions are left skewed, but the R1-to-R2 revisions are less so.18 The kurtosis statistics indicate that most of the mass is concentrated in the center of the distribution, with the distribution of R1-to-R2 revisions being more concentrated, as can also be seen by comparing the 90–10 ranges. The revisions resulted in the estimate changing sign in slightly less than 10 percent of the quarters examined. This is higher than the fraction of sign changes for revisions to GDP found by Sinclair and Stekler.19 However, about half of these sign changes were due to revisions that were less than one percentage point in absolute value. One reason for the larger number of sign changes in the LPC data compared with GDP data is that the LPC data exclude the government-sector output, which tends to have much smaller revisions. Together, these statistics indicate that there is no systematic bias in the quarter-to-quarter revisions and that R1 predicts R2 better than prelim does.
Charts 1a and 1b show the distributions of prelim-to-R2 and R1-to-R2 revisions of quarter-to-quarter productivity growth over the 2000–19 period.
We can see from the charts that much of the deviation from normality is due to several rather large revisions. To see the impact of these outliers, we recalculated the statistics in table 1, dropping revisions that were larger than 2 percentage points in absolute value. The recalculated mean revision, 0.3, is larger and is statistically significant. The skewness and kurtosis statistics of –0.08 and 3.15 are about the same as for a normal distribution. The distribution is closer to normal after outliers are excluded.
To check for bias, we estimated a series of ordinary least squares regressions to determine whether there is evidence of a trend and whether the prelim-to-R2 and R1-to-R2 revisions are correlated with prelim or R1. We found no evidence of a time trend in either the value or magnitude of either revision. Similarly, there is no evidence that the revisions are related to the value or magnitude of the preliminary estimates (prelim or R1).20
The right two columns of table 1 show summary statistics for revisions to estimates of year-over-year productivity growth. Comparing revisions to year-over-year estimates with revisions to quarter-to-quarter estimates, we see that the former are substantially smaller and more tightly distributed. The main reason for the smaller revisions to year-over-year estimates is that the estimates of quarter-to-quarter productivity growth are expressed as an annual rate. This means that the revisions also are annualized, which results in those revisions being approximately 4 times as large. For this reason, and because quarter-to-quarter estimates receive the most attention from data users, the rest of this article focuses on revisions to the quarter-to-quarter estimates.
Quarterly variation in the revisions can arise because of the timing of regularly scheduled revisions to source data. Table 2 shows the schedule of releases and regularly scheduled revisions.
| Month | Labor productivity and costs news release |
|---|---|
February | Prelim for Q4 of previous year, R2 for Q3 of previous year |
March | R1 for Q4 of previous year[1] |
May | Prelim for Q1 of present year, R2 for Q4 of previous year |
June | R1 for Q1 of present year |
August | Prelim for Q2 of present year, R2 for Q1 of present year[2] |
September | R1 for Q2 of present year |
November | Prelim for Q3 of present year, R2 for Q2 of present year |
December | R1 for Q3 of present year |
[1] Incorporates the annual CES benchmark revision through Q4 of the previous year. This affects data for hours worked for both the current and prior quarters. [2] Both prelim and R2 estimates incorporate the annual benchmark revisions to the national income and product accounts estimates of gross domestic product (current and prior quarter output), which are produced by U.S. Bureau of Economic Analysis. Note: Labor productivity estimates are a Principal Federal Economic Indicator. Prelim = first preliminary labor productivity and costs (LPC) estimates; R1 = first revised LPC estimates; R2 = second revised LPC estimates; Q1 = first quarter; Q2 = second quarter; Q3 = third quarter; Q4 = fourth quarter. Source: U.S. Bureau of Labor Statistics. | |
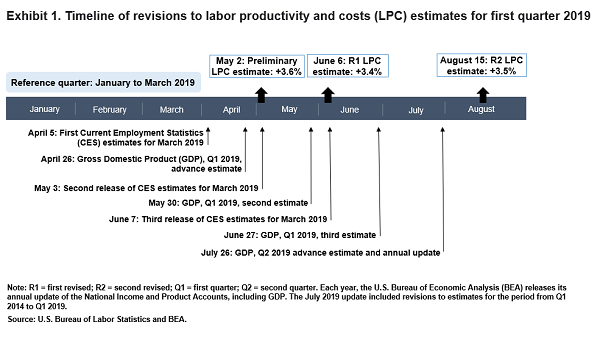
There are two annual revisions that result in systematic differences in revisions across quarters. First, each July, BEA makes annual revisions to the GDP estimates for the previous calendar year. These are first used in productivity statistics in the August release of the preliminary estimates for Q2 and the R2 estimates for Q1, which are affected because the Q1 growth rate is calculated relative to the (revised) Q4 output.21 Second, each February, CES employment estimates are benchmarked to the QCEW data, seasonal adjustment models are updated, and 5 years of seasonally adjusted data are revised.22 This revision is reflected in the R1 estimates for Q4 productivity growth, which are published in March.23 Exhibit 1 shows the timing of news releases and revisions to the data for Q1 2019.
Tables 3a and 3b show the average revisions to estimates of nonfarm business sector labor productivity growth by reference quarter.
| Period | N | Mean | Standard deviation | Minimum | Maximum | Mean absolute revision | Number of sign changes |
|---|---|---|---|---|---|---|---|
All quarters | 79 | 0.14 | 1.04 | -3.8 | 2.2 | 0.76 | 7 |
Q1 | 20 | -0.24 | 1.09 | -2.8 | 1.1 | 0.76 | 4 |
Q2 | 20 | 0.49 | 0.67 | -0.9 | 2.2 | 0.62 | 0 |
Q3 | 20 | 0.24 | 1.10 | -2.3 | 1.7 | 0.88 | 0 |
Q4 | 19 | 0.07 | 1.18 | -3.8 | 2.0 | 0.77 | 3 |
Note: Data for fourth quarter 2018 were missing because of the U.S. federal government shutdown that occurred from December 22, 2018, to January 25, 2019. N = number of observations; prelim = first preliminary labor productivity and costs (LPC) estimates; R2 = second revised LPC estimates; Q1 = first quarter; Q2 = second quarter; Q3 = third quarter; Q4 = fourth quarter. Growth estimates are in percent. Source: U.S. Bureau of Labor Statistics. | |||||||
| Period | N | Mean | Standard deviation | Minimum | Maximum | Mean absolute revision | Number of sign changes |
|---|---|---|---|---|---|---|---|
All quarters | 79 | 0.04 | 0.64 | -2.40 | 2.00 | 0.43 | 6 |
Q1 | 20 | -0.10 | 1.06 | -2.40 | 2.00 | 0.72 | 4 |
Q2 | 20 | 0.12 | 0.47 | -0.70 | 1.40 | 0.37 | 0 |
Q3 | 20 | 0.02 | 0.48 | -1.00 | 1.30 | 0.35 | 1 |
Q4 | 19 | 0.13 | 0.30 | -0.60 | 0.50 | 0.26 | 1 |
Note: Data for fourth quarter 2018 were excluded because of the U.S. federal government shutdown that occurred from December 22, 2018, to January 25, 2019. N = number of observations; R1 = first revised labor productivity and costs (LPC) estimates; R2 = second revised LPC estimates; Q1 = first quarter; Q2 = second quarter; Q3 = third quarter; Q4 = fourth quarter. Growth estimates are in percent. Source: U.S. Bureau of Labor Statistics. | |||||||
The tables show that revisions to Q1 data are negative, on average, while revisions to Q2–Q4 data tend to be positive, with the largest revisions occurring for Q2 data. This is true for prelim-to-R2 and R1-to-R2 revisions, although the R1-to-R2 revisions are smaller.
To investigate this issue further, we examined quarterly variation in a regression framework and found differences across quarters to be similar to those in tables 3a and 3b.24 Only the prelim-to-R2 revisions for Q2 were statistically different from zero. The coefficients on the quarterly dummy variables were not statistically different from one another except when comparing Q1 with Q2.
To better understand the magnitude and quarterly variability of revisions, it is useful to know what is driving them. Are revisions due mainly to revisions to output or hours? And are they due to revisions to current-quarter or prior-quarter data? And for which quarters do revisions to output and hours have the greatest impact on measured labor productivity?
To address these questions, we decomposed revisions to labor productivity growth into revisions to current and prior quarter output and hours. To simplify the decompositions, we express labor productivity growth as the difference in the natural logs of the output and labor indexes, which makes it straightforward to decompose the revisions. Labor productivity growth for quarter t can be written as follows:

where Q and L are indexes of real output and total hours worked, and the subscripts indicate the quarter. The four terms in this equation represent the four sources of revisions noted previously. Under this specification, the prelim-to-R2 revision to labor productivity growth is defined as follows:


where the superscripts indicate the news release. This equation can be rewritten as follows:

 .
.
This equation illustrates the four sources of revisions: the first term is the amount of the revision that can be attributed to revisions to current quarter output, the second is the contribution of revisions to prior quarter output, and the last two terms are the analogous measures for revisions to hours. A similar expression can be written for the R1-to-R2 revisions. As before, we used data from Q1 2000 to Q4 2019 (excluding Q4 2018).
Tables 4a and 4b show the average values for each term in equation (1) for prelim-to-R2 and R1-to-R2 revisions and for the average revision to quarterly labor productivity growth.
| Period | Average revision to output | Average revision to hours | Total | ||
|---|---|---|---|---|---|
| Current quarter | Previous quarter | Current quarter | Previous quarter | ||
All quarters | -0.16 | -0.27 | -0.06 | -0.05 | 0.13 |
Q1 | -1.29 | -1.01 | -0.15 | -0.12 | -0.25 |
Q2 | 0.25 | -0.13 | -0.11 | 0.00 | 0.49 |
Q3 | 0.38 | 0.02 | 0.32 | 0.18 | 0.22 |
Q4 | 0.04 | 0.04 | -0.32 | -0.25 | 0.07 |
Note: Data for fourth quarter 2018 were missing because of the U.S. federal government shutdown that occurred from December 22, 2018, to January 25, 2019. Prelim = first preliminary labor productivity and costs (LPC) estimates; R2 = second revised LPC estimates; Q1 = first quarter; Q2 = second quarter; Q3 = third quarter; Q4 = fourth quarter. Growth estimates are in percent. Source: U.S. Bureau of Labor Statistics. | |||||
| Period | Average revision to output | Average revision to hours | Total | ||
|---|---|---|---|---|---|
| Current quarter | Previous quarter | Current quarter | Previous quarter | ||
All quarters | -0.29 | -0.30 | 0.00 | 0.02 | 0.03 |
Q1 | -1.26 | -1.07 | -0.23 | -0.16 | -0.12 |
Q2 | -0.04 | -0.13 | -0.05 | 0.00 | 0.14 |
Q3 | 0.04 | 0.01 | 0.29 | 0.26 | -0.01 |
Q4 | 0.13 | 0.00 | -0.03 | -0.04 | 0.12 |
Note: Data for fourth quarter 2018 were excluded because of the U.S. federal government shutdown that occurred from December 22, 2018, to January 25, 2019. R1 = first revised labor productivity and costs (LPC) estimates; R2 = second revised LPC estimates; Q1 = first quarter; Q2 = second quarter; Q3 = third quarter; Q4 = fourth quarter. Growth estimates are in percent. Source: U.S. Bureau of Labor Statistics. | |||||
We multiplied each term by 4 so that quarterly changes and revisions are consistent with the annualized growth rates reported in the LPC news release. Note that the average revisions calculated from our decompositions are about the same as the average revisions reported in table 1.
The decompositions of prelim-to-R2 revisions in table 4a reveal that the largest portion of the revision to labor productivity is due mainly to revisions to output, rather than revisions to hours. This finding is consistent with a study by Anderson and Kliesen that uses data through 2005.25 Taking the difference between the current and previous quarter revisions to output yields a net revision of 0.12 percentage point, which accounts for 88 percent of the total revision. Revisions to hours account for the remaining 12 percent (0.02 percentage point). Note that the revisions to current and prior quarter output tend to be in the same direction and therefore largely offset each other. The same is true for hours. For prelim-to-R2 revisions, the correlation between current and prior quarter output revisions is 0.89. For hours, this correlation is even higher, 0.98.
Table 4a also highlights large differences in revisions by quarter, which are mainly due to the revision schedules of the source data. The largest revisions to output occur for first quarter estimates. The revisions to first quarter output estimates tend to be large because they reflect BEA’s annual GDP revisions (through Q4 of the previous year) that are released in July and are reflected in the R2 estimates for Q1. These revisions directly affect the estimates of the previous year’s Q4 output. (See table 2.) They also indirectly affect the estimates of the current year’s Q1 output, because the current year’s Q1 output growth is calculated relative to the (revised) Q4 output estimate. The revisions to hours are largest for Q3 and Q4.
Table 4b summarizes the R1-to-R2 revisions. As with the prelim-to-R2 revisions, the largest revisions to output occur for Q1 estimates. The revisions to prior quarter output (Q4 of the previous year) are nearly the same for prelim-to-R2 and R1-to-R2 revisions, because BEA’s annual revision affects the R2 estimate as noted previously (and in table 2). The revisions to current quarter output are of a similar magnitude as revisions to previous quarter output—again, this is because Q1 output is calculated as the growth in output relative to the revised Q4 output. Revisions to hours are largest for Q1 and Q3. As with prelim-to-R2 revisions, revisions to current and prior quarter output and hours are highly correlated. Comparing R1-to-R2 revisions to prelim-to-R2 revisions, the correlation between current and prior quarter revisions are higher for output (0.96 versus 0.89) and the same for hours (0.98).
The main difference between prelim-to-R2 and R1-to-R2 revisions is that the R1-to-R2 revisions to current quarter output are much smaller for Q2 and Q3. The smaller revisions to output growth in the R1-to-R2 revisions account for a substantial share of the overall difference between prelim-to-R2 and R1-to-R2 revisions. The smaller revisions to output in Q2 and Q3 result in output accounting for only about one-third of the average revision to labor productivity growth over all quarters, compared with almost 90 percent for prelim-to-R2 revision.
This analysis gives us a better understanding of the nature of the revisions. Although there are considerable differences in the revisions to output and hours, there does not seem to be any obvious way to use this information to construct narrower intervals for a given level of significance. The analysis does suggest that efforts to improve preliminary estimates of output would have a larger impact on reducing revisions than efforts to improve preliminary estimates of hours.
Our sample period includes two recessions, which allows us to examine whether revisions to output and hours for these recession quarters differ from nonrecession quarters. According to the National Bureau of Economic Research (NBER), which determines the starting and ending dates of recessions primarily on the basis of GDP growth, the two recessions that occurred during our sample period were from March 2001 to November 2001 and from December 2007 to June 2009 (the latter is often called the Great Recession).26 We also considered a second definition that extends the NBER definition to include months after the official end of the recession through the month during which the unemployment rate peaked. By this definition, the recessions extended from March 2001 to June 2003 and from December 2007 to October 2009. Since the start and end dates of the recessions do not exactly coincide with calendar quarters, we consider a quarter to be a recession quarter if it contains at least two recession months.
Tables 5a and 5b compare summary statistics for recession and nonrecession quarters.
| Sample | N | Mean | Standard deviation | Minimum | Maximum | Number of sign changes |
|---|---|---|---|---|---|---|
Revisions | 79 | 0.14 | 1.04 | -3.80 | 2.20 | 7 |
Absolute value of revisions | 79 | 0.76 | 0.72 | 0.00 | 3.80 | [1] |
Statistics based on NBER-defined recession quarters | ||||||
Revisions in nonrecession quarters | 70 | 0.18 | 0.94 | -2.80 | 2.20 | 6 |
Revisions in recession quarters | 9 | -0.16 | 1.71 | -3.80 | 2.00 | 1 |
Absolute revisions in nonrecession quarters | 70 | 0.70 | 0.64 | 0.00 | 2.80 | [1] |
Absolute revisions in recession quarters | 9 | 1.22 | 1.13 | 0.30 | 3.80 | [1] |
Statistics based on labor-defined recession quarters | ||||||
Revisions in nonrecession quarters | 63 | 0.16 | 0.90 | -2.80 | 2.20 | 5 |
Revisions in recession quarters | 16 | 0.07 | 1.51 | -3.80 | 2.00 | 2 |
Absolute revisions in nonrecession quarters | 63 | 0.66 | 0.63 | 0.00 | 2.80 | [1] |
Absolute revisions in recession quarters | 16 | 1.13 | 0.96 | 0.00 | 3.80 | [1] |
[1] Not applicable. Note: Data for fourth quarter 2018 were missing because of the U.S. federal government shutdown that occurred from December 22, 2018, to January 25, 2019. N = number of observations; prelim = first preliminary labor productivity and costs (LPC) estimates; R2 = second revised LPC estimates; Q1 = first quarter; Q2 = second quarter; Q3 = third quarter; Q4 = fourth quarter; NBER = National Bureau of Economic Research. Growth estimates are in percent. Source: U.S. Bureau of Labor Statistics. | ||||||
| Sample | N | Mean | Standard deviation | Minimum | Maximum | Number of sign changes |
|---|---|---|---|---|---|---|
Revisions | 79 | 0.04 | 0.64 | -2.40 | 2.00 | 6 |
Absolute value of revisions | 79 | 0.43 | 0.48 | 0.00 | 2.40 | [1] |
Statistics based on NBER-defined recession quarters | ||||||
Revisions in nonrecession quarters | 70 | 0.07 | 0.66 | -2.40 | 2.00 | 6 |
Revisions in recession quarters | 9 | -0.17 | 0.52 | -1.20 | 0.30 | 0 |
Absolute revisions in nonrecession quarters | 70 | 0.43 | 0.50 | 0.00 | 2.40 | [1] |
Absolute revisions in recession quarters | 9 | 0.38 | 0.38 | 0.30 | 1.20 | [1] |
Statistics based on labor-defined recession quarters | ||||||
Revisions in nonrecession quarters | 63 | 0.07 | 0.68 | -2.40 | 2.00 | 6 |
Revisions in recession quarters | 16 | -0.09 | 0.49 | -1.20 | 0.40 | 0 |
Absolute revisions in nonrecession quarters | 63 | 0.44 | 0.52 | 0.00 | 2.40 | [1] |
Absolute revisions in recession quarters | 16 | 0.35 | 0.33 | 0.00 | 1.20 | [1] |
[1] Not applicable. Note: Data for fourth quarter 2018 were excluded because of the U.S. federal government shutdown that occurred from December 22, 2018, to January 25, 2019. N = number of observations; R1 = first revised labor productivity and costs (LPC) estimates; R2 = second revised LPC estimates; Q1 = first quarter; Q2 = second quarter; Q3 = third quarter; Q4 = fourth quarter; NBER = National Bureau of Economic Research. Growth estimates are in percent. Source: U.S. Bureau of Labor Statistics. | ||||||
Under both definitions, revisions are somewhat larger for recession quarters, compared with nonrecession quarters. However, this difference is mostly driven by the large downward revision of 3.8 percent to the Q4 2008 preliminary estimate.27 If this observation is excluded, revisions for recession and nonrecession quarters (either definition) are not significantly different from each other.
This analysis implies that there is no information in the revision history that can be used to substantially improve preliminary estimates or to construct narrower intervals. This finding is consistent with studies by Aruoba, who finds that productivity revisions are partly predictable but not well behaved, and Jacobs and van Norden, who find that revisions to productivity are large because revisions to output and labor inputs are not highly correlated.28
Our intervals differ from standard confidence intervals in that we estimate bounds for a single observation. Our goal is to calculate intervals around prelim and R1 estimates such that the R2 estimates fall within those bounds a given percent of the time. We consider three alternative methods for estimating 70-, 80-, and 90-percent intervals.
The first method is a modified version of standard confidence intervals. The second method is a model-based approach. The third method constructs the intervals using a percentile approach. The modified confidence interval is discussed in the articles by Fixler, Greenaway-McGrevy, and Grimm and by Fixler, Kanal, and Tien for the preliminary BEA estimates of GDP,29 while the percentile method is used by the Fed for preliminary estimates of its Industrial Production Index (IPI). The model-based approach allows us to control for quarterly variation in revisions (and potentially other factors as well). We describe these methods for prelim-to-R2 revisions with the understanding that estimates for R1-to-R2 revisions are calculated in the same way.
The first method we considered is a modified version of the standard confidence interval method that is based on the standard deviation of historical revisions, which is the same formula presented by Fixler et al. (2014).30 The modified confidence intervals are given by the following formula:


where “prelim” is the preliminary estimate,  is the average prelim-to-R2 revision, and
  is the critical value for α level of significance for a normal distribution. For a given value of α, we would expect the revision to prelim to be within these bounds 1 ─ α percent of the time. The upper and lower bounds of the interval are centered on the average value of the prelim-to-R2 revision. To adjust the interval so that it is relative to the value of prelim, we add the value of prelim to the upper and lower bounds.
Our model-based intervals are generated within a regression framework. One advantage of this approach is that it provides a convenient way to incorporate additional information, such as allowing intervals to vary by quarter. The general strategy is to estimate an ordinary least squares regression of R2 on prelim and use the results of that regression to construct an interval. We first estimated the following regressions on prior quarter data on prelim (R1) and R2:

and
 .
.
For the current quarter, q, we generated a predicted value for R2,  , and then constructed an interval around using the following equation:


where  is the predicted value of R2 for quarter q from the regression,
  is the root-mean-square error from the regression, and
  is the variance of the preliminary estimate. The interpretation of these intervals differs from the modified confidence intervals described above. Here the interval is centered on the predicted value of R2 and tells us the likely values of R2 given a particular value of prelim (or R1). To adjust the interval so that it is relative to the value of prelim, we subtract prelim from the upper and lower bounds.
Table 6 shows the estimated coefficients from equations (4) and (4′) estimated over all 79 observations (Q1 2000 to Q4 2019).
| Statistic | Dependent variable: R2 | |||
|---|---|---|---|---|
| Equation (4) | Equation (4′) | |||
| Coefficient | Standard error | Coefficient | Standard error | |
Prelim | 0.995 | 0.052 | [1] | [1] |
R1 | [1] | [1] | 0.976 | 0.029 |
Constant | 0.149 | 0.157 | 0.091 | 0.096 |
R-squared | 0.828 | [1] | 0.935 | [1] |
[1] Not applicable. Note: Sample period is first quarter 2000 to fourth quarter 2019. Data for fourth quarter 2018 were missing (prelim-to-R2 revisions) or excluded (R1-to-R2 revisions) because of the U.S. federal government shutdown that occurred from December 22, 2018, to January 25, 2019. Prelim = first preliminary labor productivity and costs (LPC) estimates; R1 = first revised LPC estimates; R2 = second revised LPC estimates. Source: U.S. Bureau of Labor Statistics. | ||||
The coefficients from equation (4) imply that preliminary and R2 estimates move together, but that the R2 estimate is about 0.15 percentage point larger, on average, than the prelim estimate. This is consistent with the mean revision shown in table 1. The constant is not statistically significantly different from zero, so we conclude that the preliminary estimate is not systematically biased. The results for equation (4′), for R1-to-R2 revisions, are similar, although the constant is somewhat larger than the mean R1-to-R2 revision shown in table 1. To account for the quarterly variation in revisions, we also estimated equations (4) and (4´) with quarterly dummy variables and recalculated the intervals.
There are two issues with the modified confidence interval and model-based approaches. First, they assume that the historical prediction errors are normally distributed, which the data in table 1 show is not the case. And second, these intervals are calculated using squared deviations, which place greater importance on outliers. The percentile approach differs from these approaches in that it does not require any distributional assumptions and outliers are not overweighted. As with the modified confidence intervals, we calculate intervals using revisions. Under this approach, the upper and lower bounds of, say, a 70-percent interval are calculated using the values of revisions at the 85th and 15th percentiles of the distribution.
One drawback to this approach is that it is potentially sensitive to the method used to calculate the percentiles. This is likely to be the case if there is a large difference between the two observations surrounding a given percentile, and it is especially likely when working with small samples. To illustrate, if the sample has exactly 100 observations, then each percentile is determined exactly. However, if the two adjacent percentiles are very different, then this method will be sensitive to the inclusion or exclusion of a single observation. When the number of observations is less than 100 (as is the case with our data), the percentile will lie between two observations. We consider three variations of the percentile approach: simple percentile, nearest percentile, and weighted percentile.
Like the modified confidence intervals, these intervals are for the revisions, but they are centered (approximately) on the median revision. To adjust the intervals so that they are relative to the value of prelim, we add prelim to the upper and lower bounds.
The simple percentile approach uses the value of the first observation below the desired percentile for the lower bound and the value of the first observation above the desired percentile for the upper bound. This approach potentially results in intervals that are wider than necessary. The nearest percentile uses the value of the observation whose percentile rank is closest to the desired percentile. To illustrate, for the 95th percentile (the upper bound of a 90-percent interval) the two observations surrounding the 95th percentile are the 75th (94.9 percentile) and 76th (96.2 percentile) largest observations. The value of the 76th observation would be used for the simple percentile, while the value of the 75th observation would be used for the nearest percentile method. Note that, given the compactness of the distribution, these observations often have the same value. The simple and nearest percentiles will differ only when the nearest percentile is below (above) the upper (lower) bound of the interval.
Weighted percentile prediction intervals differ from the simple and nearest percentile prediction intervals in that they account for the information contained in both of the surrounding observations. In the example described in the previous paragraph, the weighted percentile will be a weighted average of the simple and nearest percentile. Specifically, for each percentile, we used a weighted average of the values of the two surrounding observations, where the weights are equal to those numbers’ distances from the stated percentile.
To calculate the lower weighted percentile, we sorted the data by size of revision and used the following formula:


where subscript 1 denotes the first observation below the desired percentile and subscript 2 denotes the first observation above the desired percentile. The lower subscript indicates the lower bound of the specified interval (5, 10, or 15 for 90-, 80-, or 70-percent intervals). The formula for the upper weighted percentile is analogous:


In cases in which the two numbers above and below the desired percentile are the same, the weighted percentile confidence interval is the same as the simple (and nearest) percentile confidence interval. But, in general, we would expect the weighted confidence interval to be narrower than the simple percentile and wider than the nearest percentile.
In this section, we compare results from the different methods. For each methodology, we show the upper and lower bounds of the intervals, and the width of the interval, for 90-percent, 80-percent and 70-percent intervals. Our goal is to compare the methods with respect to the frequency that R2 falls within the interval around prelim. To make this comparison, we express the upper and lower bounds of the intervals relative to prelim (or R1).
Our cross-validation methodology compares the methods using a leave-one-out approach to determine whether the intervals perform “as advertised.” That is, we wish to determine whether the percent of R2 values that fall within the specified interval is close to the stated confidence level for each methodology.
Typically, validation is done by generating the interval using the first N – 1 observations and testing the method using the omitted observation. The leave-one-out approach that we use for cross validation increases the number of test cases. For each interval method, revision type (prelim-to-R2 or R1-to-R2), and confidence level (70, 80, or 90 percent), we
(1) Drop the first observation and estimate intervals as described above using the remaining 78 observations.
(2) Repeat step (1), replacing the first observation and omitting the second observation. This process is repeated for each subsequent observation, in sequence. Thus, for each observation, we have the following:
a. A value for prelim
b. A value for R2
c. An interval around prelim
(3) For each observation, determine whether R2 lies within the interval around prelim.
(4) For each revision x, method x confidence-level cell, we calculate the “hit rate,” which is the fraction of R2 values that lie within the interval constructed around prelim (R1).
Table 7a shows our results for prelim-to-R2 revisions. The table shows the average value of the upper and lower bounds relative to the value of prelim, the interval width, and the fraction quarters in which the value of R2 falls within the interval.
| Method | Lower[1] | Upper[1] | Interval width[1] | Percent in interval |
|---|---|---|---|---|
90-percent intervals | ||||
Modified confidence interval | -1.57 | 1.84 | 3.41 | 89.9 |
Model based | -1.63 | 1.91 | 3.54 | 89.9 |
With quarterly dummy variables | -1.60 | 1.88 | 3.48 | 89.9 |
Percentile: | ||||
Simple | -2.40 | 1.69 | 4.09 | 91.1 |
Nearest | -2.29 | 1.49 | 3.79 | 88.6 |
Weighted | -2.31 | 1.51 | 3.82 | 88.6 |
80-percent intervals | ||||
Modified confidence interval | -1.19 | 1.47 | 2.66 | 84.8 |
Model based | -1.23 | 1.51 | 2.75 | 83.5 |
With quarterly dummy variables | -1.21 | 1.49 | 2.70 | 81.0 |
Percentile: | ||||
Simple | -1.19 | 1.30 | 2.49 | 82.3 |
Nearest | -1.08 | 1.30 | 2.38 | 81.0 |
Weighted | -1.10 | 1.30 | 2.40 | 81.0 |
70-percent intervals | ||||
Modified confidence interval | -0.94 | 1.21 | 2.15 | 76.0 |
Model based | -0.97 | 1.25 | 2.22 | 76.0 |
With quarterly dummy variables | -0.95 | 1.23 | 2.18 | 78.5 |
Percentile: | ||||
Simple | -0.89 | 1.08 | 1.97 | 70.9 |
Nearest | -0.75 | 1.00 | 1.75 | 69.6 |
Weighted | -0.79 | 1.03 | 1.82 | 69.6 |
[1] Average over all calculated intervals. Interval widths may not be consistent with upper and lower bounds because of rounding. Note: Sample period is first quarter 2000 to fourth quarter 2019. Data for fourth quarter 2018 were missing because of the U.S. federal government shutdown that occurred from December 22, 2018, to January 25, 2019. Prelim = first preliminary labor productivity and costs (LPC) estimates; R2 = second revised LPC estimates. Growth estimates are in percent. Source: U.S. Bureau of Labor Statistics. | ||||
As expected, the 90-percent intervals are the widest, followed by the 80- and 70-percent intervals. All of the methodologies generate fairly similar intervals. The modified confidence intervals and model-based intervals are narrower than the percentile intervals at the 90-percent confidence level, but they are wider at the 80- and 70-percent levels. The hit rates at the 90-percent and 80-percent levels are about the same as (or a little higher than) the stated confidence level. But at the 70-percent level, the hit rates for the modified confidence intervals and the model-based intervals are substantially higher than the stated confidence level, whereas the hit rates for the percentile intervals are about 70 percent. The larger difference in hit rates across methods for the 70-percent intervals occurs because there is a lot more bunching at the 15th and 85th percentiles than at the 5th and 95th percentiles.31 Thus small differences in the 70-percent interval can have a large impact on the hit rate. This explains why the three percentile methods have different hit rates even though the average interval widths are nearly the same.
The model-based approach allows us to control for quarterly differences in the size of the average revision, but, as can be seen in table 7a, controlling for quarterly variation in revisions made little difference in the width of the intervals.
The story is somewhat different for R1-to-R2 revisions, as shown in table 7b. Here, the biggest differences between the methods show up in the 70-percent intervals. The model-based and modified confidence-interval approaches generate much wider intervals than the three percentile approaches because their formulas square prediction errors, which gives greater weight to outliers. Recall that most of the mass of the distribution of R1-to-R2 revisions is concentrated in the center of the distribution. The differences in the upper and lower bounds of the 90-percent intervals are fairly small because all observations at these ends of the distribution are, in a sense, outliers.
| Method | Lower[1] | Upper[1] | Interval width[1] | Percent in interval |
|---|---|---|---|---|
90-percent intervals | ||||
Modified confidence interval | -1.02 | 1.10 | 2.11 | 88.6 |
Model based | -1.05 | 1.13 | 2.18 | 89.9 |
With quarterly dummy variables | -1.06 | 1.14 | 2.20 | 88.6 |
Percentile: | ||||
Simple | -1.30 | 1.29 | 2.59 | 92.4 |
Nearest | -1.28 | 1.07 | 2.35 | 88.6 |
Weighted | -1.28 | 1.09 | 2.37 | 88.6 |
80-percent intervals | ||||
Modified confidence interval | -0.78 | 0.86 | 1.64 | 87.3 |
Model based | -0.81 | 0.89 | 1.69 | 87.3 |
With quarterly dummy variables | -0.81 | 0.89 | 1.71 | 87.3 |
Percentile: | ||||
Simple | -0.59 | 0.59 | 1.18 | 81.0 |
Nearest | -0.50 | 0.50 | 1.00 | 81.0 |
Weighted | -0.52 | 0.52 | 1.04 | 81.0 |
70-percent intervals | ||||
Modified confidence interval | -0.62 | 0.71 | 1.33 | 86.1 |
Model based | -0.64 | 0.72 | 1.37 | 87.3 |
With quarterly dummy variables | -0.63 | 0.73 | 1.38 | 83.5 |
Percentile: | ||||
Simple | -0.40 | 0.50 | 0.90 | 78.5 |
Nearest | -0.40 | 0.48 | 0.88 | 72.2 |
Weighted | -0.40 | 0.49 | 0.89 | 72.2 |
[1] Average over all calculated intervals. Interval widths may not be consistent with upper and lower bounds because of rounding. Note: Sample period is first quarter 2000 to fourth quarter 2019. Data for fourth quarter 2018 were excluded because of the U.S. federal government shutdown that occurred from December 22, 2018, to January 25, 2019. R1 = first revised labor productivity and costs (LPC) estimates; R2 = second revised LPC estimates. Growth estimates are in percent. Source: U.S. Bureau of Labor Statistics. | ||||
All of the intervals were calculated from growth rates that were calculated to a single decimal place of precision (as were the published estimates). However, for later years (2006 onward), growth rates are available at a much greater level of precision (thousandths instead of tenths). To see if this mattered, we recalculated the intervals using the more precise estimates. For the earlier years, we perturbed single-decimal estimates, by adding a uniformly distributed random term, U(–0.05, 0.05), to each estimate, and then recalculated the intervals. We repeated this exercise 100 times. For each iteration, we calculated an average of the intervals. We then calculated an average of the averages. The results were virtually identical to those reported in tables 7a and 7b.
The percentile methods generate hit rates that are very close to the stated confidence level, they are less sensitive to outliers than the other approaches, and weighted percentile method is relatively easy to calculate and explain to users. Based on these results, the reliability note in the LPC news release was modified in 2021 to reflect the change to include 80-percent intervals for labor productivity growth. These intervals were calculated using the weighted percentile method and the most recent 20 years of data. (See the box for the change in wording.)
The choice of reporting 80-percent intervals was determined by looking at the tradeoff between confidence level and interval width. For prelim-to-R2 revisions, going from 70- to 80-percent intervals, the average interval width increases by 0.58 (32 percent). But going from 80- to 90-percent intervals, the average interval width increases by 1.42 (59 percent). For R1-to-R2 revisions, the corresponding differences are 0.15 (17 percent) and 1.33 (128 percent). Thus, the tradeoff between statistical significance and interval width is substantially less favorable going from 80- to 90 percent intervals than it is going from 70- to 80-percent intervals.
The choice to use the most recent 20 years of data balances the need for sufficient sample to generate intervals with the need for data that reflect how these estimates are currently being revised. We experimented with extending our data series back to 1994. However, our analysis revealed that there were significant differences between the earlier period (1994–2006) and the later period (2000–19). (See appendix.) We used overlapping periods because there were not enough data to analyze the two periods separately.
The coronavirus disease 2019 (COVID-19) pandemic severely disrupted economic activity in early 2020, and the speed of this disruption placed unprecedented demands on a statistical system that was not designed to measure such rapid changes. First-quarter estimates of labor productivity were particularly affected because the sharp decline in economic activity occurred in the last 2 weeks of the quarter. On the output side, the use of projections by BEA for parts of its advance estimate would normally result in large revisions because projections cannot capture large changes that occur over a short period of time. On the input side (hours worked), the surveys that provide the employment and hours data did not capture most of the declines in employment because the declines occurred largely after the reference periods of those surveys.
Both BEA and BLS quickly adapted to the new environment and modified their methods to provide a more accurate picture of output and productivity growth.32 For its advance estimate of GDP, BEA modified its procedures by incorporating high frequency data and relying less on projections. The LPC program modified its usual procedures for estimating hours worked by using data on initial unemployment insurance (UI) claims in its preliminary estimate.
Revisions to output were relatively small. The prelim-to-R1 revision was −0.3 percentage point (from −6.2 percent to −6.5 percent), and the R1-to-R2 revision was 0.1 percentage point (from –6.5 percent to −6.4 percent). BEA plans to continue using these high frequency data going forward, and it is possible that this change will result in smaller revisions to output.
The revisions to hours were larger, mainly because of one-time changes in methodology. For the preliminary Q1 2020 estimate, employment was estimated week by week under the implicit assumptions that the UI initial claims reflected actual job losses and that there were no transitions from nonemployment to employment.33 These are strong assumptions, but the adjustment markedly improved the estimate of total hours worked. The adjusted preliminary estimate of Q1 2020 productivity growth was −2.5 percent versus the unadjusted estimate of −5.2 percent. Although this adjustment was large, only wage and salary employment data were adjusted. Hours at work for self-employed workers and average weekly hours of wage and salary workers were not adjusted because there were no data on which to base an adjustment. Once the April data were available, it became feasible to generate week-by-week estimates of hours by interpolating between the March and April hours estimates. This adjustment reduced the growth in hours worked by −1.8 percentage points, which more than offset the −0.3 revision to output and resulted in an upward revision to Q1 labor productivity growth of 1.6 percentage points to −0.9 percent. The R1-to-R2 revisions further increased Q1 labor productivity growth to −0.3 percent.
Table 8 summarizes the prelim-to-R2 and R1-to-R2 revisions to labor productivity in 2020.
| Quarter | Labor productivity estimates | Revisions | |||
|---|---|---|---|---|---|
| Prelim | R1 | R2 | Prelim-to-R2 | R1-to-R2 | |
Q1 | -2.5 | -0.9 | -0.3 | 2.2 | 0.6 |
Q2 | 7.3 | 10.1 | 10.6 | 3.3 | 0.5 |
Q3 | 4.9 | 4.6 | 5.1 | 0.2 | 0.5 |
Q4 | -4.8 | -4.2 | -3.8 | 1.0 | 0.4 |
Note: Prelim = first preliminary labor productivity and costs (LPC) estimates; R1 = first revised LPC estimates; R2 = second revised LPC estimates; Q1 = first quarter; Q2 = second quarter; Q3 = third quarter; Q4 = fourth quarter. Growth estimates are in percent. Source: U.S. Bureau of Labor Statistics. | |||||
The largest revision was the 3.3-percent prelim-to-R1 revision for Q2, which was entirely due to the revision to output. The next largest revision was the prelim-to-R2 revision for Q1, which was mostly due to revisions to hours. To put these revisions in perspective, the 3.3-percentage-point revision for Q2 and the 2.2-percentage-point revision for Q1 are among the largest revisions since Q1 2000. As noted above, the large prelim-to-R1 revision to Q1 labor productivity growth was due mainly to the one-time modifications to the methodology for estimating hours. Had this modification not been made, the revision would have been smaller, but Q1 labor productivity growth would have been understated and Q2 growth would have been overstated.
However, given that percentile-based intervals are not sensitive to outliers, the 2020 revisions, although large, should not have a major impact on the width of percentile-based intervals. Special situations like these naturally can cause revisions outside the bounds of any standard prediction intervals.
In this article, we analyzed the regularly scheduled revisions to the BLS quarterly labor productivity estimates with the goal of developing intervals that convey to data users the probable magnitude of future revisions. We found that there were no discernible trends in revisions over time, and only a weak relationship between the magnitude of the estimates and the size of the revisions. Recessions had only a small effect on the size and direction of revisions. There is some variation in the size of the revisions across quarters, but the differences were not statistically significant. Decomposing the revisions to labor productivity growth, we found that revisions to output accounted for the largest share of average prelim-to-R2 revisions, while the R1-to-R2 revisions were more evenly divided between revisions to output and revisions to hours.
This article focused on the first three estimates of labor productivity growth, and we developed intervals to quantify the uncertainty around revisions. These new intervals, which have been incorporated into the LPC news release, will provide users with a better understanding of likely future revisions.
Our sample period covers the period Q1 2000 to Q4 2019, but complete data starting in Q1 1994 are available. Given the age of these earlier data, one concern is whether those data are representative of the current pattern of revisions. To examine this, we consider two periods. Ideally, we would have divided the 1994–2019 period into two mutually exclusive subperiods, but there are not enough observations to do so. Hence, we consider two overlapping periods: 1994–2006 and 2000–19. Another consideration is whether the Great Recession had an impact on the revisions. To evaluate this issue, we also examined revisions excluding the Great Recession quarters.
Our first step is to compare summary statistics for the two periods. Table A-1a replicates table 1, but it adds columns for the 1994–2006 period.
| Statistic | Prelim-to-R2 | R1-to-R2 | ||
|---|---|---|---|---|
| 1994–2006 | 2000–19 | 1994–2006 | 2000–19 | |
Mean | 0.40 | 0.14 | 0.18 | 0.04 |
Median | 0.30 | 0.30 | 0.10 | 0.10 |
10th Percentile | -0.80 | -1.10 | -0.40 | -0.50 |
90th Percentile | 1.90 | 1.30 | 0.60 | 0.60 |
Standard deviation | 1.04 | 1.04 | 0.64 | 0.64 |
Skewness | 0.54 | -1.17 | 1.66 | -0.76 |
Kurtosis | 2.84 | 5.41 | 6.81 | 7.10 |
Number of observations | 52 | 79 | 52 | 79 |
Note: Data for fourth quarter 2018 were missing (prelim-to-R2 revisions) or excluded (R1-to-R2 revisions) because of the U.S. federal government shutdown that occurred from December 22, 2018, to January 25, 2019. The table shows simple percentiles. Skewness and kurtosis for a normal distribution would be 0.0 percent and 3.0 percent, respectively. Prelim = first preliminary labor productivity and costs (LPC) estimates; R1 = first revised LPC estimates; R2 = second revised LPC estimates. Growth estimates are in percent. Source: U.S. Bureau of Labor Statistics. | ||||
The main takeaway from table A-1a is that the mean revisions are larger in the earlier period. The mean prelim-to-R2 revision is 0.40 in the earlier period, compared with 0.14 for the later period; and the mean R1-to-R2 revision is 0.18 in the earlier period, compared with 0.04 in the later period. Other summary statistics have similar values, although the prelim-to-R2 revisions are also less peaked in the earlier period. Table A-1b shows the same summary statistics for the absolute value of revisions.
| Statistic | Prelim-to-R2 | R1-to-R2 | ||
|---|---|---|---|---|
| 1994–2006 | 2000–19 | 1994–2006 | 2000–19 | |
Mean | 0.86 | 0.76 | 0.41 | 0.43 |
Median | 0.60 | 0.50 | 0.30 | 0.30 |
10th percentile | 0.20 | 0.10 | 0.00 | 0.00 |
90th percentile | 1.90 | 1.70 | 1.20 | 1.20 |
Standard deviation | 0.70 | 0.72 | 0.52 | 0.48 |
Skewness | 1.27 | 1.67 | 2.49 | 2.29 |
Kurtosis | 4.49 | 6.08 | 8.93 | 8.46 |
Number of observations | 52 | 79 | 52 | 79 |
Note: Data for fourth quarter 2018 were missing (prelim-to-R2 revisions) or excluded (R1-to-R2 revisions) because of the U.S. federal government shutdown that occurred from December 22, 2018, to January 25, 2019. The table shows simple percentiles. Skewness and kurtosis for a normal distribution would be 0.0 and 3.0, respectively. Prelim = first preliminary labor productivity and costs (LPC) estimates; R1 = first revised LPC estimates; R2 = second revised LPC estimates. Growth estimates are in percent. Source: U.S. Bureau of Labor Statistics. | ||||
The revisions shown in table A-1b are more similar in the two periods. The reasons for this can be seen in charts A-1a, A-1b, A-2a, and A-2b.
For both prelim-to-R2 and R1-to-R2 revisions, there were more large-value negative revisions in the later period.34
Tables A-2a, A-2b, A-3a, and A-3b compare the revisions quarter by quarter for the 1994–2006 and 2000–19 periods. Tables A-2a and A-2b compare the prelim-to-R2 revisions, and tables A-3a and A-3b compare the R1-to-R2 revisions.
| Period | N | Mean | Standard deviation | Minimum | Maximum | Mean absolute revision |
|---|---|---|---|---|---|---|
All Quarters | 52 | 0.40 | 1.04 | -1.60 | 3.30 | 0.86 |
Q1 | 13 | 0.60 | 1.24 | -0.80 | 3.30 | 0.95 |
Q2 | 13 | 0.51 | 0.88 | -0.90 | 1.90 | 0.81 |
Q3 | 13 | 0.07 | 0.89 | -1.60 | 1.50 | 0.68 |
Q4 | 13 | 0.42 | 1.15 | -1.10 | 2.20 | 0.99 |
Note: N = number of observations; Prelim = first preliminary labor productivity and costs (LPC) estimates; R2 = second revised LPC estimates; Q1 = first quarter; Q2 = second quarter; Q3 = third quarter; Q4 = fourth quarter. Growth estimates are in percent. Source: U.S. Bureau of Labor Statistics. | ||||||
| Period | N | Mean | Standard deviation | Minimum | Maximum | Mean absolute revision |
|---|---|---|---|---|---|---|
All Quarters | 79 | 0.14 | 1.04 | -3.8 | 2.2 | 0.76 |
Q1 | 20 | -0.24 | 1.09 | -2.8 | 1.1 | 0.76 |
Q2 | 20 | 0.49 | 0.67 | -0.9 | 2.2 | 0.62 |
Q3 | 20 | 0.24 | 1.10 | -2.3 | 1.7 | 0.88 |
Q4 | 19 | 0.07 | 1.18 | -3.8 | 2.0 | 0.77 |
Note: Data for fourth quarter 2018 were missing because of the U.S. federal government shutdown that occurred from December 22, 2018, to January 25, 2019. N = number of observations; Prelim = first preliminary labor productivity and costs (LPC) estimates; R2 = second revised LPC estimates; Q1 = first quarter; Q2 = second quarter; Q3 = third quarter; Q4 = fourth quarter. Growth estimates are in percent. Source: U.S. Bureau of Labor Statistics. | ||||||
| Period | N | Mean | Standard deviation | Minimum | Maximum | Mean absolute revision |
|---|---|---|---|---|---|---|
All quarters | 52 | 0.18 | 0.64 | -1.2 | 2.4 | 0.41 |
Q1 | 13 | 0.33 | 0.95 | -1.2 | 2.4 | 0.69 |
Q2 | 13 | 0.20 | 0.43 | -0.4 | 1.4 | 0.31 |
Q3 | 13 | -0.06 | 0.33 | -0.5 | 0.4 | 0.29 |
Q4 | 13 | 0.23 | 0.68 | -0.3 | 2.3 | 0.37 |
Note: N = number of observations; R1 = first revised labor productivity and costs (LPC) estimates; R2 = second revised LPC estimates; Q1 = first quarter; Q2 = second quarter; Q3 = third quarter; Q4 = fourth quarter.. Growth estimates are in percent. Source: U.S. Bureau of Labor Statistics. | ||||||
| Period | N | Mean | Standard deviation | Minimum | Maximum | Mean absolute revision |
|---|---|---|---|---|---|---|
All quarters | 79 | 0.04 | 0.64 | -2.40 | 2.00 | 0.43 |
Q1 | 20 | -0.10 | 1.06 | -2.40 | 2.00 | 0.72 |
Q2 | 20 | 0.12 | 0.47 | -0.70 | 1.40 | 0.37 |
Q3 | 20 | 0.02 | 0.48 | -1.00 | 1.30 | 0.35 |
Q4 | 19 | 0.13 | 0.30 | -0.60 | 0.50 | 0.26 |
Note: Data for fourth quarter 2018 were excluded because of the U.S. federal government shutdown that occurred from December 22, 2018, to January 25, 2019. N = number of observations; R1 = first revised labor productivity and costs (LPC) estimates; R2 = second revised LPC estimates; Q1 = first quarter; Q2 = second quarter; Q3 = third quarter; Q4 = fourth quarter. Growth estimates are in percent. Source: U.S. Bureau of Labor Statistics. | ||||||
Looking at tables A-2a and A-2b, we see that, in addition to differences in the size of the average revisions, there are also differences in how those revisions are distributed across quarters. The most notable difference is for Q1. In the earlier period, the revisions are large and positive, whereas in the later period the revisions are negative and about half the size in magnitude. In table 3b, we see a similar pattern for R1-to-R2 revisions, but the magnitudes are smaller.
Tables A-4a, A-4b, A-5a, and A-5b compare the sources of revisions in the two periods. For ease of comparison, we duplicated the decompositions shown in tables 4a and 4b.
| Period | Average revision to: | Total | |||
|---|---|---|---|---|---|
| Output | Hours | ||||
| Current quarter | Previous quarter | Current quarter | Previous quarter | ||
All quarters | 0.03 | -0.30 | 0.16 | 0.22 | 0.39 |
Q1 | -0.45 | -0.78 | 0.09 | 0.33 | 0.57 |
Q2 | 1.23 | 0.82 | -0.05 | 0.10 | 0.56 |
Q3 | -1.09 | 1.27 | 0.44 | 0.32 | -2.49 |
Q4 | 0.42 | 0.04 | 0.16 | 0.13 | 0.36 |
Note: Prelim = first preliminary labor productivity and costs (LPC) estimates; R2 = second revised LPC estimates; Q1 = first quarter; Q2 = second quarter; Q3 = third quarter; Q4 = fourth quarter. Data are in percent. Source: U.S. Bureau of Labor Statistics. | |||||
| Period | Average revision to: | Total | |||
|---|---|---|---|---|---|
| Output | Hours | ||||
| Current quarter | Previous quarter | Current quarter | Previous quarter | ||
All quarters | -0.16 | -0.27 | -0.06 | -0.05 | 0.13 |
Q1 | -1.29 | -1.01 | -0.15 | -0.12 | -0.25 |
Q2 | 0.25 | -0.13 | -0.11 | 0.00 | 0.49 |
Q3 | 0.38 | 0.02 | 0.32 | 0.18 | 0.22 |
Q4 | 0.04 | 0.04 | -0.32 | -0.25 | 0.07 |
Note: Data for fourth quarter 2018 were missing because of the U.S. federal government shutdown that occurred from December 22, 2018, to January 25, 2019. Prelim = first preliminary labor productivity and costs (LPC) estimates; R2 = second revised LPC estimates; Q1 = first quarter; Q2 = second quarter; Q3 = third quarter; Q4 = fourth quarter. Data are in percent. Source: U.S. Bureau of Labor Statistics. | |||||
| Period | Average revision to: | Total | |||
|---|---|---|---|---|---|
| Output | Hours | ||||
| Current quarter | Previous quarter | Current quarter | Previous quarter | ||
All quarters | 0.09 | 0.00 | -0.05 | 0.02 | 0.15 |
Q1 | -0.75 | -0.81 | -0.51 | -0.30 | 0.26 |
Q2 | 0.97 | 0.82 | -0.03 | 0.10 | 0.29 |
Q3 | -0.07 | 0.02 | 0.31 | 0.29 | -0.11 |
Q4 | 0.21 | -0.02 | 0.03 | -0.03 | 0.17 |
Note: R1 = first revised labor productivity and costs (LPC) estimates; R2 = second revised LPC estimates; Q1 = first quarter; Q2 = second quarter; Q3 = third quarter; Q4 = fourth quarter. Data are in percent. Source: U.S. Bureau of Labor Statistics. | |||||
| Period | Average revision to: | Total | |||
|---|---|---|---|---|---|
| Output | Hours | ||||
| Current quarter | Previous quarter | Current quarter | Previous quarter | ||
All quarters | -0.29 | -0.30 | 0.00 | 0.02 | 0.03 |
Q1 | -1.26 | -1.07 | -0.23 | -0.16 | -0.12 |
Q2 | -0.04 | -0.13 | -0.05 | 0.00 | 0.14 |
Q3 | 0.04 | 0.01 | 0.29 | 0.26 | -0.01 |
Q4 | 0.13 | 0.00 | -0.03 | -0.04 | 0.12 |
Note: Data for fourth quarter 2018 were excluded because of the U.S. federal government shutdown that occurred from December 22, 2018, to January 25, 2019. R1 = first revised labor productivity and costs (LPC) estimates; R2 = second revised LPC estimates; Q1 = first quarter; Q2 = second quarter; Q3 = third quarter; Q4 = fourth quarter. Data are in percent. Source: U.S. Bureau of Labor Statistics. | |||||
For prelim-to-R2 revisions (tables A-4a and A-4b), we see that revisions to current quarter output were smaller, on average. But the large revisions to current output (both current and previous quarter) occurred in Q2 and Q3, rather than in Q1, as in the later period. Revisions to hours were larger in the earlier period. Comparisons of R1-to-R2 revisions in tables A-5a and A-5b also reveal differences between the two periods. Revisions to output (both current and previous quarter) are larger in the later period, but they completely offset one another. The large revisions to output occur in Q1 and Q2 in the earlier period, compared with Q1 in the later period. Revisions to hours are larger in the earlier period, mainly because of larger revisions in Q1.
ACKNOWLEDGMENTS: We are grateful to Barbara Fraumeni, Tara Sinclair, and Brady West for their helpful comments.
Kendra Asher, John L. Glaser, Peter B. Meyer, Jay Stewart, and Jerin Varghese, "Revisions to BLS quarterly labor productivity estimates: How large are they?," Monthly Labor Review, U.S. Bureau of Labor Statistics, March 2022, https://doi.org/10.21916/mlr.2022.10
1 For more information on the U.S. Bureau of Labor Statistics (BLS) Labor Productivity and Costs (LPC) program, see the LPC page of the BLS website and the technical documentation provided there, at https://www.bls.gov/lpc/home.htm. For a complete description of how BLS calculates its productivity data (output and total hours worked), see Lucy Eldridge, Chris Sparks, and Jay Stewart, “The BLS Productivity Program,” in Emili Grifell-Tatjé, C.A. Knox Lovell, and Robin C. Sickles, eds., The Oxford Handbook of Productivity Analysis (New York: Oxford University Press, 2018), pp. 121–52.
2 Seasonally adjusted Gross Domestic Product (GDP) and employment data are used for the quarter-to-quarter measures. The Current Population Survey (CPS) data are never revised, although the CPS seasonal factors are reestimated annually. The National Compensation Survey (NCS) data are not revised; the LPC program uses NCS data for the fourth quarter and allocates changes to quarters using the Denton method. With this procedure, seasonal adjustment is not necessary.
3 See, for example, Productivity and Costs, Third Quarter 2021, Revised, USDL-21-2098 (U.S. Department of Labor, December 7, 2021), https://www.bls.gov/news.release/archives/prod2_12072021.htm. The most recent edition of the Productivity and Costs news release is always available at www.bls.gov/news.release/prod2.nr0.htm.
4 We are currently researching the long-run behavior of revisions. These later revisions are not as regular and often occur long after the end of the reference period.
5 See Dennis J. Fixler, Ryan Greenaway-McGrevy, and Bruce T. Grimm, “The Revisions to GDP, GDI, and their major components,” Survey of Current Business, August 2014, p. 1, https://apps.bea.gov/scb/pdf/2014/08%20August/0814_revisions_to_gdp_gdi_and_their_major_components.pdf.
6 Dennis J. Fixler, Danit Kanal, and Pao-Lin Tien, “The Revisions to GDP, GDI, and their major components,” Survey of Current Business, January 2018, p.1, https://apps.bea.gov/scb/pdf/2018/01-January/0118-revisions-to-gdp-gdi-and-their-major-components.pdf.
7 Each February, BLS publishes Current Employment Statistics (CES) survey benchmarks. The employment level from the previous March is set to match the employment level from the BLS Quarterly Census of Employment and Wages, and CES employment levels for the intermediate months are interpolated. BLS also calculates new seasonal adjustment factors each year, and all data series for the previous 5 years are re-seasonally adjusted and published in February, along with the annual benchmark revisions. For more information on this process, see “See “Employment, hours, and earnings from the establishment survey,” chap. 2 in Handbook of Methods (U.S. Bureau of Labor Statistics), https://www.bls.gov/opub/hom/pdf/ces-20110307.pdf. The most recent CES National Benchmark Article is available at https://www.bls.gov/web/empsit/cesbmart.htm.
8 Charles F. Manski, “Communicating uncertainty in official economic statistics: an appraisal fifty years after Morgenstern,” Journal of Economic Literature, vol. 53, no. 3, September 2015, pp. 631–53, https://doi.org/10.1257/jel.53.3.631.
9 Ana Beatriz Galvão, James Mitchell, and Johnny Runge, “Communicating data uncertainty: experimental evidence for U.K. GDP,” ESCoE Discussion Paper 2019–20 (Economic Statistics Centre of Excellence, National Institute of Economic and Social Research, London, U.K., December 2019), https://escoe-website.s3.amazonaws.com/wp-content/uploads/2020/07/14163259/ESCoE-DP-2019-20.pdf.
10 Galvão, Mitchell, and Runge, “Communicating data uncertainty,” p. 28.
11 See Fixler, Greenaway-McGrevy, and Grimm, “Revisions to GDP, GDI, and their major components,” p.2.
12 See Fixler, Greenaway-McGrevy, and Grimm, “Revisions to GDP, GDI, and their major components,” and Fixler, Kanal, and Tien, “Revisions to GDP, GDI, and their major components.”
13 Our intervals are mathematically the same as prediction intervals, in the sense that we are trying to predict the value of the R2 estimate, even though the value we are trying to predict occurred in the past. To avoid confusion, we refer to them simply as “intervals.”
14 See Fixler, Greenaway-McGrevy, and Grimm, “Revisions to GDP, GDI, and their major components,” and Fixler Kanal, and Tien, “Revisions to GDP, GDI, and their major components.”
15 Throughout this article, Q1 = first quarter, Q2 = second quarter, Q3 = third quarter, and Q4 = fourth quarter.
16 The U.S. federal government was shut down from December 22, 2018, to January 25, 2019; lasting for 35 days, it was the longest federal government shutdown in history.
17 Our analysis is similar to that of a 2013 study by Tara M. Sinclair and H. O. Stekler, who focus on revisions to GDP and its components. Their study, which covers the period from Q1 1977 to Q3 2010, compares the U.S. Bureau of Economic Analysis (BEA) advance estimates to BEA third estimates, which correspond to the BLS prelim and R2 estimates. Sinclair and Stekler examine whether the advance estimates are biased and whether the estimates incorporate information about the state of the economy. For real GDP, they find a slight bias in the advance estimate and that the BEA estimates do incorporate business cycle information. See Sinclair and Stekler, “Examining the quality of early GDP component estimates,” International Journal of Forecasting, vol. 29, no. 4, October–December 2013, pp. 736–50, https://doi.org/10.1016/j.ijforecast.2012.02.007. An earlier working-paper version of the article is available at https://www2.gwu.edu/~forcpgm/2011-001.pdf.
18 Statistical tests reject normality. For more information, see Kendra Asher, John Glaser, Peter B. Meyer, Jay Stewart, and Jerin Varghese, “How large are revisions to estimates of quarterly labor productivity?” BLS Working Paper 538, April 6, 2021, table A1, https://www.bls.gov/osmr/research-papers/2021/pdf/ec210040.pdf.
19 Sinclair and Stekler, “Examining the quality of early GDP component estimates.”
20 For the regression results, see tables A4 and A5 in Asher et al., “How large are revisions to estimates of quarterly labor productivity?”
21 See “Information on updates to the National Economic Accounts: 2021 annual update,” U.S. Bureau of Economic Analysis, https://www.bea.gov/information-updates-national-economic-accounts.
22 Using the most recent example (from the January 2022 Employment Situation news release), CES employment for March 2021 was benchmarked to QCEW totals and employment estimates for April 2020–February 2021 and for April 2021–December 2021 were recalculated as follows:
The employment estimates for April 2021–December 2021 were revised as follows: (1) the birth–death model was reestimated, (2) the monthly employment estimates were recalculated using sample-based growth rates from the new March 2021 base and the revised birth–death estimates, and (3) seasonal factors were reestimated.
Employment estimates for April 2020–February 2021 were revised as follows: (1) The adjustment to March 2021 employment was distributed linearly to the previous 11 months, and (2) seasonal factors were reestimated.
Thus, each employment estimate is benchmarked twice. After the second benchmark revision, there are no further revisions, except for reestimation of seasonal factors.
These revisions cover the 21-month period from April 2020 through December 2021. Estimates for the January-March of the current year (2022 in this example) are not revised because employment for those months is estimated using sample-based growth rates from the revised December 2021 estimate. That is, the initial estimates for these months are calculated the same way as the revised estimates for April–December 2021 as in (a). However, estimates for these months will be revised in the 2023 benchmark revisions using the procedure described in (b). More information on CES benchmarking can be found in the “Benchmarks” section of “Technical notes for the Current Employment Statistics survey” at https://www.bls.gov/web/empsit/cestn.htm#section7b.
23 See Caitlin Patrick and Marcus Polite, “CES national benchmark article: BLS establishment survey national estimates revised to incorporate March 2021 benchmarks,” last modified February 4, 2022, https://www.bls.gov/web/empsit/cesbmart.htm.
24 See Asher et al., “How large are revisions to estimates of quarterly labor productivity?,” tables A6 and A7, for these results.
25 Richard G. Anderson and Kevin L. Kliesen, “The 1990s acceleration in labor productivity: causes and measurement,” Federal Reserve Bank of St. Louis Review, vol. 88, no. 3, May–June 2006, pp. 181–202, https://files.stlouisfed.org/files/htdocs/publications/review/06/05/Anderson.pdf.
26 Recession dates were obtained from the National Bureau of Economic Research (NBER), “U.S. business cycle expansions and contractions,” https://www.nber.org/research/data/us-business-cycle-expansions-and-contractions. The NBER Business Cycle Dating Committee determined that the 2007–09 recession lasted for 18 months (December 2007 to June 2009), making it the longest U.S. recession in the post-World War II period. In terms of quarters, NBER determined that the recession began in the fourth quarter of 2007 and ended in the second quarter of 2009.
27 GDP for Q4 2008 was revised more than any other quarter on record. See Dean Croushore, “Frontiers of real-time data analysis,” Journal of Economic Literature, vol. 49, no. 1, March 2011, pp. 72–100 (see p. 73), https://doi.org/10.1257/jel.49.1.72.
28 See S. Borağan Aruoba, “Data revisions are not well behaved,” Journal of Money, Credit and Banking, vol. 40, no. 2/3 (March–April 2008), pp. 319–40, https://www.jstor.org/stable/25096254; and Jan P.A.M. Jacobs and Simon van Norden, “Why are initial estimates of productivity growth so unreliable?,” Journal of Macroeconomics, vol. 47, part B, March 2016, pp. 200–13, https://doi.org/10.1016/j.jmacro.2015.11.004.
29 See Fixler, Greenaway-McGrevy, and Grimm, “Revisions to GDP, GDI, and their major components,” and Fixler Kanal, and Tien, “Revisions to GDP, GDI, and their major components.”
30 See Fixler, Greenaway-McGrevy, and Grimm, “Revisions to GDP, GDI, and their major components.”
31 Much of the bunching is due to rounding.
32 See, for example, Abe Dunn, Kyle Hood, and Alexander Driessen, “Measuring the effects of the COVID-19 pandemic on consumer spending using card transaction data,” BEA Working Paper 2020-5 (U.S. Bureau of Economic Analysis, April 24, 2020), https://www.bea.gov/system/files/papers/BEA-WP2020-5_0.pdf.
33 The LPC program considered using changes in continued claims, but it determined that initial claims more accurately reflected actual job losses. A description of the methodological changes can be found in “Effects of COVID-19 pandemic and response on quarterly productivity and costs” (U.S. Bureau of Labor Statistics, last modified November 18, 2021), https://www.bls.gov/covid19/effects-of-covid-19-pandemic-on-productivity-and-costs-statistics.htm#quarterly-LPC.
34 Another consideration is whether the Great Recession had an impact on the revisions. When we omitted 2008 data from the sample, there was only a minor impact on the summary statistics.