An official website of the United States government
An official website of the United States government
The .gov means it's official.
Federal government websites often end in .gov or .mil. Before sharing sensitive information,
make sure you're on a federal government site.
The site is secure.
The
https:// ensures that you are connecting to the official website and that any
information you provide is encrypted and transmitted securely.
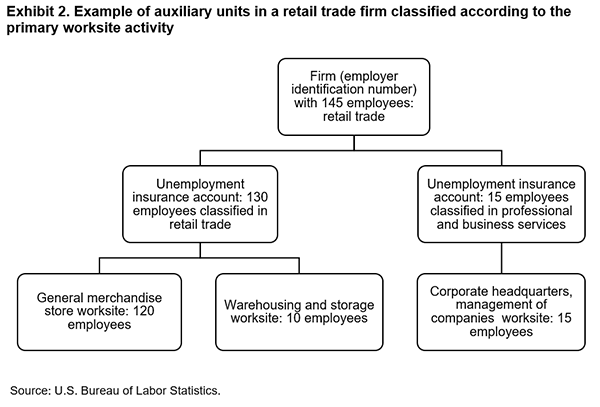
In the United States, Canada, and Mexico, businesses (and hence business employment) are classified and reported in industries according to the North American Industry Classification System (NAICS).1 NAICS was implemented in the United States in 1997, replacing its predecessor, the Standard Industrial Classification (SIC) system. A major criticism of this change, over time, has involved the treatment of auxiliary units. In the SIC system, an auxiliary unit was defined as a worksite that was part of a firm and provided management or support services for other worksites within the firm. At the U.S. Bureau of Labor Statistics (BLS), in practice, this meant that an auxiliary unit was a worksite reported with other worksites as part of a multiworksite unemployment insurance account. Typical examples of auxiliary units include headquarters and warehouses associated with a manufacturing plant. Under NAICS, the auxiliary-unit concept was eliminated, and these units are now classified with other worksites performing similar functions.2
In this article, I use data from the BLS Quarterly Census of Employment and Wages (QCEW) to look at how employment trends over the past few decades would differ if we were to approximate the auxiliary‑unit concept. Would making this change lead to different trends in certain industries over that period?
In 2018, there were about 10 million business establishments in the United States. Each of these establishments produces a good or provides a service. The product or service that a company produces or provides leads to its classification in a specific industry in which similar businesses are also classified. This grouping of businesses by industry allows for a consistent definition to be used across statistical agencies for the collection and publication of economic statistics. It also allows economists, academics, and businesses to compare features of similar and dissimilar businesses, and it allows federal, state, and local governments to develop policies targeted at businesses within specific industries.
Prior to 1997, businesses were classified into industries on the basis of the 1987 SIC system. A notable feature of the SIC system was the inclusion of special rules for coding “auxiliary” establishments, which the SIC manual defined as follows:
Auxiliary establishments are distinguished from operating establishments that primarily produce goods and from those that primarily provide services for personal or household use or for other enterprises. Some examples of activities commonly performed by auxiliaries are management and other general administrative functions, such as accounting, data processing, and legal services; research, development, and testing; and warehousing.3
The 1987 SIC manual further clarified how auxiliary establishments were assigned industry codes: “Auxiliary establishments are assigned four-digit industry codes on the basis of the primary activity of the operating establishments they serve.”4 Since 1997, businesses have been classified into industry groups using NAICS. The NAICS 2017 manual includes the following explanation in its preface:
The North American Industry Classification System is unique among industry classifications in that it is constructed within a single conceptual framework. Economic units that have similar production processes are classified in the same industry, and the lines drawn between industries demarcate, to the extent practicable, differences in production processes. This supply-based, or production-oriented, economic concept was adopted for NAICS because an industry classification system is a framework for collecting and publishing information on both inputs and outputs, for statistical uses that require that inputs and outputs be used together and be classified consistently.5
The NAICS 2017 manual also describes auxiliary establishments, as follows:
Although all establishments have output, they may or may not have receipts. In large enterprises, it is not unusual for establishments to exist to solely serve other establishments of the same enterprise (auxiliary, or enterprise support, establishments). In such cases, these units often do not collect receipts from the establishments they serve. This type of support (captive) activity is found throughout the economy and involves goods-producing activities as well as services. Units that carry out support activities for the enterprise to which they belong are classified, to the extent feasible, according to the NAICS code related to their own activity. This means that warehouses providing storage facilities for their own enterprise are classified as warehouses.6
Businesses evolve; they grow, change, and decline. A company may start with only one or two workers, and over time it may grow to have thousands of employees, with worksites located in multiple states and industries. Some of the worksites in other industries may partially or fully support the main company activity. A company may change vendors for the inputs it needs to develop and sell its product or service, and over time it may decide to outsource part of its product development or service delivery to other companies—sometimes even in other countries. This decision process also applies to worksites that would have been classified as auxiliary establishments under the SIC system.
With a few assumptions about the auxiliary relationship, we can explore how important this concept might be in measuring employment change, particularly by industry. This article focuses on exploring employment trends by various industry groups in order to identify how these trends would have differed if an auxiliary-unit concept was used in the estimation process. (See the box that follows for basic definitions of some of the relevant terms used in this article.)
Definitions
Industry. BLS and other federal statistical agencies classify industries according to the North American Industry Classification System (NAICS). NAICS is hierarchical, with broad industry groups comprising more and more detailed groups.
Worksite. BLS defines a worksite as a single physical location of work. A worksite is also frequently referred to as an establishment. If there is more than one economic activity at the site, the economic activity that generates the most revenue is typically used to determine its primary industry for classification under NAICS.
Unemployment insurance (UI) account. Virtually all employers in the United States are required to register with the appropriate agency in the state in which they are located in order to receive a UI account number. State agencies assign this number to employers to track their mandatory participation in state and federal UI programs. Employers can have multiple worksites within one UI account but are limited to only those within the same state. The employer can choose to have more than one UI account, but a single worksite can only have one UI account.
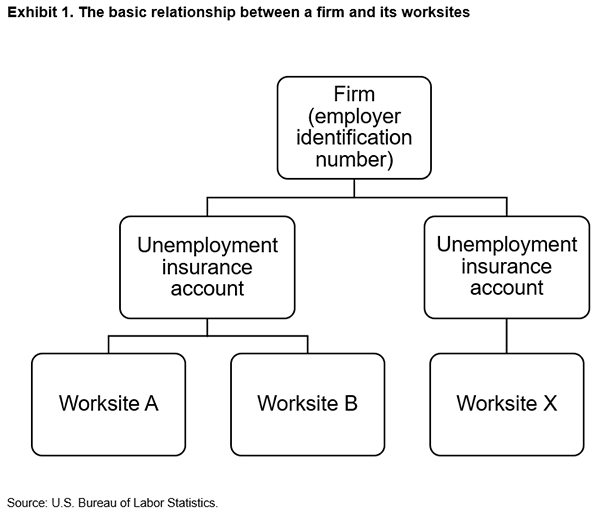
Employer identification number (EIN). The EIN is a unique nine-digit number issued by the Internal Revenue Service (IRS) to identify a business entity. An EIN can identify a single worksite, or it can identify a group of worksites within one state or across states. (See exhibit 1 for a basic relationship structure.) In this article, the EIN is also referred to as a firm identifier. A firm is an establishment or a combination of establishments that sells goods or services for a profit. Firms can operate in one industry or in multiple industries.*
Quarterly Census of Employment and Wages (QCEW). Data from the BLS QCEW are the product of a federal–state cooperative program. The data are derived from summaries of the employment and total pay of workers covered by state and federal UI legislation and are provided to BLS by state workforce agencies. In addition, employers who operate multiple establishments within a state complete a questionnaire called the “Multiple Worksite Report,” which provides detailed information on employment, wages, and industry for each of their establishments.
QCEW data cover about 97 percent of business employment in the United States, and data are published by county, metropolitan area, state, and the nation for detailed industry groups. The QCEW also collects the UI account number and the federal EIN for each of these employers. Major exclusions from UI coverage include self-employed workers, most agricultural workers on small farms, all members of the Armed Forces, elected officials in most states, most student workers at schools, employees of certain small nonprofit organizations, and railroad workers covered by the railroad unemployment insurance system.
* For more on the “firm” concept, see Akbar Sadeghi, David M. Talan, and Richard L. Clayton, “Establishment, firm, or enterprise: does the unit of analysis matter?” Monthly Labor Review, November 2016, https://www.bls.gov/opub/mlr/2016/article/establishment-firm-or-enterprise.htm.
BLS no longer collects data in such a way as to identify auxiliary units. However, we can classify all worksites within an unemployment insurance (UI) account or a federal employer identification number (EIN) on the basis of the dominant industry of the account. Note that this approach serves as a proxy for the auxiliary-unit concept, but it will not capture exactly what a direct coding would.
The QCEW program collects data each quarter for all business worksites in the United States, including the number of employees and the total quarterly wages paid.7 The QCEW also collects information on the worksite location, its UI account number, its federal EIN, and the industry in which it is classified (according to NAICS). With some straightforward assumptions, I assigned the dominant economic activity at the UI account level and at the firm level (i.e., for each group of establishments with the same EIN). The assumptions are that all activity at each worksite is associated with its assigned NAICS code and that the aggregate revenue of the UI account or firm is proportional to the employment at each worksite. With these assumptions, I identified the industry sector that has the most employment within a UI account or within a firm for the third month of each quarter and assigned that industry sector to the entire UI account or firm (for that quarter). (See exhibit 1 for a basic relationship diagram and exhibit 2 for an example.)
The analysis presented in this article shows data for employment change classified by industry at the worksite level, by UI account, and by EIN. Clearly, assigning industry classification at a more aggregate company level will produce an employment level that differs from the employment level produced by industry classification at the worksite level. My main interest here is to see if the long-run industry employment story is changed by the reclassification. Therefore, I indexed these data to 1990. (Appendix table A-1 provides the employment levels for the first quarter of 1990, and table A-2 shows index data for all of the industry groups analyzed in this article for the worksite, UI account, and EIN assignment of industry for the 1990–2018 period.) This analysis should help data users identify industries in which the more aggregate trends have deviated substantially from those given by the official worksite-classified statistics.
Note that this analysis allows us to see if aggregate economic trends would have been different if employment in company- and firm-owned worksites in other industries had been included in the primary industry. Total employment, as measured by the QCEW, is not changed by this reassignment, which simply moves selected establishments and their employment from their officially assigned industry group into another one. Therefore, this analysis provides a specific view of employment changes at a broad industry level and examines whether the inclusion of an auxiliary-unit proxy concept changes the economic story in each industry group. Different trends over time could result from several factors outside the scope of this analysis. Principally, this analysis does not determine whether changes in trends are due to aggregate changes in ownership of auxiliary-like worksites or changes in employment in the auxiliary-like industries. What this analysis explores is how much employment is directly attributable to firms whose aggregate primary activity is within a specific industry group, plus the employment associated with worksites owned by those firms that are classified outside of that industry group.
There are a number of potential errors associated with this reclassification methodology. Among them are the following:
These errors are expected to be small enough not to change the broad results contained in this analysis.
BLS organizes NAICS sectors into broader groupings for some publications. These groupings are natural resources and mining; construction; manufacturing; trade, transportation, and utilities; information; financial activities; professional and business services; education and health services; leisure and hospitality; other services, except public administration; public administration; and an “unclassified” category. The analysis in this article uses these broader industry groupings, with two exceptions—natural resources and mining; and trade, transportation, and utilities are analyzed at the more detailed NAICS-sector level. The analysis omits the unclassified category. Therefore, this article examines the following industry groups: agriculture, forestry, fishing, and hunting; mining, quarrying, and oil and gas extraction; construction; manufacturing; wholesale trade; retail trade; transportation and warehousing; utilities; information; financial activities; professional and business services; education and health services; leisure and hospitality; other services, except public administration; and public administration.
The analysis in this article includes a reassignment of industry at both the UI account level and the EIN (firm) level. As expected, the assignment of industry at the UI account level results in employment trends that are closer to the trends seen at the worksite-assigned level, because the aggregation of worksites is on a smaller scale. For this reason, this analysis focuses on comparing data with an assignment of industry at the EIN or firm level by using data that have been categorized with the official worksite industry assignment. The analysis focuses mostly on the end points of the various indexes that were created for this purpose, in order to identify industry sectors in which the economic story would be most similar and most different under this proxy auxiliary assignment procedure.
The industry with the largest positive percent difference between the EIN index and the worksite index over the 1990–2018 period is wholesale trade. Chart 1 shows a continually stronger trend in the EIN index, except around recessions. The data show that the EIN index grew 8.6 percent more than the worksite index over the period. This finding indicates that firms in the wholesale trade industry expanded their ownership of (and employment in) worksites outside of the wholesale trade industry during the study period.
The industry with the largest negative percent difference between the EIN index and the worksite index over the 1990–2018 period is information. (See chart 2.) There was some limited deviation early in the period, but it moderated in early 2000. The deviation returned in early 2014 and mostly widened each quarter until the end of the period. The result is an EIN index that was 7.5 percent lower than the worksite index in 2018. This finding indicates that firms in the information industry reduced their ownership of (and employment in) worksites outside of the information industry over the 1990–2018 period.
By contrast, as shown in table 1, the industries with the least deviation between the EIN index and the worksite index over the period are other services (+0.4 percent), utilities (−0.6 percent), and construction (+0.7 percent). Among these three industries, construction had the most employment. The index of employment change for construction is shown in chart 3. Visually, we see very little deviation between the EIN index and the worksite index for the construction industry over the entire 1990–2018 period.
Charts 1, 2, and 3 show, respectively, positive, negative, and “no change” deviations between worksite and EIN industry coding. Table 1 provides information on the relative percent difference in the index values (at the end of the period) between the EIN NAICS reassignment and the original worksite NAICS code assignment, the difference in employment change, and the relative percent employment change (taking the difference in employment change divided by the final employment level of the worksite NAICS assignment).8
| Industry | Relative percent difference in index values: (EIN – WS) / WS | Difference in employment change (EIN∆ – WS∆) | Relative percent employment change, (EIN∆ – WS∆) / WS |
|---|---|---|---|
Agriculture, forestry, fishing and hunting | 2.2 | 16,885 | 1.5 |
Mining, quarrying, and oil and gas extraction | –5.1 | –34,787 | –5.1 |
Construction | 0.7 | 37,409 | 0.5 |
Manufacturing | –1.8 | –684,757 | –5.4 |
Wholesale trade | 8.6 | 316,505 | 5.4 |
Retail trade | 3.0 | 521,647 | 3.2 |
Transportation and warehousing | –3.0 | –278,485 | –5.0 |
Utilities | –0.6 | –11,768 | –2.1 |
Information | –7.5 | –219,373 | –7.8 |
Financial activities | 1.1 | 99,178 | 1.2 |
Professional and business services | 5.3 | –6,448 | 0.0 |
Education and health services | 2.4 | 379,854 | 1.7 |
Leisure and hospitality | 1.1 | 189,686 | 1.2 |
Other services, except public administration | 0.4 | –25,979 | –0.6 |
Public administration | –1.6 | –271,911 | –1.2 |
Note: EIN = employer identification number; WS = worksite. Source: U.S. Bureau of Labor Statistics. | |||
Table 1 shows that the industries with the largest positive difference in employment change between the worksite- and EIN-based industry assignments over the 1990–2018 period are retail trade (+521,647), education and health services (+379,854), and wholesale trade (+316,505). The industries with the largest negative difference in employment change in this reassignment are manufacturing (−684,757), transportation and warehousing (−278,485), public administration (−271,911), and information (−219,373). The industries in which employment change was the least affected by this reassignment are professional and business services (−6,448), utilities (−11,768), and agriculture, forestry, fishing and hunting (+16,885)
The analysis presented in this article identifies industries whose firms changed their pattern of other-industry worksite ownership and employment over the 1990–2018 period. For example, as classified by the official worksite industry assignment, employment in retail trade grew by about 3.3 million over the period. However, when the data are reclassified at the firm level, employment growth in retail trade during this period increases to about 3.8 million. Therefore, a firm-level industry classification strategy shows somewhat stronger growth for retail trade plus retail-owned firms than the growth shown by the original worksite industry assignment. Based on this strategy of identifying deviations in employment change between worksite and EIN industry assignment, the following industries changed the most over the period from the first quarter of 1990 to the fourth quarter of 2018: manufacturing, wholesale trade, information, retail trade, and transportation and warehousing. (See appendix table A-2 for index data for all of the industry groups examined in this article at the worksite, UI account, and firm level.)
This section takes a deeper look at some of the most substantial compositional changes identified in the earlier analysis of broad industry employment trends. Recall that, under NAICS, industry assignment is determined by the worksite’s dominant economic activity. Hence, the majority of employment in a firm with multiple worksites generally will be in the industry originally assigned to the firm in the QCEW.9 In this article, this employment is referred to as core industry employment. The firm may also own establishments and have employment in other industries, and this is referred to as noncore employment. In this section, I briefly explore the distribution of noncore employment in wholesale trade and retail trade, the two industries that showed the most difference between worksite and EIN industry assignment in the earlier analysis.
In the fourth quarter of 2018, core wholesale trade employment (i.e., employment in worksites and firms that shared the same industry classification) represented 87.2 percent of total employment in the industry. The noncore employment in firms connected to wholesale trade was most concentrated in management of companies and enterprises (1.8 percent), professional and technical services (1.5 percent), and warehousing and storage (1.0 percent), computer and electronic products manufacturing (0.8 percent), chemical manufacturing (0.7 percent), and building material and garden supply stores (0.6 percent). An additional 6.4 percent of noncore employment was spread among many other three-digit industries. (See table 2.)
| Industry | Percent |
|---|---|
Total | 12.8 |
Management of companies and enterprises | 1.8 |
Professional and technical services | 1.5 |
Warehousing and storage | 1.0 |
Computer and electronic products manufacturing | 0.8 |
Chemical manufacturing | 0.7 |
Building material and garden supply stores | 0.6 |
Remaining | 6.4 |
Note: The “remaining” category consists of smaller shares of employment spread among many other three-digit industries. NAICS = North American Industry Classification System. Source: U.S. Bureau of Labor Statistics. | |
In wholesale trade, the noncore industries in which employment increased the most over the 1990–2018 period when they were reclassified at the EIN level included auxiliary worksites in professional and business services (+2.5 percent),10 manufacturing (+0.9 percent),11 and transportation and warehousing
(+0.9 percent).12 In total, firms in the wholesale trade industry reduced the employment share of the core industry by 4.7 percent. At the three-digit level, these firms mainly added additional worksites and employment in management of companies and enterprises (+1.1 percent), professional and technical services (+1.0 percent), and warehousing and storage (+0.8 percent). (See table 3.)
| Noncore industry | Percent change in employment share |
|---|---|
Management of companies and enterprises | 1.1 |
Professional and technical services | 1.0 |
Warehousing and storage | 0.8 |
Note: Changes measured from fourth quarter 1990 to fourth quarter 2018. EIN = employer identification number. Source: U.S. Bureau of Labor Statistics. | |
In the fourth quarter of 2018, core employment in retail trade represented 93.3 percent of total employment for the industry. The noncore employment in firms connected to retail trade was primarily found in warehousing and storage (2.3 percent) and management of companies and enterprises (1.9 percent). (See table 4.)
| Industry | Percent |
|---|---|
Total | 6.7 |
Warehousing and storage | 2.3 |
Management of companies and enterprises | 1.9 |
Merchant wholesalers, nondurable goods | 0.3 |
Merchant wholesalers, durable goods | 0.3 |
Telecommunications | 0.3 |
Administrative and support services | 0.3 |
Remaining | 1.3 |
Note: The “remaining” category consists of smaller shares of employment spread among many other three-digit industries. NAICS = North American Industry Classification System. Source: U.S. Bureau of Labor Statistics. | |
In retail trade, the noncore industries in which employment increased the most over the 1990–2018 period when they were reclassified at the EIN level included auxiliary worksites in transportation and warehousing (+1.7 percent), professional and business services (+1.1 percent), and information (+0.3 percent). The noncore industry with the largest decrease in employment over this period was worksites in manufacturing (−0.4 percent). In total, firms in the retail trade industry reduced the employment share of the core industry by 2.4 percent over these years. At the three-digit level, these firms mainly added more worksites and employment in warehousing and storage (+1.6 percent), management of companies and enterprises (+1.1 percent), and telecommunications (+0.3 percent). Although these changes do not fully encompass the e-commerce-related changes in and outside of this industry, they seem to support the e-commerce changes in retail trade that are well known—that is, a greater reliance on warehousing and storage, management of companies and enterprises, and telecommunications. (See table 5.)
| Noncore industry | Percent change in employment share |
|---|---|
Warehousing and storage | 1.6 |
Management of companies and enterprises | 1.1 |
Telecommunications | 0.3 |
Note: Changes measured from fourth quarter 1990 to fourth quarter 2018. EIN = employer identification number. Source: U.S. Bureau of Labor Statistics. | |
Several economic statistics can be used to measure industry change. BLS statistics used for this purpose include employment, hours, wages, turnover, industry productivity, and producer prices. This suite of statistics tells us much about the growth and decline of industries and about changes in prices, industry hires and separations, industry productivity, and average hourly, weekly, and annual wages paid to employees. These statistics can be supplemented by looking at employer size class, business age, the employment associated with expanding and contracting businesses, and other statistics readily available from BLS. Each of these statistics is mostly focused on telling us how industries are doing today, with some historical context to aid in understanding their contribution to the overall economy.
The statistics I have examined in this article are not focused on how much employment is in an industry or how much its employees are paid. Rather, the article examines data to identify industries in which employment trends would have been different if an auxiliary-like industry coding practice had been used, and then briefly explores the composition of industries in which those trends were most changed when the auxiliary-unit concept was used.
This article shows that, over the study period, several industries changed compositionally with respect to the noncore worksites that businesses own. Among the industries that changed the most over the period are wholesale trade and retail trade. The article also confirms that the worksite assignment of industry typically yields similar employment trend results to industry assignment made at the level of a UI account or an EIN, with some moderate deviations.
Kenneth W. Robertson, "Measuring industry employment, 1990–2018: a look at the auxiliary-unit concept," Monthly Labor Review, U.S. Bureau of Labor Statistics, April 2021, https://doi.org/10.21916/mlr.2021.7
1 For more information on the North American Industry Classification System (NAICS), see https://www.census.gov/naics/. The use of NAICS as an industry classification system is mandated for federal statistical agencies by the Office of Management and Budget. Having a common classification system allows data users to compare data from various federal statistical agencies, knowing that each agency defines industries in the same way. NAICS also facilitates efficient sampling and estimation, because within detailed industry and size-class cells, the business activities, employment, and wages across worksites are relatively homogenous.
2 The former concept of the auxiliary unit from the Standard Industrial Classification (SIC) system was not ideal. The concept was based on ownership as well as function, which tended to reduce the clarity of economic reports. For example, consider a large retail firm that operates its own warehouse, and suppose that the warehouse was classified as part of a retail-owned business (as it would be under the SIC system). Now suppose that the retailer decides to make the warehouse part of a separate company, with the retailer purchasing warehousing services from it. In this scenario, employment would have declined in retail trade and increased in warehousing and storage. But the employment decline really had nothing to do with retail trade; rather, it was about a company’s decision about which support services to own and which to purchase. By contrast, under NAICS, the warehouse would be assigned to the warehousing and storage industry, regardless of ownership. As a result, NAICS makes economic trends for warehousing and storage about that industry and its functions, rather than about who owns the warehouse. Nevertheless, note that this increased clarity of reporting about what is happening in individual industries can also obscure broader changes in businesses, especially in the longer term. Over the past few decades, for example, growth in e-commerce (retailers that do not operate in a traditional brick-and-mortar site) has led to that industry taking over a substantial portion of retail sales. This transformation of the retail sector affects employment in a number of industries that support e-commerce, including warehouses, and couriers and messengers.
3 See Standard Industrial Classification Manual, 1987 (Executive Office of the President, Office of Management and Budget, 1987), p. 13, https://www.naics.com/wp-content/uploads/2017/05/SIC-Full-1987-Manual.pdf.
4 Ibid., p. 16.
5 See North American Industry Classification System: United States, 2017 (Executive Office of the President, Office of Management and Budget, 2017), p. 3, https://www.census.gov/eos/www/naics/2017NAICS/2017_NAICS_Manual.pdf.
6 Ibid., pp. 19–20.
7 For more information, see the U.S. Bureau of Labor Statistics Quarterly Census of Employment and Wages page at https://www.bls.gov/cew/.
8 Note that some worksites enter the unemployment insurance system without having a NAICS industry code and are labeled “unclassified” until an industry code is assigned. Table 1 excludes a row for these records; therefore, the sum of the differences shown do not sum to zero.
9 In this article, the NAICS code is assigned as the two-digit industry with the single largest employment value among all two-digit industry employment values from worksites owned by the firm.
10 The professional and business services industry group includes the NAICS two-digit industries 54, 55, and 56.
11 The manufacturing industry includes the NAICS two-digit industries 31, 32, and 33.
12 The transportation and warehousing industry includes the NAICS two-digit industries 48 and 49.