An official website of the United States government
An official website of the United States government
The .gov means it's official.
Federal government websites often end in .gov or .mil. Before sharing sensitive information,
make sure you're on a federal government site.
The site is secure.
The
https:// ensures that you are connecting to the official website and that any
information you provide is encrypted and transmitted securely.
This article examines two alternate scenarios (moderate impact and strong impact) to estimate some of the long-term labor market changes that may result from the coronavirus disease 2019 (COVID-19) pandemic. The article first explores the conceptual differences between these sets of projections and the baseline projections released in September 2020.1 This discussion is followed by a description of the methodology for how the two sets of pandemic projections were produced. Finally, the article presents the resulting employment projections for both scenarios for selected industries and occupations.
The COVID-19 pandemic has caused massive short-term disruptions to the U.S. economy and labor market, but its long-term impacts remain unclear. The U.S. Bureau of Labor Statistics (BLS) employment projections capture long-term structural changes in the labor market, and the 2019–29 projections, released on September 1, 2020, reflect data preceding the pandemic.
As the pandemic took hold in the United States, total nonfarm employment dropped from 152.5 million to 137.8 million between February and June 2020, for a loss of 14.7 million jobs and a 9.6-percent employment decline. Some sectors were particularly hard hit, with hotels and motels employment declining 38.6 percent, air transportation employment declining 25.9 percent, and food services and drinking places employment declining 25.6 percent. Meanwhile, employment in grocery stores grew 3.5 percent.2 (See figure 1.)
Teleworking also became more common as a result of the pandemic. In August 2020, 24.3 percent of all employees reported having teleworked at some point in the prior month because of the pandemic.3
Since the pandemic has already had a major impact on employment in the United States, users of projections data may be interested to know how BLS is assessing the long-term impacts of the pandemic on the distribution of occupational and industry employment. Therefore, BLS developed alternate projections for the 2019–29 period as a first attempt to identify industries and occupations subject to comparatively high uncertainty as a result of the pandemic.
The BLS Employment Projections program estimates employment and occupational trends over a 10-year projections period. The employment projections for 2019–29 represent the baseline estimate of employment trends for the period, with no employment impacts stemming from the pandemic. A comparison of these baseline projections with the alternate scenarios presented here can demonstrate how changes in consumer and firm behavior caused by the pandemic may alter the projections for detailed occupations and industries over the same period.
Like the baseline projections, the alternate projections are estimates of long-term structural changes to the economy. They model potential pandemic-induced structural changes to the economy and the labor market by taking into account changes in consumer spending behavior and workplace structural changes resulting from the pandemic.
Two alternate scenarios, moderate impact and strong impact, were modeled as possible paths for the U.S. economy for 2019–29. The terms “moderate” and “strong” refer to the extent of long-term economic changes resulting from the pandemic. The strong impact scenario assumes more widespread, permanent changes to consumer and firm behavior as a way to mitigate viral spread.
In the moderate impact scenario, increased telework is the primary force of economic change and has both direct and spillover effects. With more employees teleworking, the need for office space will decline, and so will nonresidential construction. Spending for employee trips to offices, including commuting costs, business travel, and lunchtime restaurant spending, are all lower here than in the baseline projections.
In addition, several industries and occupational groups are projected to see increased demand in the moderate impact scenario. Increased telework will drive demand for information technology (IT) and computer-related occupations, particularly those involved in IT security. Changes in food consumption as a result of lower restaurant spending will lead to more spending at and employment in grocery stores. Public demand for better prevention, containment, and treatment of infectious diseases is also expected to lead to increased scientific and medical research funding.
In the strong impact scenario, the changes detailed for the moderate impact scenario remain, although the consumer and firm behaviors associated with them are amplified. Consumer preference for avoiding interpersonal contact leads to further declines for restaurant dining, travel, and accommodation. Telework continues to expand, leading to further gains for associated IT support positions. Additionally, people’s desire to avoid large crowds leads to declines in employment demand for industries that depend on large gatherings, including live sporting events, theaters, and concerts. Further efforts to avoid interpersonal contact also lead to more virtual services than in-person services, including telehealth, and to the automation of many in-person customer service positions.
The alternate projections identify industries and occupations whose future employment trajectories are subject to high levels of uncertainty because of the pandemic. The goal is not to produce precise estimates of employment change over the projections period.
Occupations and industries whose alternate projections deviate the most from their baseline projections are those which are subject to the greatest pandemic-induced uncertainty over the next 10 years. Conversely, occupations with little difference between baseline and alternate projections have a narrower range of likely paths and are subject to less uncertainty.
For example, employment of hosts and hostesses is projected to grow 8.2 percent in the baseline scenario, but it is expected to decline 10.8 percent in the moderate impact scenario and 18.0 percent in the strong impact scenario. This wide range means that employment of hosts and hostesses is subject to a high degree of uncertainty over the next 10 years. If restaurants largely revert to their prepandemic staffing preference for hosts and hostesses, the occupation is expected to grow. However, permanent changes to consumer and firm preference for reducing interpersonal contact could lead to either moderate or strong declines for the occupation.
In contrast, employment of chief executives is projected to decline 10.0 percent in the baseline scenario, 9.9 percent in the moderate impact scenario, and 10.2 percent in the strong impact scenario. The likely structural changes to consumer and firm behavior resulting from the pandemic (outlined above) do not lead to any significant staffing changes for chief executives that differ from the baseline. Therefore, the pandemic-induced uncertainty in the employment trend for chief executives is expected to be small.
This section presents the methodology used to develop the alternate projections, which involves adjustments to final demand, industry employment, and occupational staffing patterns.
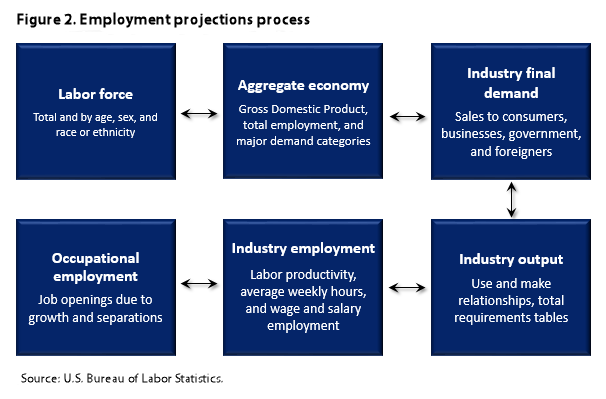
The 2019–29 projections were used as the baseline projections.4 These projections were developed in a process composed of six interconnected steps, each based on a different procedure (or model) and different assumptions. The six steps involve the labor force, the aggregate economy, industry final demand, industry output, industry employment, and occupational employment. The results obtained at each step are key inputs to subsequent steps, and the sequence may be repeated multiple times to allow feedback and ensure consistency. (See figure 2.)
The alternate scenarios discussed in this article use the baseline scenario as their starting point. Two aspects of the employment projections process were changed in these alternate scenarios: final demand and occupational staffing patterns. The changes made to final demand flow through the rest of the process and change the output and employment results.
In the alternate scenarios, the major final-demand projections from Macroeconomic Advisers by IHS Markit are no longer used as constraints for the modeled final-demand sectors. Without constraints, the final-demand categories that would see uncertainty in the form of increased or decreased demand by consumers and firms can be changed directly. Changing final demand, however, implicitly changes aspects of the macroeconomic projections in the baseline scenario.
In the next step of the process, the staffing patterns used in the BLS National Employment Matrix, which distributes employment from industries to detailed occupations, were altered. These changes were made to address the impacts of the revised assumptions on structural changes in within-industry staffing decisions.
Final demand is split up into 11 different groups—personal consumption expenditures (PCE), private investment in equipment, private investment in intellectual property products, private investment in nonresidential structures, private investment in residential structures, change in private inventories, exports of goods and services, imports of goods and services, federal government defense consumption and investment, federal government nondefense consumption and investment, and state and local government consumption and investment. The Employment Projections program uses 153 final-demand sectors in its projections.
The output in each final-demand sector is distributed to different commodity sectors with the use of a distribution matrix. A final-demand sector can have a 1-to-1 or 1-to-many mapping to commodity sectors. For example, PCE final-demand sector 19, telephone and related communication equipment, has a 1-to-1 mapping to commodity sector 71, communications equipment manufacturing. However, PCE final-demand sector 10, information processing equipment, has a 1-to-many mapping to seven different commodity sectors.5 The Employment Projections program defines 205 sectors to represent both industries and commodities.6 By distributing the final demand to different sectors, the program calculates total final demand for each commodity.
The input–output framework used for the projections describes relationships between the final demand for commodities and the output and employment needed in each industry to meet that demand. The first change made for the alternate scenarios is the change to final demand for commodities—that is, any pandemic-induced increase or decrease in consumer demand for a particular good or service. The
By changing final demand, one can derive the structural changes resulting from people’s behavioral changes, seeking to find out what happens to employment when people change their spending practices because of the pandemic.7 Because this exercise focuses on how spending behaviors affect employment, most of the changes made to final demand are associated with the PCE grouping of final-demand sectors. The final-demand changes are the basis for the employment changes in the alternate scenarios.
Tables 1 and 2 show the intersection of the aforementioned final-demand sectors and the commodity sectors within the complete final-demand distribution matrix. For example, final-demand sector 120, private investment in nonresidential structures, is distributed to five different commodity sectors. Table 1, however, shows that the only commodity sector whose final demand was changed as a result of final-demand changes to sector 120 was commodity sector 15, construction. If the final demand at the intersection of final-demand sector 120 and commodity sector 15 is 100 in 2029 in the baseline scenario, a 5-percent decrease indicates that the output at that intersection in the moderate impact scenario is 95 in 2029.
| Sector number | Sector title | Final-demand number | Final-demand title | Percent change in demand from baseline |
|---|---|---|---|---|
15 | Construction | 120 | Private investment in nonresidential structures | -5 |
39 | Pharmaceutical and medicine manufacturing | 29 | Pharmaceutical and other medical products | 5 |
70 | Computer and peripheral equipment manufacturing, excluding digital camera manufacturing | 10 | Information processing equipment | 5 |
83 | Aerospace product and parts manufacturing | 99 | Aircraft | -5 |
90 | Medical equipment and supplies manufacturing | 16 | Therapeutic appliances and equipment | 5 |
90 | Medical equipment and supplies manufacturing | 85 | Medical instruments | 5 |
94 | Food and beverage stores | 81 | Margins on personal consumption expenditures, retail trade | 5 |
95 | General merchandise stores | 81 | Margins on personal consumption expenditures, retail trade | -5 |
96 | All other retail | 81 | Margins on personal consumption expenditures, retail trade | -5 |
97 | Air transportation | 51 | Air transportation | -5 |
97 | Air transportation | 76 | Foreign travel by U.S. residents | -5 |
99 | Water transportation | 52 | Water transportation | -5 |
99 | Water transportation | 76 | Foreign travel by U.S. residents | -5 |
101 | Transit and ground passenger transportation | 50 | Ground transportation | -5 |
104 | Couriers and messengers | 67 | Postal and delivery services | 13 |
107 | Software publishers | 114 | Private investment in software | 3 |
107 | Software publishers | 10 | Information processing equipment | 3 |
111 | Wired telecommunications carriers | 68 | Internet access | 5 |
114 | Data processing, hosting, and related services | 114 | Private investment in software | 5 |
129 | Computer systems design and related services | 114 | Private investment in software | 5 |
131 | Scientific research and development services | 115 | Private investment in research and development | 5 |
167 | Accommodation | 59 | Accommodations | -7 |
168 | Food services and drinking places | 57 | Purchased meals and beverages | -7 |
Source: U.S. Bureau of Labor Statistics. | ||||
| Sector number | Sector title | Final-demand number | Final-demand title | Percent change in demand from baseline |
|---|---|---|---|---|
15 | Construction | 120 | Private investment in nonresidential structures | -10 |
39 | Pharmaceutical and medicine manufacturing | 29 | Pharmaceutical and other medical products | 5 |
70 | Computer and peripheral equipment manufacturing, excluding digital camera manufacturing | 10 | Information processing equipment | 5 |
83 | Aerospace product and parts manufacturing | 99 | Aircraft | -10 |
83 | Aerospace product and parts manufacturing | 132 | Exports of goods and services | -10 |
85 | Ship and boat building | 100 | Ships and boats | -10 |
85 | Ship and boat building | 132 | Exports of goods and services | -10 |
90 | Medical equipment and supplies manufacturing | 16 | Therapeutic appliances and equipment | 5 |
90 | Medical equipment and supplies manufacturing | 85 | Medical instruments | 5 |
94 | Food and beverage stores | 81 | Margins on personal consumption expenditures, retail trade | 5 |
95 | General merchandise stores | 81 | Margins on personal consumption expenditures, retail trade | -10 |
96 | All other retail | 81 | Margins on personal consumption expenditures, retail trade | -10 |
97 | Air transportation | 51 | Air transportation | -10 |
97 | Air transportation | 76 | Foreign travel by U.S. residents | -10 |
98 | Rail transportation | 50 | Ground transportation | -3 |
99 | Water transportation | 52 | Water transportation | -10 |
99 | Water transportation | 76 | Foreign travel by U.S. residents | -10 |
101 | Transit and ground passenger transportation | 50 | Ground transportation | -10 |
104 | Couriers and messengers | 67 | Postal and delivery services | 30 |
107 | Software publishers | 114 | Private investment in software | 5 |
107 | Software publishers | 10 | Information processing equipment | 5 |
111 | Wired telecommunications carriers | 68 | Internet access | 8 |
114 | Data processing, hosting, and related services | 114 | Private investment in software | 10 |
129 | Computer systems design and related services | 114 | Private investment in software | 10 |
131 | Scientific research and development services | 115 | Private investment in research and development | 10 |
137 | Employment services | 72 | Professional and other services | 3 |
139 | Travel arrangement and reservation services | 50 | Ground transportation | -15 |
139 | Travel arrangement and reservation services | 56 | Other recreational services | -15 |
147 | Offices of physicians | 43 | Physician services | -1 |
148 | Offices of dentists | 44 | Dental services | -2 |
151 | Medical and diagnostic laboratories | 45 | Paramedical services | 5 |
159 | Performing arts companies | 53 | Membership clubs, sports centers, parks, theaters, and museums | -5 |
160 | Spectator sports | 53 | Membership clubs, sports centers, parks, theaters, and museums | -10 |
161 | Promoters of events, and agents and managers | 53 | Membership clubs, sports centers, parks, theaters, and museums | -10 |
162 | Independent artists, writers, and performers | 53 | Membership clubs, sports centers, parks, theaters, and museums | -15 |
163 | Museums, historical sites, and similar institutions | 53 | Membership clubs, sports centers, parks, theaters, and museums | -5 |
164 | Amusement parks and arcades | 53 | Membership clubs, sports centers, parks, theaters, and museums | -5 |
165 | Gambling industries (except casino hotels) | 55 | Gambling | -10 |
166 | Other amusement and recreation industries | 53 | Membership clubs, sports centers, parks, theaters, and museums | -5 |
167 | Accommodation | 59 | Accommodations | -12 |
168 | Food services and drinking places | 57 | Purchased meals and beverages | -12 |
175 | Drycleaning and laundry services | 73 | Personal care and clothing services | -10 |
Source: U.S. Bureau of Labor Statistics. | ||||
Some final-demand categories have contributed to growth or decline in demand for multiple commodity categories. For example, final-demand sector 114, private investment in software, is distributed to four different commodity sectors. Table 1 shows that final demand was changed for three of the four commodity sectors. When the output of a commodity sector changes, the distribution within the final-demand sector that sources that change is altered.
Generally, in the moderate impact scenario, demand at specific intersections of final-demand sectors and commodity sectors increases or decreases by 5 percent, with some exceptions. In the strong impact scenario, the magnitudes of many of these changes increase, with some new commodities being affected by additional demand changes. Tables 1 and 2 show all of the final-demand changes leading to the employment changes discussed in the analysis section.
The BLS National Employment Matrix apportions industry employment into detailed occupations. The matrix shows the distribution of occupational employment for wage and salary workers by industry, as well as the distribution of self-employed workers by occupation. These distributions are called staffing patterns. For the alternate projections, staffing patterns were altered in each scenario to account for the changes employers are expected to make under the alternate assumptions.
For example, in the moderate impact scenario, there was a projected final-demand increase in industry sector 131, scientific research and development services, because of increased demand for infectious disease research, treatments, and cures. Running that final-demand increase through the employment requirements matrix resulted in increased industry employment as well. That industry employment is distributed, with the use of staffing patterns, to different occupations. By changing staffing patterns, the overall increase in industry employment can be directed to occupations specifically involved in infectious disease research, such as epidemiologists and microbiologists. If the staffing patterns were not changed, employment for all occupations in the industry would increase uniformly, which would result in comparable increases for occupations less related to infectious disease research, such as physicists.
Another example, this time from the strong impact scenario, involves the projected final-demand decrease in performing arts industries—a decrease caused by consumers’ wariness to gather in large groups, specifically when indoors. The final-demand decrease for these industries caused industry employment decreases, which resulted in occupational employment decreases. The occupations that are expected to see their employment decrease can be targeted specifically by making staffing pattern changes. In this case, ushers, lobby attendants, and ticket takers are taking a reduced share from the industry employment.
This section examines the simulation results from the moderate and strong impact scenarios. The analysis highlights industries and occupations whose alternate projections diverge the most from their baseline projections. As mentioned previously, given uncertainty about the labor market outlook over the next decade, the purpose of these projections is to provide guidance on some of the potential long-term labor market impacts due to the pandemic rather than to provide specific values for any resulting changes in employment.
This subsection presents the results for the industry employment gains and losses expected under the two alternate scenarios.
The retail trade industry is projected to experience the largest employment loss among all industries in both scenarios. In the moderate impact scenario, employment in the industry is projected to decline by 681,800 from 2019 to 2029, a decline of 4.4 percent, almost doubling the drop seen in the baseline projections. (See figure 3.) In the strong impact scenario, the industry is projected to lose 1.1 million jobs, a decline of 7.2 percent, erasing the job gains of the previous decade. With the exception of food and beverage stores and nonstore retailers, which are projected to see stronger employment under both alternate scenarios, employment in all retail industries is expected to weaken relative to the baseline projections. The deeper contractions in retail trade employment are due to an expected acceleration in a number of trends already set in motion prior to the COVID-19 pandemic.
Short-term consumer behavioral changes aiming to reduce human interaction and avoid crowded places have favored the e-commerce market and are likely to be “sticky,” further solidifying the existing trend toward more online shopping.8 Many traditional brick-and-mortar retailers have suffered from falling sales amid lockdown measures designed to reduce the spread of the virus, and several large department store chains have already announced nationwide store closures or declared bankruptcy.9 These developments suggest that the retail sector is likely to continue to see consolidation of big-box stores and that the overall physical retail footprint countrywide may shrink in the long term. This prospect could be exacerbated by the rise in telework, which may reduce foot traffic along traditional storefronts. Meanwhile, pandemic-related long-term changes to the in-store shopping experience of consumers will likely include an increase in contactless transactions through the use of mobile phone applications or self-service checkout kiosks.
One of the major assumptions underlying many of the most notable changes in the alternate projections is the expectation that telework will be offered on a more permanent basis. According to a BLS analysis, working from home is generally feasible in management, professional, and administrative support jobs, including those in the information, financial activities, professional and business services, and public administration industries.10 Consumer surveys also suggest that many American workers prefer to continue some form of telework arrangement even after the pandemic subsides.11 Telework has also been shown to increase employee happiness and not to hinder productivity.12 A higher prevalence of telework over the long term has ramifications for employment in various industries, including accommodation, food services, transportation, construction, and information and computer-related industries.
Working from home can greatly reduce consumers’ demand for dining out as the lunch-hour rush is replaced with more at-home dining. Consumers may also prefer to continue using delivery, takeout, or curbside pickup services after the pandemic dissipates, which would possibly reduce staffing requirements for restaurant dining rooms and food counters. Within this context, in the moderate impact scenario, employment growth in the food services and drinking places industry is projected to be relatively anemic, at 1.3 percent between 2019 and 2029, compared with a 7.3-percent rise in the baseline scenario. The estimates for the moderate impact scenario suggest that 156,200 jobs will be added to the food services and drinking places industry, an increase representing 720,600 fewer new jobs than those expected in the baseline scenario. In the strong impact scenario, on the other hand, employment is seen falling 3.1 percent over the 10-year projections period, dropping by 376,900, down to a level of 11.7 million in 2029. This decrease is the result of declines in employment in restaurants and other eating places, drinking places (alcoholic beverages), and special food services.
With a higher percentage of employees working from home, demand for transportation is expected to decline over the 2019–29 projections period. Demand for public transportation is expected to be stifled by fewer workers commuting to offices. Employment growth in the transit and ground passenger transportation sector is projected to moderate from 5.3 percent in the baseline scenario to 2.9 percent in the moderate impact scenario and 0.4 percent in the strong impact scenario. (See figure 4.) This projected slowdown is due to expected employment contractions in urban transit systems, interurban and rural bus transportation, and taxi and limousine services.
The pandemic also is expected to have consequences for business travel, because many companies are likely to see such travel as an avoidable cost at a time when virtual meetings are widely used. Business travel will continue, but with reduced prevalence. As a result, employment in air transportation is expected to be lower than that estimated in the baseline scenario. In the moderate impact scenario, the air transportation workforce is projected to increase 2.8 percent by 2029, compared with 5.9 percent in the baseline scenario. This translates into 15,300 fewer jobs being created because of increased telework and weaker business travel. In the strong impact scenario, employment in air transportation is projected to drop 0.3 percent, down to a level of 501,300 in 2029, which is 31,200 fewer jobs than the level seen in the baseline projections.
Moreover, weaker business travel is expected to affect demand for accommodation. In the moderate impact scenario, employment in the traveler accommodation industry is projected to decline by 82,800, or 4.2 percent, compared with a 0.3-percent dip in the baseline scenario. In the strong impact scenario, the industry is expected to suffer an additional loss of 89,400 jobs relative to the moderate impact scenario, with employment dropping from 2.0 million in 2019 to 1.8 million in 2029, a decrease of 8.6 percent. (See figure 3.)
Finally, the last sector expected to experience a substantial negative impact from the shift to telework is construction. Because the rise in telework is expected to shrink demand for new office spaces, in the moderate impact scenario, nonresidential building construction is projected to decline 2.0 percent between 2019 and 2029. (See figure 5.) This decline contrasts with a 4.2-percent increase expected in the baseline projections. In the strong impact scenario, the decline in employment is projected to deepen to 3.8 percent. Weaker demand for nonresidential construction is likely to spill over into reduced demand for various construction industries (e.g., land subdivision; building equipment contractors; electrical contractors; and plumbing, heating, and air conditioning contractors), putting a damper on employment growth.
On the other hand, employment growth in residential building construction is projected to be greater in the moderate impact scenario than in the baseline projections, which should partly offset some of the negative effects on the construction sector. Greater workplace flexibility and the disproportionate impact of COVID-19 on high-density urban areas are driving a “flight to the suburbs.”13 With telework becoming more prevalent, some Americans are choosing to migrate out of cities to areas where housing is more affordable, and low mortgage rates in the short term should further support housing demand. That said, the long-term sustainability of this trend will be determined by many factors, including the overall health of the economy, the trajectory of interest rates, and consumers’ access to credit.
All in all, construction is seen adding 197,300 jobs in the moderate impact scenario and 90,500 jobs in the strong impact scenario, down from the over 300,200 new jobs expected in the baseline scenario.
In the strong impact scenario, several additional industries are expected to have notable employment changes that are not reflected in the moderate impact scenario. A 2005–06 Congressional Budget Office report noted that one of the largest macroeconomic impacts of a potential pandemic would be seen in the arts and recreation industries,14 and, in fact, data from the U.S. Bureau of Economic Analysis show that these industries were affected dramatically when the COVID-19 pandemic started.15 Altered social behaviors in the strong impact scenario are expected to reduce demand for and attendance at concerts, sporting events, amusement parks, and other entertainment offerings. Consequently, employment growth in the performing arts, spectator sports, and related industries is projected to stagnate in this scenario, adding only 5,300 new jobs over the 10-year projections period, compared with 27,600 new jobs in the baseline scenario.
Several industries are expected to benefit from structural labor market changes caused by the virus and the health implications of the global pandemic. These industries are predominantly concentrated in scientific research and development and in IT and computer-related fields.
In the moderate impact scenario, employment growth in research and development in the physical, engineering, and life sciences is projected to more than double from the baseline projections, accelerating from 4.1 to 8.4 percent. This growth translates into 55,600 new jobs being added to the industry from 2019 to 2029, bringing its employment level to about 720,400, compared with 692,300 in the baseline projections. In the strong impact scenario, industry employment is expected to rise further, to 748,300, an increase of 12.6 percent. Increased demand for research into infectious disease properties, treatments, and cures underpins the projected rise in employment.
Likewise, employment in the pharmaceutical and medicine manufacturing industry also stands to benefit from increased preparation for pandemics and production of vaccines. Employment in this industry is seen growing roughly 19 percent in both alternate scenarios, accelerating from 5.4-percent growth in the baseline scenario. (See figure 6.) As a result, the industry’s employment level is projected to climb to 363,900 in the moderate impact scenario and to 365,200 in the strong impact scenario.
The increase in telecommuting over the long term should also benefit computer-related manufacturing and services. Stronger demand for computers, software, and related equipment to outfit home workstations is expected to drive an increase in computer and peripheral equipment manufacturing employment, which is projected to reach a level of 194,100 by 2029 in both alternate scenarios, up from 163,000 in 2019, rising 19.1 percent over the decade. (See figure 7.)
Moreover, increased telework should also strengthen demand for IT support systems and cyber security. In the baseline scenario, employment growth in the computer systems design and related services industry is projected to be much faster (26.1 percent) than the average for all industries (3.7 percent), with employment rising by 574,500 and reaching a level of 2.8 million in 2029. Under the moderate impact scenario, greater demand for computer systems design and related services is projected to boost the 10-year growth rate to 29.0 percent, adding an additional 65,200 workers to the industry’s workforce solely because of the aftereffects of the pandemic. Under the strong impact scenario, employment growth accelerates to 31.8 percent, representing 126,300 new positions due to increased demand relative to the baseline.
Figure 8 shows the differences in percent changes in employment between the baseline and alternate scenarios across all two-digit North American Industry Classification System industries.
The aforementioned impacts of increased telework, weaker business travel, increased online shopping, expanded contactless ordering, greater demand for IT support systems, and more intensive medical research are expected to disproportionately affect some occupations in the industries discussed earlier. This section highlights some of the main occupations identified as more likely to experience long-term structural changes as a result of the pandemic. This list is by no means exhaustive, but it highlights either occupations with substantial increases or substantial declines in employment or occupations with significant deviations from the baseline projections.
One pandemic impact identified as a driver of staffing pattern changes in the labor market is the accelerated use of contactless payments and transactions. This trend, along with the automation of checkout positions, was already in place before the pandemic hit and was partly responsible for the projected decline in sales and related occupations (such as cashiers) in the baseline projections.16 Checkout automation is expected to accelerate because of the pandemic, with businesses attempting to reduce direct interaction between staff and customers in the short term.
These factors, paired with a stronger displacement of brick-and-mortar retail by online shopping, are expected to sharply reduce the number of cashiers needed. In the baseline projections, cashiers are expected to lose 265,300 jobs by 2029, a decline of 7.4 percent. In the moderate impact scenario, the occupation’s job losses are expected to nearly double, for a total loss of 511,000 jobs over the 10-year projections period, a decline of 14.2 percent. Meanwhile, in the strong impact scenario, more permanent changes to consumer behavior are projected to lead to an even greater decline in cashier positions, resulting in a total loss of 714,500 jobs, a decrease of 19.8 percent. (See figure 9.)
Similarly, the increasing adoption of automation and productivity-enhancing technology in clerical and administrative work is likely to accelerate the use of online appointment booking systems and automated check-in kiosks. A potential strengthening of these trends underlies the projected decline in demand for receptionists and information clerks. In the moderate impact scenario, the occupation is projected to lose about 24,300 jobs over the 10-year projections period. In the strong impact scenario, the occupation is expected to shed as many as 114,900 jobs. This greater drop partly results from an expected decline in demand for receptionists in healthcare—a decline due to an assumed rise in the use of telehealth in the strong impact scenario.
Accelerated automation and reduced human interaction also account for substantial changes in the projections for several occupations related to travel and accommodation. Online and mobile phone booking systems are expected to reduce the number of available jobs for reservation and transportation ticket agents and travel clerks, while automated self-check-in stands and mobile phone room keys are expected to dampen demand for hotel, motel, and resort desk clerks.
In the moderate impact scenario, employment of reservation and transportation ticket agents and travel clerks is projected to fall from 126,300 in 2019 to 112,200 in 2029. In the strong impact scenario, the employment level falls further, down to 102,200 by the end of the projections period. Meanwhile, in the moderate impact scenario, the number of hotel, motel, and resort desk clerks is projected to shrink by 30,100, dropping to a level of 246,500 by 2029. In the strong impact scenario, the occupation is expected to lose as many as 60,700 jobs because of a sharper reduction in business travel, weaker demand for tourism, and stronger consumer preferences for reduced human interaction.
In the food services and drinking places industries, the occupations projected to have the largest changes in employment relative to the baseline projections are waiters and waitresses, hosts and hostesses, bartenders, and cooks at institutions and cafeterias. Many restaurants will likely continue to seek ways to reduce contact between employees and customers, including through the use of contactless ordering on mobile phone applications or online. Potential long-term trends of increased delivery, takeout, and curbside pickup services, coupled with adapted restaurant floor plans to limit capacity, prevent congestion, and help consumers feel safe while dining out, are expected to constrain employment of restaurant staff. Increased telework will likely reduce the number or size of office cafeterias, decreasing demand for cooks at institutions and cafeterias.
Employment for waiters and waitresses is projected to fall 5.6 percent between 2019 and 2029 in the moderate impact scenario, compared with a 3.7-percent increase in the baseline projections. (See figure 10.) Likewise, employment of hosts and hostesses is expected to fall 10.8 percent in the moderate impact scenario, a sharp reversal from the baseline’s 8.2-percent surge in employment. The number of bartenders is projected to shrink by 2.1 percent in the moderate impact scenario, compared with a 5.9-percent expansion in the baseline projections.
In the strong impact scenario, increased telework and a greater likelihood that consumers will prefer to avoid crowded places are expected to result in a 12.9-percent contraction in employment of waiters and waitresses. In the same scenario, employment of hosts and hostesses is expected to decrease by 18.0 percent, while employment of bartenders is projected to drop by 13.8 percent.
As noted previously, altered social behaviors are likely to involve reduced attendance of entertainment offerings such as live performances. As a result, in the strong impact scenario, employment of musicians and singers is projected to decline 1.7 percent from 2019 to 2029, compared with a 0.9-percent increase in the baseline projections. Meanwhile, accelerated automation and reduced human interaction are projected to weigh on demand for ushers, lobby attendants, and ticket takers. Employment in this occupation is expected to contract 7.2 percent over the 10-year projections period, losing 10,000 jobs.
Employment in several occupations is poised to strengthen because of the effects of the pandemic. As noted earlier, a key assumption underlying the alternate scenarios is an acceleration in job growth both in medical research and development and in several IT and computer-related occupations.
Given the unprecedented impact of the COVID-19 pandemic on daily life, as well as the heightened uncertainty surrounding the mechanisms of disease spread and the best policies for mitigating contagion, both the public and private sectors will likely pay greater attention to pandemic preparedness going forward. This development should fuel demand for epidemiologists, medical scientists, biochemists and biophysicists, and biological technicians. Gains for these occupations are expected to be broadly similar between the two alternate scenarios under the assumption that the increased need for future pandemic preparation and medical research will be paramount in either scenario.
Epidemiologists are a relatively small occupation, with an employment level of 8,000 in 2019. The occupation’s employment is expected to grow about 31 percent over the projections period in both alternate scenarios—a significant increase from the 4.6-percent growth in the baseline scenario. (See figure 11.) However, this acceleration will account for only about 2,500 new jobs over the next decade. Medical scientists, biochemists and biophysicists, and biological technicians are projected to experience similarly marked accelerations in employment growth. As the largest medical research occupation considered here, medical scientists are projected to add roughly 40,000 new jobs in both alternate scenarios, compared with only 8,400 new jobs in the baseline projections.
Given that telework will likely persist in American worklife moving forward, another occupational group that is expected to experience stronger growth in the alternate scenarios includes IT and computer-related occupations. A rise in telework, particularly for companies that did not offer telecommuting before the pandemic, should boost demand for software, IT infrastructure, and cybersecurity. As was the case with the medical-related occupational group, employment growth in IT and computer-related occupations is projected to be only slightly faster in the strong impact scenario than in the moderate impact scenario. This expectation is based on the assumption that, after an initial investment in a telework infrastructure, the same software can serve a larger audience with marginal cost of production.
In the baseline projections, information security analysts were among the top 10 fastest growing occupations. The increase in telework and robust demand for work-related digital security are expected to make these analysts the fourth-fastest-growing occupation in either alternate scenario. Software developers and software quality assurance analysts and testers are also expected to experience much-faster-than-average growth, because increased telecommuting is likely to boost demand for new web applications and platforms. Likewise, greatly expanded telework should drive increased employment for computer and information research scientists. (See figure 12.)
Figure 13 shows the differences in percent changes in employment between the baseline projections and the alternate scenarios for all occupational groups covered in the employment projections.
The COVID-19 pandemic has caused a substantial shock to the U.S. labor market and significantly altered consumer and business behavior. For this article, the BLS Employment Projections program designed two alternate scenarios to estimate some of the long-term structural labor market changes that could result from the pandemic. By altering final demand for selected industries and occupational staffing patterns in the baseline 2019–29 projections, the program has provided an estimate of how the potential shifts in consumer spending behavior and workplace structural changes can affect employment levels over the next decade.
The 2020–30 projections, scheduled to be released in September 2021, will include full revisions to the labor force and macroeconomic projections, as well as a more thorough assessment of the ramifications of the pandemic for the detailed industry and occupational projections. As the pandemic situation and the public response to it continue to evolve, uncertainty about the trajectory of the economic recovery is likely to remain elevated in 2021. However, additional information on the extent of the economic effects of the pandemic, as well as data on which of these effects may prove to be long-term trends, will be used to inform the research that underlies the 2020–30 projections. As a result, the next projections cycle may see revisions to the significance of the factors identified in the present alternate scenarios or the degree to which the 2020–30 industry and occupational employment projections deviate from the 2019–29 projections.
Lindsey Ice, Michael J. Rieley, and Samuel Rinde, "Employment projections in a pandemic environment," Monthly Labor Review, U.S. Bureau of Labor Statistics, February 2021, https://doi.org/10.21916/mlr.2021.3
1 For detailed information on the 2019–29 projections, see Kevin S. Dubina, Janie-Lynn Kim, Emily Rolen, and Michael J. Rieley, “Projections overview and highlights, 2019–29,” Monthly Labor Review, September 2020, https://doi.org/10.21916/mlr.2020.21.
2 “CES national databases,” Current Employment Statistics—CES (national) (U.S. Bureau of Labor Statistics), seasonally adjusted data for all employees for February–June 2020, https://www.bls.gov/ces/data/.
3 “Supplemental data measuring the effects of the coronavirus (COVID-19) pandemic on the labor market” (U.S. Bureau of Labor Statistics), table 1, https://www.bls.gov/cps/effects-of-the-coronavirus-covid-19-pandemic.htm.
4 For detailed information on these projections and how they were developed, see “Employment projections,” Handbook of Methods (U.S. Bureau of Labor Statistics), https://www.bls.gov/opub/hom/emp/pdf/emp.pdf.
5 Final-demand category 10, information processing equipment, is distributed to commodity sectors 65 (commercial and service industry machinery manufacturing, including digital camera manufacturing), 70 (computer and peripheral equipment manufacturing, excluding digital camera manufacturing), 73 (semiconductor and other electronic component manufacturing), 91 (other miscellaneous manufacturing), 107 (software publishers), 114 (data processing, hosting, and related services), and 204 (used and secondhand goods).
6 The industry sectoring plan is documented on the Employment Projections program webpage (https://www.bls.gov/emp/documentation/crosswalks.htm). Industries and commodities use the same sectoring plan.
7 For simplicity of analysis, the section of final demand involving imports of goods and services has been left unchanged.
8 Denise Lee Yohn, “The pandemic is rewriting the rules of retail,” Harvard Business Review, July 6, 2020, https://hbr.org/2020/07/the-pandemic-is-rewriting-the-rules-of-retail.
9 Hayley Peterson, “Department stores are shutting down across the US—here’s the list of stores that Macy’s, Nordstrom, JCPenney and others have announced for closure,” Business Insider, August 7, 2020, https://www.businessinsider.com/macys-nordstrom-jcpenney-neiman-marcus-sears-stores-closing-list-2020-8.
10 Matthew Dey, Harley Frazis, Mark A. Loewenstein, and Hugette Sun, “Ability to work from home: evidence from two surveys and implications for the labor market in the COVID-19 pandemic,” Monthly Labor Review, June 2020, https://doi.org/10.21916/mlr.2020.14.
11 “It's time to reimagine where and how work will get done” (PwC, January 12, 2021), https://www.pwc.com/us/en/library/covid-19/us-remote-work-survey.html.
12 Ibid.; and Prithwiraj Choudhury, Cirrus Foroughi, and Barbara Larson, “Work-from-anywhere: the productivity effects of geographic flexibility,” Working Paper 19-054 (Boston, MA: Harvard Business School, November 2018, revised August 2020).
13 Lucia Mutikani, “Flight to suburbs boosts U.S. homebuilding, but COVID-19 surge erodes consumer sentiment,” Reuters, July 17, 2020, https://www.reuters.com/article/us-usa-economy-idUSKCN24I1OY.
14 Robert Arnold, Jeanne De Sa, Tim Gronniger, Allison Percy, and Julie Somers, “A potential influenza pandemic: possible macroeconomic effects and policy issues” (Congressional Budget Office, December 8, 2005, revised July 27, 2006), https://www.cbo.gov/sites/default/files/109th-congress-2005-2006/reports/12-08-birdflu.pdf.
15 See recreation services category in table 2.4.6U, “Real personal consumption expenditures by type of product, chained dollars” (U.S. Bureau of Economic Analysis), https://apps.bea.gov/iTable/iTable.cfm?reqid=19&step=2&isuri=1&1921=underlying#reqid=19&step=2&isuri=1&1921=underlying.
16 Dubina et al., “Projections overview and highlights, 2019–29.”