An official website of the United States government
An official website of the United States government
The .gov means it's official.
Federal government websites often end in .gov or .mil. Before sharing sensitive information,
make sure you're on a federal government site.
The site is secure.
The
https:// ensures that you are connecting to the official website and that any
information you provide is encrypted and transmitted securely.
A nation’s productivity growth often is referred to as a key determinant of economic prosperity. Some studies have found that U.S. productivity growth accounts for more than a quarter of the growth in the nation’s gross domestic product (GDP), thereby benefiting the nation’s population through an improved living wage.1 The air transportation industry has been an essential component in facilitating commerce and growth in developed nations, at the same time exposing less developed nations to tourism and trade. Understanding the role that productivity plays in this vital industry is important to understanding how that industry is contributing to the nation’s economic growth.
During and since the 1990s, the U.S. economy has undergone three recessions (July 1990–March 1991, March 2001–November 2001, December 2007–June 2009), each having a substantial impact on the air transportation industry. The effects of the September 11, 2001, tragedy were particularly devastating to the airline industry and lingered well into the next year, forcing the industry to adapt to the changing security environment in an already difficult financial time.
For the consumer, the air travel experience has changed notably during the past two decades. The introduction of security screening after September 11 is just one example of change in an industry that has had to redefine itself virtually overnight in order to survive. Another adaptation is the ability for consumers to purchase tickets and check into the airline by using automated ticket machines and mobile devices; previously, tickets were purchased from a travel agency for transport. In addition, advances in aircraft design have increased fuel efficiency and capacity, reducing the burden on airlines.
This article examines productivity trends in the airline industry over the past two-and-a-half decades and how those trends fit in with other trends in the U.S. economy as a whole. The article also adds another productivity perspective to an industry in which disparate measures of productivity growth have been observed across U.S. governmental agencies. Employing a new labor composition measure recently released by the U.S. Bureau of Labor Statistics (BLS),2 the article further examines trends in labor productivity growth that represent growth in output over and above growth in labor input. Finally, the article looks at growth in multifactor productivity, defined as a measure of economic performance that compares the amount of goods and services produced (output) with the amount of combined inputs used to produce those goods and services. It is this last measure that, by accounting for all of the factors of production, aligns more closely with the concept of economic innovation and technical change as outlined by the Organisation for Economic Co-operation and Development.3 The analysis that follows is an update of several previous studies of air transportation productivity trends; it has the key feature of integrating the air transportation industry into the framework of the U.S. economy, and it also provides quantifiable measures of the industry’s impact on productivity growth in the overall economy.
Allowing for the primary impacts of aviation on the economy, as well as the secondary impacts through direct and indirect sales and through payroll impacts to the supporting industries, reveals that aviation accounts for more than 5 percent of U.S. GDP growth while operating close to 9 million flights in the United States per year.4 The industry accomplishes the transfer of passengers and cargo to different destinations through purchasing or leasing many inputs, including aircraft, fuel, maintenance materials, and ticketing services, and through employing many other inputs, such as pilots and flight personnel, maintenance personnel, and check-in staff. More broadly, airline industry production is a function of various labor, capital, energy, material, and service input components.
The labor productivity measure captures output growth due to transporting cargo and passengers, over and above labor hours growth, where “labor hours” is defined as the total number of hours worked by the various employees in the industry. Changes in labor productivity embody many factors, including changes in technology, employee effort, organizational efficiencies, and the amount and efficiency of other factors of production, such as capital and intermediate purchases. Official national estimates of U.S. labor productivity are published by BLS both annually and quarterly.5
Multifactor productivity measures output growth over and above growth in the multiple inputs to production: labor, fuel, materials, purchased services, and capital. In 2012, BLS collaborated with the U.S. Bureau of Economic Analysis (BEA) to create a joint integrated production account. This account estimates multifactor productivity growth within a framework that is consistent with U.S. national estimates of GDP, the principal indicator of economic performance in the nation.6
As mentioned earlier, a number of studies have examined productivity trends in the air transportation industry. Most have found that the industry achieved rapid productivity growth across many periods. The official BLS estimates of statistics relating to air transportation also show substantial longer term growth and validate much of what other literature has uncovered. What has been missing from these studies thus far is a quantifiable way to measure how much the industry contributes to the nation’s productivity growth.
Although the BEA/BLS integrated production account has a framework for obtaining a quantifiable measure of how much the air transportation industry affects the nation’s multifactor productivity growth, there is a discrepancy in productivity measures concerning that particular industry. The issue is that the two agencies use different methodologies. The result is the largest discrepancies between the two agencies of any industry measured in the economy.
With the original release of the BEA/BLS integrated production account in 2012, the average annual difference in the multifactor productivity growth rate for air transportation between the two agencies stood at 2.5 percent from 1998 to 2010. That difference is fairly substantial, considering that a multifactor productivity growth rate of 2.5 percent would have been the third-fastest productivity growth rate in the economy over that period.7 A comparison using the latest releases from both agencies and incorporating revised source data reveals a growing difference in the air transportation multifactor productivity measures, with the discrepancy during the same period now standing at 4.6 percent. Specifically, the BEA/BLS integrated production account measure barely grew, rising an average of 0.1 percent annually, whereas the BLS measure rose an average annual 4.7 percent, over the 1998–2010 period. This difference provides an opportunity for the Federal Aviation Administration (FAA), the agency responsible for providing the safest, most efficient aerospace system in the world, to weigh in and use data from both the U.S. Department of Transportation and the airlines to add insight into the role of this important industry in the economy.
As the original BEA/BLS integrated production account work acknowledged, differences in air transportation productivity measures stem from discrepancies in the real-output measures between the two agencies. The BLS Productivity Program uses a concept of sectoral output, and the BEA/BLS integrated production account measures gross output, with the difference between them being the transfers between establishments within the same industry. In addition, there are differences in the method used to calculate real output: BLS aggregates revenue passenger miles and revenue ton-miles to calculate the physical quantity of output produced by the air transportation industry, while BEA employs a deflated revenue stream to compute real output. Since the publication of the original BEA/BLS integrated production account, real gross output for the air transportation industry declined by an average annual 0.3 percent while the BLS sectoral output measures rose 1.8 percent annually, on average, during the 1998–2010 period. Using the latest publications reveals a growing disparity, with the BEA real gross output measure declining by an average 1.8 percent annually and the BLS sectoral measure remaining at its original average annual rate of 1.8 percent during the same 1998–2010 period.
This study uses a measure computed with data from the U.S. Bureau of Transportation Statistics (BTS), of the Department of Transportation (DOT), to define real output for the air transportation industry. The measure is derived from revenue passenger miles and revenue ton-miles—two statistics that airlines are required to report to DOT. The approach is similar to that employed in computing the BLS measure. Using the detailed statistics available from the BTS reporting requirements, this real-output measure has the added benefit of being able to decompose output growth by carrier group and by aircraft type, enabling a deeper understanding of how the industry achieved its output growth. The measure will be incorporated into the integrated production account framework produced by BEA/BLS to compute the impact of the industry on the economy’s multifactor productivity growth.
There is a good body of work examining both labor productivity trends and multifactor productivity trends in air transportation covering many periods. Beyond the earlier mentioned official measures of productivity computed by the BLS Productivity Program, as well as measures compiled by the BEA/BLS integrated production account, a number of studies indicate that productivity growth in the air transportation industry has been substantial. One study by BLS economists John Duke and Victor Torres that encapsulated both periods with regulation and periods with deregulation in the industry found that multifactor productivity growth in air transportation was triple that of the U.S. business sector from 1972 to 2003.8 Duke and Torres outlined a number of factors, such as the emergence of both fly-by-wire technology and GPS technology, that have advanced productivity in the air transportation industry.
In another study, FAA economist Anthony Apostolides, focusing on the period from 1990 to 2001, a time when the air transportation industry was deregulated, measured multifactor productivity trends and found that the industry “contributed positively and substantially to increases in multifactor productivity in the U.S. private business sector and, hence, to the U.S. economy.” 9 Apostolides went on to discuss advances in maintenance technology, as well as the quality of inputs during the 1990–2001 period, as key developments that shaped the positive efficiency findings.
More recently, studies from the Master of Science in Transportation program at the Massachusetts Institute of Technology also have examined multifactor productivity growth in the air transportation industry. Robert Powell found that air transportation has experienced “tremendous productivity improvements since deregulation.”10 Looking at the low-cost carriers, Powell maintained that there were rapid total factor productivity gains in the early years of the first decade of the 2000s and that the legacy carriers followed suit by expanding those gains in the latter half of that decade. Then, in an examination of the air cargo industry, David Donatelli learned that multifactor productivity growth for the two largest air couriers, FedEx and United Parcel Service (UPS), coincided with the growth of air traffic in the early 1990s and on into the first decade of the 2000s.11 Still, FedEx and UPS showed the weakest productivity growth, while combination carriers’ productivity gains far exceeded those of the largest two cargo operators.
An earlier study by BLS economists Michael Cimini and Charles Muhl had outlined the labor struggles that took place from the early to mid-1990s as airlines were beginning to restructure labor contracts and labor unions were being forced to accept concessions in an effort to keep the airlines in business.12 Finally, an article by Bogdan Daraban discussed the more recent breakdown of the distinction between the low-cost air carriers and the traditional legacy carriers, with both types of carriers adopting each other’s input structures in order to achieve the most efficient mix of inputs.13
Despite being a relatively short timeframe in terms of productivity analysis, the period since deregulation is rich with insight into an industry that is quickly adapting to the competitive market with respect to labor contracts, fuel expenses, fare choices, and decisions relating to capacity, route selections, and outsourcing. Labor productivity is an especially relevant statistic to track over the years from the late 1990s to the first decade or so of the 2000s, a period when airlines rapidly adapted their labor expenses and labor input decisions to the emergence of the low-cost carrier model of operations.
What is clear from many of these and other productivity studies is that the air transportation industry underwent rapid productivity growth, typically faster than the nation’s productivity growth, and that the industry’s growth contributed positively to aggregate productivity growth. However, there remains a gap in quantifying exactly how much the air transportation industry contributed to the nation’s productivity growth.
This article attempts to fill the void in the current literature by using the BEA/BLS integrated production account framework, a framework based on the growth accounting principles first developed by Robert Solow and further refined by Dale Jorgenson, Zvi Griliches, Frank Gollop, and Barbara Fraumeni, as well as others. In what follows, BTS real-output measures are used to construct measures of multifactor productivity and labor productivity at the detailed industry level of the North American Industry Classification System (NAICS) in a context that is consistent with GDP, the principal indicator of economic health in the U.S. economy.14
The labor productivity index in this article is computed by dividing an index of gross output by the labor input index, which is a measure of hours worked by the various workers in the air transportation industry. In productivity analysis, sectoral output remains the preferred choice for measuring output; however, in the air transportation industry, the difference between gross output and sectoral output is likely not large by virtue of the way the airline reporting requirements are captured. An example of an intraindustry transfer would be an airline flying its own flight staff to another airport to staff a different aircraft. In the BEA/BLS integrated production account framework, revenue is a gross output concept, so, to be consistent with the other industries in the economy, a gross output concept is used in this work.
In what follows, labor productivity growth is expressed as output divided by labor input, inclusive of quality change; that is,
 (1)
(1)
where GO = gross output and L = labor input.
Multifactor productivity is defined as an index of real output divided by an index consisting of the following real combined inputs: capital (K), labor (L), energy (E), materials (M), and services (S). Multifactor productivity provides a more complete accounting of industry and productivity growth than does either labor productivity or any other single-factor productivity approach. Recently, BEA and BLS computed multifactor productivity statistics for the total economy, using an integrated production account framework for 63 NAICS industries in the U.S. economy.15
This study adopts the BEA/BLS integrated production account–based framework, which uses data consistent with U.S. national accounts on a NAICS basis to build economywide estimates.16 In that framework, multifactor productivity is computed as a residual; that is,
 (2)
(2)
where
GO = real gross output,
K = real capital services,
L = labor input,
E = real energy,
M = real materials,
S = real purchased services,
Wk = average two-period capital/output share,
WL = average two-period labor/output share,
WE = average two-period energy/output share,
WM = average two-period materials/output share, and
WS = average two-period purchased services/output share.
This model from the BEA/BLS provides an ideal platform from which to evaluate recent productivity trends in the air transportation industry precisely because it can quantify the impact that each industry and input has had on the aggregate economy’s multifactor productivity growth.17 This capability has thus far been missing from many of the air transportation studies conducted.
Aggregating economywide value-added output, industry-level gross output, and industry-level multifactor productivity through the use of Domar weights yields a set of multifactor productivity estimates for the total U.S. economy.18 Each industry’s contribution of capital input, labor input, and multifactor productivity to total GDP growth is the Domar-weighted contribution of that factor input, multiplied by the growth of the real factor input, so that
 (3)
(3)
and

where
capital contribution to total-economy value-added growth,
labor input contribution to total-economy value-added growth,
= real-capital input growth for industry i,
= labor input growth for industry i,
= multifactor productivity growth for industry i,
zk,I = (average two-period current-dollar capital compensation for industry i)/(total-economy current-dollar GDP),
zl,I = (average two-period current-dollar labor compensation for industry i)/(total-economy current-dollar GDP), and
zo,I = (average two-period current-dollar gross output of industry i)/(total-economy current-dollar GDP).
Using the foregoing Domar weights and growth expressions, and aggregating all industries in the economy, yields economywide factor contributions to GDP growth, from which industry contributions to national productivity growth and to national factor input growth can be easily determined.
The data sources for the study presented in this article are of two kinds: those related to the output produced and those having to do with the inputs from which the output is derived.
The analysis that follows adopts the gross output production account framework to measure airline industry output—a framework that is consistent with the BEA/BLS integrated production account methods of measuring gross output and that fits well with research showing the importance of intermediates in productivity analysis at the detailed industry level.19 This approach allows the results obtained from the most recent BEA/BLS integrated production account to be used to gauge the impact the air transportation industry has had on the economy. In addition, the approach makes available 62 other NAICS-based industries whose productivity may be compared with that of the air transportation industry.
However, because there is a meaningful discrepancy between the productivity measures in the BEA/BLS integrated production account and the official BLS measures of productivity stemming from real output measures, this article will use its own estimates of real gross output in place of the real-output measures found in the BEA/BLS integrated production account for the air transportation industry. These new estimates will be based on revenue passenger miles and revenue ton-miles, in accordance with practices and methods used in national accounts and by the BLS Productivity Program.20
Air transportation’s real industry output is defined as a Törnqvist aggregated measure of revenue passenger miles and revenue ton-miles. Average two-period revenue streams for both passenger and cargo operations are used to compute two-period average value shares. BTS Form 41, Schedule T-100, “U.S. Air Carrier Traffic and Capacity Data by Nonstop Segment,” reports revenue passenger miles for scheduled service of the large regional carriers, the national carriers, and the major carrier groups, and is used to generate real output. For cargo operations, BTS Form 41, Schedule P-1.2, "Statement of Operations," covers carriers reporting annual operating revenues of $20 million or more, excluding air courier companies. The data on these schedules are reported by carrier and by aircraft type, and allow for decomposing output growth. The real-output measure based on these schedules is used in both the labor productivity and multifactor productivity estimates presented in this article.
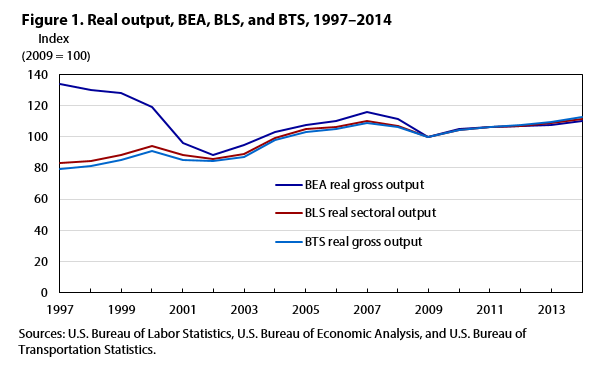
For air transportation, the real estimates of value added were recomputed from the estimates found in the BEA Industry Accounts, in order to keep the mathematical relationships among real value added, real intermediates, and real output consistent after replacing the BEA output with the BTS measure. For all industries other than air transportation, real output and real value added were taken directly from the BEA Industry Accounts. Figure 1 shows the real-output measures from BLS, BEA, and BTS; the three measures appear to track one another after 2003.
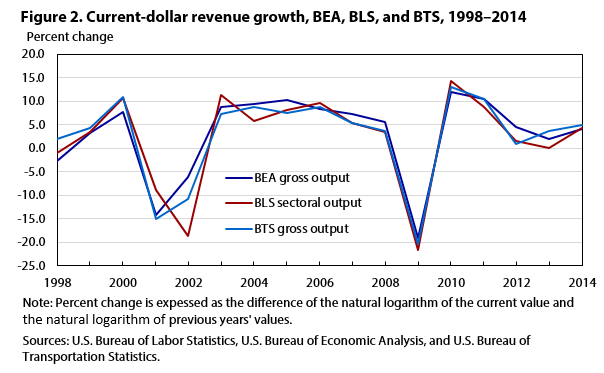
Current-dollar measures of air transportation gross output and value added are taken directly from the BEA Industry Accounts. One reason for keeping the current-dollar estimates of BEA gross output unchanged despite changing the real-output measures was that the BEA Industry Accounts measures appeared quite similar in their growth trend to the revenue estimates found in BTS Form 41, Schedule P-1.2. (See figure 2.)
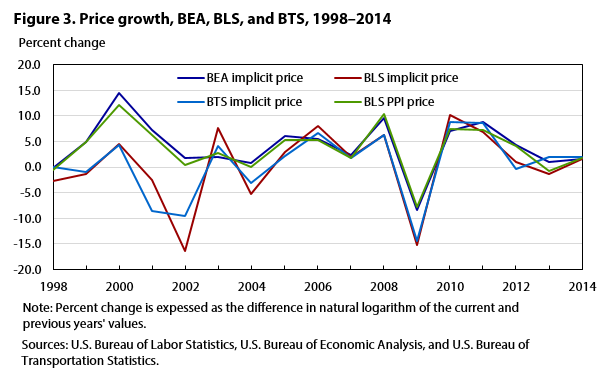
By definition, inclusion of the BTS real-output measure in the BEA/BLS integrated production account model’s current-dollar framework implicitly alters the gross output price associated with the airline industry. Given BEA input–output practices, this price change would in turn affect not only the value-added price in air transportation, but also the intermediate price in any industry consuming air transportation services.21 However, because the federal government was the only industry that used air transportation for more than 2 percent of its intermediate input expenses, the intermediate-price distortion would have a minimal impact on 62 of the 63 detailed industries examined. Thus, it would likely have no adverse effect on the overall results obtained. Indeed, a closer look at the prices involved reveals that price growth between BTS and BEA was similar after 2002, further limiting the impact on both the aforementioned 62 industries and the overall results from the model. (See figure 3.)
The current-dollar and real-input data used in this study are derived from the BEA Industry Accounts for the energy, materials, and service inputs. The current-dollar capital pieces are residuals of the value-added and labor compensation estimates. The real-capital input measure is used directly from the BEA/BLS integrated production account, pushed back 1 additional year by using the BLS Productivity Program’s real-capital measures of the economy by industry.22 The current-dollar labor compensation measures were obtained directly from the BEA/BLS integrated production account, moved back 1 additional year by using payroll-based worker labor compensation as an indicator of worker compensation for the missing year. The real-labor input measures were obtained from newly released BLS Productivity Program labor input measures, inclusive of labor quality.23
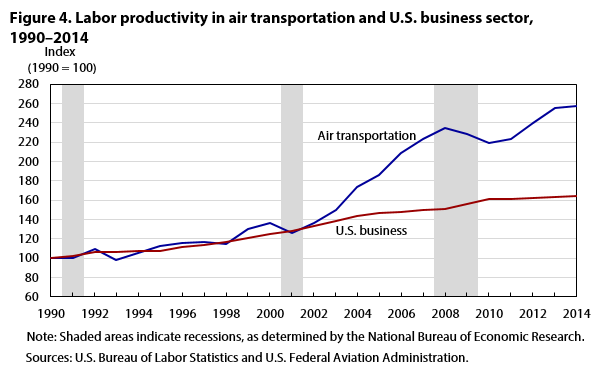
Labor productivity in air transportation grew at an average annual rate of 3.9 percent over the 1990–2014 period, nearly doubling the U.S. business sector's growth of 2.1 percent. (See figure 4.)24 Labor productivity in air transportation grew most notably from 2002 to 2007, a period during which it recorded an average annual rate of change of 9.8 percent, largely through output contributions from the lower cost carriers and labor cuts from the legacy carriers. (See table 1.)25
| Productivity measure and carrier group | 1990–2000 | 2000–02 | 2002–07 | 2007–09 | 2009–14 | 1990–2014 |
|---|---|---|---|---|---|---|
| Real gross output | 4.4 | -3.9 | 5.2 | -4.3 | 2.4 | 2.7 |
Legacy carriers | 3.5 | -4.3 | .8 | -4.6 | .6 | .8 |
Low-cost carriers | .9 | .4 | 4.3 | .3 | 1.9 | 1.9 |
| Labor hours | .8 | -4.2 | -4.8 | -6.5 | .0 | -1.5 |
| Labor input | 1.3 | -4.1 | -4.6 | -5.6 | .0 | -1.2 |
Legacy carriers | 1.1 | -4.8 | -5.5 | -5.5 | .0 | -1.9 |
Low-cost carriers | .2 | .6 | .9 | .0 | .0 | .6 |
| Air transportation | 3.1 | .2 | 9.8 | 1.2 | 2.4 | 3.9 |
| U.S. business | 2.2 | 3.5 | 2.3 | 2.0 | 1.1 | 2.1 |
Note: The legacy group comprises American Airlines, US Airways, America West, Trans World Airlines (TWA), Delta, Continental, United, Northwest, and Hawaiian (some of which are no longer operating). The low-cost group includes AirTran, Southwest Airlines, Alaska, JetBlue, Spirit, Allegiant, and Frontier. Contributions do not add up directly but were forced to totals for the industry. Labor input contributions were distributed by using employment shares controlled to total labor input change. Sources: U.S. Bureau of Labor Statistics, U.S. Bureau of Transportation Statistics, and U.S. Federal Aviation Administration. | ||||||
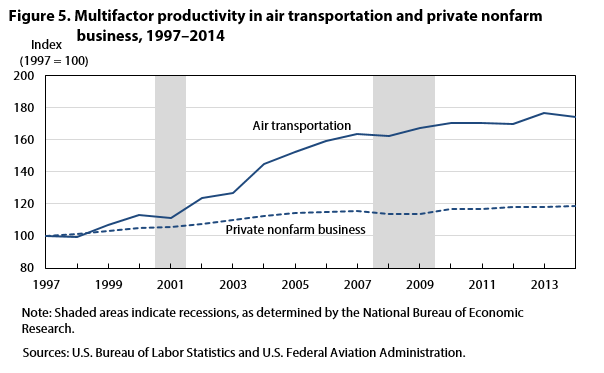
From 1997 to 2014, multifactor productivity’s average annual growth rate of 3.3 percent in air transportation outpaced that of the private nonfarm business sector (1.0 percent) by the substantial margin of 2.3 percent and aided in the nation’s productivity growth. (Figure 5 shows these two multifactor productivity trends.) Air transportation’s multifactor productivity growth over the 1997–2014 period was achieved through moderate output growth (2.1 percent, averaged annually) and falling combined inputs (–1.2 percent, also averaged annually). (See table 2.)
| Productivity measure and carrier group | 1997–2000 | 2000–02 | 2002–07 | 2007–09 | 2009–14 | 1997–2014 |
|---|---|---|---|---|---|---|
| Air transportation | 4.2 | 4.3 | 5.6 | 1.1 | 0.8 | 3.3 |
| Output | 4.6 | -3.9 | 5.2 | -4.3 | 2.4 | 2.1 |
Legacy carriers | 3.2 | -4.3 | .8 | -4.6 | .6 | -2.5 |
Low-cost carriers | 1.4 | .4 | 4.3 | .3 | 1.9 | 4.6 |
| Combined inputs | .4 | -8.2 | -.5 | -5.4 | 1.6 | -1.2 |
| U.S. private nonfarm business multifactor productivity | 1.6 | 1.3 | 1.4 | -.8 | .9 | 1.0 |
Note: Indented rows sum to nonindented row directly above. Sources: U.S. Bureau of Labor Statistics, U.S. Bureau of Transportation Statistics, and U.S. Federal Aviation Administration. | ||||||
From 1990 to 2000, labor productivity in air transportation grew at an average annual rate of 3.1 percent, outpacing the U.S. business sector’s labor productivity growth of 2.2 percent per year.
Real output, measured as an aggregation of revenue passenger miles and revenue ton-miles, grew at an average annual rate of 4.4 percent during the 1990–2000 period, while labor input grew at a more moderate 1.3 percent, averaged annually. The growth in output was dominated by the legacy carriers’ passenger revenue growth, which accounted for close to 75 percent of the output growth. At the same time, the legacy carriers accounted for roughly 85 percent of the labor input growth during the 1990–2000 period. (See table 1.) However, from 1997 through 2000, the industry’s growth began to change: labor input declined by 0.7 percent, averaged annually, beginning a period of decline that would last a decade.
During the 1997–2000 timeframe, in which the drivers of air transportation industry growth began to change, multifactor productivity growth in air transportation, at 4.2 percent, averaged annually, outpaced the U.S. private nonfarm business sector average annual growth rate of 1.6 percent. (See table 2.) Overall, the air transportation industry experienced a deepening of information technology capital, along with a sharp reduction in services and increases in real-energy consumption. Combined inputs—the aggregation of all real inputs to production—rose slightly (0.4 percent, averaged annually; see table 3) between 1997 and 2000, while output rose an annual average 4.6 percent in the late 1990s.
| Input measure and carrier group | 1997–2000 | 2000–02 | 2002–07 | 2007–09 | 2009–14 | 1997–2014 |
|---|---|---|---|---|---|---|
| Combined inputs | 0.4 | -8.2 | -0.5 | -5.4 | 1.6 | -1.2 |
Capital | 1.6 | .4 | -.4 | .0 | -.1 | .2 |
Labor | -.3 | -1.7 | -1.4 | -1.4 | .0 | -.8 |
Legacy carriers | -.2 | -1.9 | -1.7 | -1.4 | .0 | -1.2 |
Low-cost carriers | .0 | .3 | .3 | .0 | .0 | .4 |
Intermediate purchases | -.9 | -6.9 | 1.3 | -4.1 | 1.6 | -.6 |
Energy | .5 | -2.8 | .4 | -3.0 | 1.3 | -.1 |
Materials | -.2 | -.1 | .1 | -.1 | .0 | .0 |
Services | -1.2 | -4.1 | .8 | -.9 | .3 | -.5 |
Note: Indented rows sum to nonindented row directly above. Sources: U.S. Bureau of Labor Statistics, U.S. Bureau of Transportation Statistics, U.S. Bureau of Economic Analysis, and Federal Aviation Administration. | ||||||
The slight rise in combined inputs was a result of differential growth in inputs. Real purchased services declined an average annual 3.2 percent over the 1997–2000 period, driving the decline in the air transportation industry’s real intermediate purchases. However, growth in capital input offset the decline in real purchased services, owing in large part to the carriers’ investment in Internet-related selling of airline tickets at reduced commission rates—an investment that began the lowering of service expenses.
American Airlines and United entered the Internet selling business through online companies in 1998 and quickly accounted for major ticket sales that saved the carriers millions of dollars through reduced passenger commissions. In 1998, some airlines began paying a flat $10 commission on tickets booked online and ceased payment as a percentage of the ticket fare charged. The move saved the airlines money and drove down real expenditures of purchased services throughout the industry. Other airlines chose to cut commissions paid to online ticket agents from 8 percent to 4 percent during the 1997–2000 period.26 As a result, passenger commissions fell by 34.2 percent, illustrating the great impact that direct Internet sales and passenger-enabled purchasing had on reducing commissions during the late 1990s.27
There was also a rise in real-energy expenditures in the air transportation industry during the late 1990s. Real energy rose an average annual 5.5 percent, loosely matching the average annual rise in real output of 4.7 percent, as carriers grew their revenue passenger miles and revenue ton-miles flown. The number of departures rose 2.5 percent, averaged annually, over the 1997–2000 timeframe. The increase added to fuel requirements for the carriers. The industry was able to limit its aggregate combined input to an increase of just 0.4 percent, averaged annually, by cutting both purchased service requirements and labor. The cutbacks yielded a robust average annual 4.3-percent multifactor productivity growth in the late 1990s.
From 2000 to 2002, a period that included the recession of March–November 2001, labor productivity in air transportation rose slightly, at an average annual rate of 0.2 percent. Over the same timeframe, labor input declined sharply, by an average annual 4.1 percent, and real output fell at a lesser average annual rate of 3.9 percent. American Airlines and America West were the only two legacy carriers to report positive (though small) revenue passenger miles during the period; the other legacy carriers posted declining revenue passenger miles. Employment in legacy carriers was especially hard hit during this recession, declining at an average annual rate of 4.2 percent and accounting for the entire labor input decline in the industry. The low-cost carriers saw their employment increase as consumers switched to lower cost travel options and revenue passenger miles rose. However, the legacy carriers’ employment decline of more than 50,000 workers during the 2000–02 period far exceeded the number of workers added by the low-cost carriers, resulting in an average annual 4.2-percent decline in air transportation’s hours worked and a 4.1-percent drop in labor input.
From 2000 to 2002, multifactor productivity in the air transportation industry continued its robust growth, increasing 4.3 percent, even in a recession and as output fell by an average annual 3.9 percent. What is more, the combined inputs to production declined by over double that rate, falling by 8.2 percent, averaged annually. The declines in the factors of production to the industry were led by the continuing drop in services and labor input, along with a downturn in real-energy expenditures.
Real services declined by 10.8 percent over the 2000–02 timeframe as commissions on passenger airfare continued to decline substantially because of the drop in the number of passengers as well as the continued rise in Internet ticket purchasing. Commissions on passenger tickets fell by 39 percent, contributing the most to the average annual 8.2-percent downturn in combined inputs experienced from 2000 to 2002.28
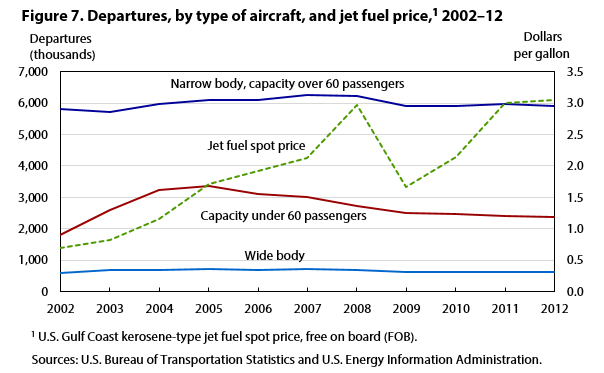
Real-energy expenses declined by 18.1 percent, averaged annually, in 2000–02 as carriers quickly retired fuel-inefficient aircraft and switched to fuel-efficient aircraft as the price of jet fuel began a steep ascent in 2000. For instance, carriers rapidly switched to the Boeing 737, which required only two pilots to fly it instead of the three-pilot crew that flew the Boeing 727, a more costly three-engine aircraft.29 During 2000–02, departures (i.e., takeoffs) of the aging, less fuel-efficient Boeing 727 fleet at the various airlines fell by more than 60 percent, a rate 4 times faster than that of the previous 2 years, as carriers looked for ways to reduce their fuel costs.30
In addition to pulling back fuel-inefficient aircraft, carriers reduced departures in response to the declining demand. Departures of narrow-bodied aircraft fell by 7.2 percent, averaged annually over the 2-year period from 2000 to 2002, also contributing to the aforementioned decline in real-energy expenses.
The period from 2002 to 2007 saw the largest labor productivity gains in the air transportation industry over the 1990–2014 timeframe examined in this article. The increase was an average annual 9.8 percent, driven by strong output growth of 5.2 percent and falling labor input, at a rate of 4.8 percent. Labor input among legacy carriers fell as the carriers shifted their production model to meet the low-cost carrier competition’s business model.
Roughly three-quarters of the strong output gains in the 2002–07 period were attained through the use of narrow-bodied, single-aisle aircraft accommodating at least 60 passengers, and roughly 80 percent of the growth in output was attributable to the low-cost carriers. In particular, Southwest Airlines, which flies only one type of aircraft, a Boeing 737 single-aisle airplane, recorded an average annual 9.3-percent increase in revenue passenger miles, a percentage that led the low-cost carriers’ contributions to the overall 5.2-percent output growth.31
Declines in airline transportation employment during this period, led primarily by the legacy carriers, contributed to the sharp average annual decline of 4.8 percent in labor input. Throughout the mid-2000s, several airlines declared bankruptcy in order to restructure their debt and renegotiate labor contracts with unions. US Airways, United, Northwest, and Delta all initiated bankruptcy proceedings during the 2002–05 period and immediately sought ways to reduce their labor costs. The establishment of low-cost carriers with reduced labor costs forced the legacy air carriers to find ways to match the low-cost carriers’ savings, although the heavily unionized industry found it difficult to do so, and many of the legacy carriers saw bankruptcy as a necessary step toward restructuring.
In addition, the major carriers’ labor expenses forced those airlines to reduce costs and improve productivity in the early 2000s. Also, labor unions made major concessions. For example, in 2003, the pilots, mechanics, ground crew, and flight attendants of American Airlines gave back nearly $2 billion in wages to the carrier in an attempt to help avoid bankruptcy. In addition to these wage concessions from the various labor unions were productivity concessions on the part of American Airlines workers that would reduce the carrier’s workforce by 2,000 to 3,000 workers.32 United Airlines found itself in a similar situation when it attempted to renegotiate its labor contracts after declaring bankruptcy in 2002. At the same time, Delta was seeking ways out of its expensive labor contracts in order to avoid bankruptcy by the middle of the first decade of the 2000s.33 In 2005, to boost productivity, Delta made major scheduling changes at its Atlanta hub. Such changes had been initiated earlier by American Airlines.34 The objective was to spread arrivals and departures more evenly throughout the day, limit congestion, and increase productivity. In another move, Frontier pilots agreed in 2004 to shift from a salaried pay system to an hourly pay system as a way for the company to increase pilots’ productivity by incentivizing them to fly more.
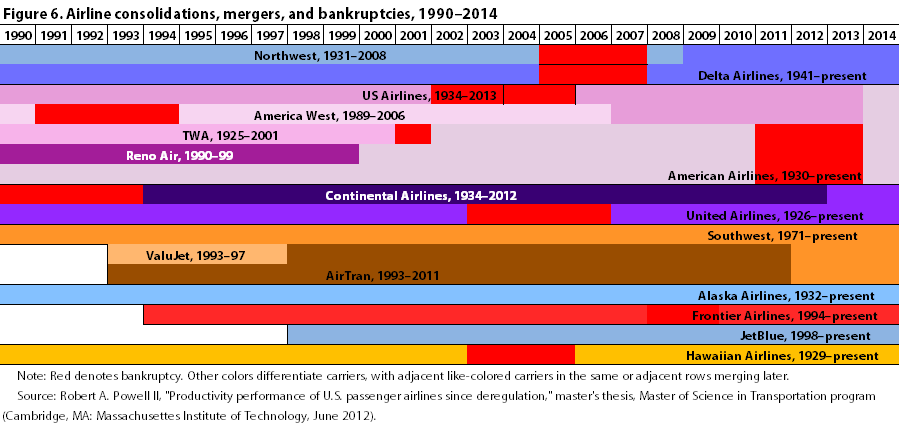
In addition to seeking cost savings through bankruptcy and concessions, airlines continued to merge and consolidate. In fact, all of the major legacy U.S. carriers have been through bankruptcy proceedings within the last 25 years, and a majority of them merged with another major airline along the way. Figure 6 depicts some of the consolidations in the commercial carriers, with associated bankruptcy dates, that have taken place since 1990. As shown in the figure, there were 15 major airlines in 1998, but by 2014 only 8 of them existed. TWA and American were early in the most recent wave of mergers, merging operations by the end of 2001. In 2006, US Airways and America West merged, after America West had been in operation for 23 years starting in 1983. Then, in 2008, Delta and Northwest continued the trend, and United and Continental soon followed them in 2010. Next, in 2011, Southwest Airlines announced that it would merge with Air Tran, and it finally completed the merger in December 2014. Finally, in 2013, American Airlines announced that it would merge with US Airways, and it did so in 2015, keeping American’s name. Through mergers such as these, air carriers were able to reduce redundant routes and equipment, in addition to downsizing redundant staff, sometimes through retirement buyouts. In the United–Continental merger, for example, about 2,900 union workers accepted early retirement buyouts to avoid furloughs or forced layoffs.35
At the end of 2009, United had cut employment by more than half of what it was just 10 years earlier; the airline was left with just over 46,000 workers.36 Prior to the TWA–American Airlines merger, combined employment in the carriers in 1999 was 118,000, but that number shrank to 46,700 by the end of 2009.37 In sum, the legacy carriers were declaring bankruptcy, shrinking redundant staff, and achieving productivity concessions at a rapid pace during the 2002–07 period.
Airlines also found ways to merge their operations other than through formal financial mergers. Revenue-expanding tools, such as alliances, code shares, and partnerships, were among the methods used. A code-share flight allows, for instance, Airline A to market a flight flown by Airline B under Airline A’s flight number; in that way, Airline A can expand its markets. In addition to improving the passenger experience through checking baggage only once, at the start of the trip, code shares and partnerships afford both airlines an opportunity to save money while boosting demand.
An example from 1994 illustrates the cost savings to airlines. Delta cut 4 trans-Atlantic routes and removed 13 Airbus A310 aircraft from its fleet, replacing those services with code-share flights partnered with foreign airlines.38 By entering into code-share operations with other airlines, a carrier could expand both its services offered and its revenue while working at the same time with its code-share partner to reduce costs. In 2000, there were 1.1 million code-share flights originating from the United States; by 2006, that number had increased to 4.3 million.39
The International Air Transport Association (IATA) reported that feeder routes and services delivering connecting traffic could increase the traffic density on a two-city route, allowing airlines to operate larger, more efficient aircraft and to spread costs over a greater number of passengers.40 The enhancement of the partnered network in an alliance, the airlines contend, can improve the traffic density of a given spoke-to-hub route by increasing demand for travel to new spokes served by the alliance partner—demand that would not have been reached in the absence of the alliance. Tapping into this otherwise unreached demand greatly expanded the number of revenue passenger miles traversed during the 2002–07 period, when code-share flights enabled rapid output growth.
In addition to the measures just outlined, changes aimed at reducing labor further were made inside the terminal. Self-service kiosks expanded rapidly during 2002–07, with the result that a ticket agent who formerly could process only about 21 passengers per hour could now process as many as 55 passengers per hour, taking into account the passengers who checked in on their own. In 2003, the NCR Corporation operated about 2,000 kiosks in airports across North America. By 2009, that number was around 8,400, as the trend toward “enabling” check-in gained in popularity with tech-savvy fliers.41 In 2007, IATA claimed that, by utilizing an automated check-in system, an airline could save $2.50 per check-in and upwards of $20 million a year in labor-related expenses.42
During the dynamic 2002–07 period, multifactor productivity in air transportation grew at a robust 5.6-percent average annual rate, quadruple the U.S. private nonfarm business sector’s 1.4-percent rate. Multifactor productivity in air transportation accounted for more than 50 percent of the rapid labor productivity growth over that timeframe. At the same time, the combined inputs to production fell by a small amount, with declines in labor and capital slightly outpacing increases in purchased services and energy.
During this period, the sharp average annual falloff of 4.6 percent in labor input was met with a 2.3-percent rise in real purchased services. The decline in labor input was led by a drop in the number of airline maintenance workers, who saw their employment fall at an average annual rate of 8.0 percent.43 Air carriers were beginning to outsource maintenance and heavy repair, not only to other companies, but also to other countries, reducing their labor expenses but increasing their service expenses. According to one report, outsourcing of repairs and servicing of an aircraft’s body, wings, and tail among the largest carriers more than doubled from 2003 to 2007. As of 2007, outsourced labor maintenance represented about 70 percent of the heavy-airframe repairs performed in the industry, with more than a quarter of that maintenance performed at foreign repair facilities.44
Real-energy expenditures were increasing from 2002 to 2007, largely because of the change in the nature of the fleet of aircraft servicing the traveling public. Departures of the small, less fuel-efficient regional jets gained throughout the mid-2000s as air carriers flew more frequently and to smaller regional destinations. Although this change increased access to larger and larger pools of revenue, jet fuel prices rose toward the latter part of the period and on into the summer of 2008, when they peaked. (See figure 7.) The rising fuel prices stemmed the growth of the regional jet departures.
Airlines began to adapt and reconsider ways to save money on factors of production toward the latter half of the 2002–07 period. American Airlines created a fuel-smart team in 2005 as the price of fuel more than doubled from what it was in 2002. The team found ways to cut weight from the aircraft to save on fuel expenses by getting rid of electrical outlets in the lavatories and removing the phones and wiring from the backs of the seats. By removing trash bins, flight kits, supplies, and seats, JetBlue reduced the weight of its aircraft by as much as 1,000 pounds. At US Airways, glass drinking glasses were replaced with less heavy plastic glasses and meal carts were replaced with carts that were 12 pounds lighter, in an effort to reduce the weight of the aircraft.45
Some carriers began adding winglets to their planes to save on fuel expenses. These tiny angled tips on the edge of the wing can save between 4 percent and 6 percent of fuel burn during flight operations, as well as improving takeoff performance. Aloha Airlines was an early adopter of winglets and reported that it was obtaining roughly a 5-percent savings in fuel costs on its 1,800-mile stage lengths.46 In June 2003, Southwest Airlines announced its intention to outfit its entire fleet with blended winglets over a 2-year period. These wingtip modifications increased fuel efficiency, as well as reducing noise and environmental pollutants. Despite the airlines’ efforts, real-energy inputs expanded during the 2002–07 period as fuel prices rose and outpaced the industry’s countermeasures.
The Great Recession, from December 2007 to June 2009, saw the rapidly restructuring airline industry continuing to cut labor input. Labor hours fell by an average annual 6.5 percent, and, similarly, labor compensation fell by a 6.2-percent average annual rate, during this period. Led by declines in revenue passenger miles sustained by the legacy carriers, real output dropped by 4.3 percent during the recession. The 5.6-percent average annual falloff in labor input during the recessionary period was attributable partly to job losses among cargo personnel, whose employment with one cargo operator fell by more than 70 percent. These cargo employment declines were indicative of stalled commerce during the Great Recession, reflecting an average drop of 9.2 percent in exports and 2.4 percent in imports over the 2007–09 timespan.47
The decline in employment in cargo operations contributed to a rise in labor productivity of 1.2 percent during this turbulent period, which saw fuel prices surge in 2008, further slowing economic growth in the energy-dependent industries involved in trade. Despite the turbulence, low-cost carriers managed to post increasing revenue passenger miles: 0.3 percent, averaged annually, over the period 2007–09.
Multifactor productivity grew 1.1 percent during the 2007–09 period, with real output declining 4.3 percent and the industry’s use of inputs falling more sharply, at a 5.4-percent average annual rate. Multifactor productivity accounted for more than 85 percent of labor productivity growth during this timeframe.
The decline in inputs was driven by a sharp falloff in real-energy consumption as energy-saving initiatives and fleet choices made in the mid-2000s began to have an impact. Real energy fell 12.4 percent over the period, reflecting an average annual decline of 11.9 percent in departures, as carriers adapted quickly to the changing times and cut unprofitable routes. Fuel prices, already having increased steadily in the early years of the first decade of the 21st century, peaked in July 2008. The airlines struggled to adapt their production model so as to gain every advantage they could.
American Airlines and Southwest Airlines began power washing their jets engines regularly, to reduce the drag from dirt and thus increase the fuel efficiency of their aircraft. By 2008, as jet fuel prices reached a peak, Northwest began keeping its less fuel-efficient DC-9 fleet parked in favor of flying the Airbus 319, which was 27 percent more fuel efficient.48 Nor was Northwest alone, as United shelved six of its fuel-expensive four-engine Boeing 747s. The assets that caused the rise in capital input were land stocks and material inventories, which the carriers turned to as they sought ways to house their less-than-efficient aircraft during the 2007–09 period.
Real food expenditures by airlines declined by 12 percent, averaged annually, during the 2007–09 recession, contributing to the 13.8-percent decline in real material inputs observed over the period.
Aviation experts have termed the period surrounding 2008 the period of “rationalization” for the airline industry. During this time, the airlines instituted an active reduction in their available seating capacity.49 It was no longer profitable to operate the smaller, less fuel-efficient regional aircraft with the high fuel prices that existed, so departures from small regional airports were scaled back. Those airports had been instrumental in building the growth observed in the number of less fuel-efficient aircraft in the 2002–07 period.
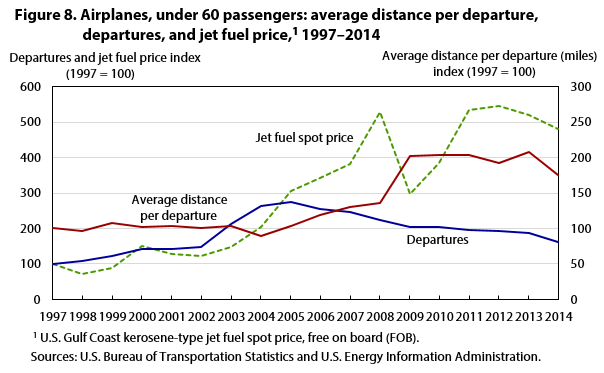
By the time fuel prices reached record highs in 2008, the decline of the regional jets was well under way, because of the steady ascent of jet fuel prices. As the price of fuel fell from the 2008 peak, departures of these less expensive regional aircraft did not (and still have not) returned to the prominence they held in the middle of the first decade of the 21st century. The stagnation signifies a shift in production by the air carriers, which appear to be seeking more stable expenses in their production model. Departures of small regional aircraft fell by nearly 30 percent, averaged annually, during the Great Recession and are roughly where they were 15 years ago. (See figure 8.)
In addition to the pulling back of the more fuel-inefficient aircraft, there has been a lengthening of the average distance traveled per departure, reducing per-departure costs. Most notably, this statistic increased in the smaller aircraft after 2008, the year that fuel prices spiked, but it is also seen in the wide-body aircraft. (See figure 9.) As the average annual rate of increase in fuel prices reached 15 percent between 2002 and 2010, the average distance flown by the smaller, under-60-passenger aircraft climbed nearly 9 percent, averaged annually, over the same period. Similarly, the average distance traveled per departure by narrow-bodied aircraft increased 1.3 percent, averaged annually, over the period. Even as the number of departures diminished for the smaller, under-60-passenger aircraft, the average distance flown per departure continued to increase in order to meet demand. In 2008, when prices reached a peak, air carriers made decisions to shift from meeting demand by using departure frequency and small regional airports to selectively choosing longer distances to fly while still meeting the needs of their customers.
After the Great Recession, labor productivity growth softened considerably from the robust growth experienced in 2002–07. The post–Great Recession labor productivity growth rate of 2.4 percent, averaged annually, was achieved through steady, but reduced, average annual output growth of 2.4 percent and stagnant labor input. Gains in revenue passenger miles came mostly from the low-cost carriers, which accounted for about three-quarters of the softened growth. The deceleration of output during the recovery from the Great Recession was the main contributor to the slower growth in both labor and multifactor productivity relative to the earlier recovery periods: average annual output grew 2.4 percent compared with growth of 5.2 percent after the previous recovery. In 2000–07, the growth of revenue passenger miles from under-60-passenger aircraft was responsible for a substantial share of the total 15-percent growth observed during that period. By contrast, revenue passenger miles among these smaller carriers actually declined in the 2009–14 period, despite overall growth in revenue passenger miles. The chief reason for the decline was that increasingly volatile fuel expenses made the smaller regional aircraft less profitable. Another factor was the difficulty the airlines had staffing pilots in the face of persistent flight restrictions and pay gaps.
Labor input declines since the Great Recession have been small and uneven. In February 2012, American Airlines announced that it was cutting 13,000 jobs—roughly 15 percent of its workforce—in a move to save on aircraft maintenance expenses.50 Then, in April of that year, the same carrier announced that it was laying off 1,200 workers at a reservation center in the U.S. southwest, in addition to outsourcing the jobs of domestic cargo-handling agents at seven U.S. airports. In 2014, United replaced 650 workers at Denver International Airport with outsourced contractors. Further, the airline announced plans to examine 28 other airports in the hopes of obtaining similar cost-saving measures.51 Today, the labor cuts adopted by the legacy carriers in the mid-2000s continue, while some of the labor input gains achieved by the low-cost carriers have dwindled as their market share has grown.
Multifactor productivity rose 0.8 percent, averaged annually, during the 2009–14 period, accounting for roughly 35 percent of labor productivity growth over that timeframe. The industry’s usage of inputs from 2009 to 2014 rose 1.6 percent, averaged annually, with more than 80 percent of the growth resulting from the 5.1-percent average annual rise in real-energy expenses. The latter rise reflected an average annual 2.9-percent increase in departures. The growth in labor, capital, and materials accounted for none of the combined input growth; instead, energy and services accounted for the entirety of the 1.6-percent rise in combined inputs—a rise that offset the 2.4-percent output growth and resulted in the small average annual 0.8-percent increase in multifactor productivity.
After 2009, the airline industry began a phase of operations commonly referred to in the industry as “capacity discipline.” This new paradigm meant that carriers would add seating capacity sparingly and only if there was proven demand for it. This tempered, destination-driven output resulted in lower growth in revenue passenger miles than that previously experienced, and its mixed results can be seen in carrier capacity statistics: Delta raised its capacity by 1 percent during 2009–13, while United lowered its flying capacity from 2011 to 2013 and American Airlines held its seating capacity steady.52
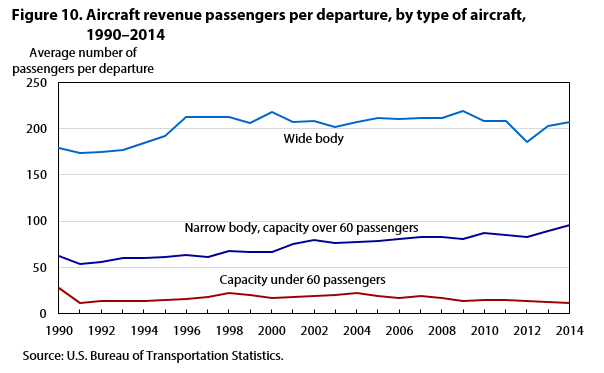
One factor leading to the overall rise in productivity since 1990 has been the trend by carriers to increase both yield and load factor. An airline’s yield is a measure of the average fare paid by all passengers per mile flown; the load factor represents the amount of output that is sold or consumed—a quantity commonly measured as the number of passengers divided by the number of available seats.53 Throughout the period examined in this article, carriers have been raising the average number of passengers carried per departure, packing more revenue passenger miles and revenue into the same plane to offset per-departure costs. The average number of revenue passengers per departure has been rising steadily for both wide-bodied and narrow-bodied aircraft. (See figure 10.) This trend is a reflection of the airlines filling more seats on existing aircraft, as well as an “up-gauging” of the fleet of aircraft used.54
As the price of fuel came down from the peak reached in July 2008 and fell to levels not seen since 2005, airlines began to worry less about saving fuel and became more focused on schedules. As a result, over the 2009–14 period real-energy consumption increased at an average annual rate of 5.1 percent, exceeding the rise in revenue passenger miles, which climbed 2.1 percent over the same period. In 2012, Delta took the unprecedented step of acquiring an oil refinery as a way to stabilize jet fuel prices and take some of the volatility out of that increasingly unpredictable essential component of production. In so doing, Delta hoped to gain back its close-to-$250 million investment in acquiring and upgrading the petroleum plant by saving an estimated $300 million annually.55
Growth in the longer term can be summarized by showing that the output growth of 2.7 percent from 1990 to 2014 was achieved by flying various aircraft increasingly filled with passengers who have been flying longer distances more recently. Just under 70 percent of the long-term output growth that took place during that period—in particular, gains registered in the midperiod from 2002 to 2007 (see table 3)—was achieved by low-cost carriers. Bringing about the 2.7-percent output growth seen over the 1990–2014 timespan were robust growth periods that more than matched strong recessionary periods.
The industry’s longer term average annual 1.2-percent labor decline was attained through large labor cuts in the legacy carriers throughout the first decade and a half of the 2000s. Low-cost carriers somewhat offset the longer term labor decline through sustained employment gains, keeping pace with the rising revenue passenger miles despite the recessionary periods.
The decline in real services that was driven by airlines’ direct Internet ticket sales to passengers resulted in a restructuring of the cost requirements of airlines in a meaningful way in the late 1990s and early 2000s. Somewhat offsetting that decline were rises in maintenance service contracts during the 2002–07 period. The drop in factor costs associated with the Internet revolution made a substantial contribution to the long-term multifactor productivity growth experienced by the airline industry over the period 1997–2014.
Despite large swings in energy costs and energy prices during the period examined, the time from 1997 to 2014 showed no growth (and, indeed, a slight decline) from the energy factor input: –0.1 percent, averaged annually, as carriers made decisions about their fleets and implemented changes to the frequencies of their flights and distances of their routes in order to counteract the rising tide of petroleum costs. In addition, they adopted fuel-saving strategies that enabled them to expand or maintain their routes through often unique and creative ways, such as code-share agreements.
Over the longer term, hours worked by air transportation employees in 2014 declined by 31 percent, compared with hours worked in 1990; however, real output grew by 92 percent during that time, fueling the rapid labor productivity growth observed. According to BLS, employment in the air transportation industry declined by 15 percent between 1990 and 2014.56
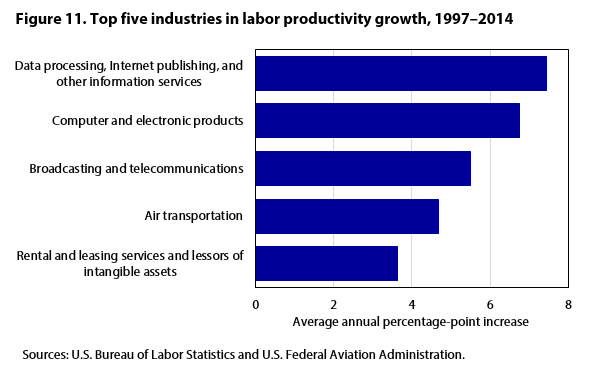
Compared with all other industries in the economy, air transportation emerges as a key driver of the nation’s labor productivity growth. When data on the entire economy can be used as a basis for comparison, air transportation ranks as the fourth-highest industry in labor productivity growth among 63 in the economy over the subperiod 1997–2014. (See figure 11.) The average annual rate of change of labor productivity during the subperiod was 4.7 percent, even faster than the 3.9 percent observed during the entire 1990–2014 period examined.
Although the air transportation industry directly accounted for roughly 1.3 percent of the nation’s real GDP growth from 1997 to 2014, it accounted for 7.0 percent of the nation’s multifactor productivity growth. (See table 4.) Using Domar weights to compute industry contributions to aggregate growth reveals that air transportation was the ninth-leading contributor to the nation’s multifactor productivity growth over the period examined. Also, the industry exhibited the second-highest multifactor productivity growth among the 63 industries studied. (See table 5.)
| Industry | Percent contribution |
|---|---|
| Computer and electronic products | 0.213 |
| Real estate | .061 |
| Broadcasting and telecommunications | .049 |
| Wholesale trade | .048 |
| Administrative and support services | .039 |
| Oil and gas extraction | .038 |
| Motor vehicles, bodies and trailers, and parts | .037 |
| Retail trade | .034 |
| Air transportation | .033 |
| Farms | .028 |
| Computer systems design and related services | .027 |
| Publishing industries, except Internet (includes software publishers) | .022 |
| Securities, commodity contracts, and investments | .017 |
| Motion picture and sound recording industries | .014 |
| Federal Reserve banks, credit intermediation, and related activities | .014 |
| Funds, trusts, and other financial vehicles | .013 |
| Management of companies and enterprises | .012 |
| Printing and related support activities | .011 |
| Primary metals | .011 |
| Insurance carriers and related activities | .009 |
| Machinery | .008 |
| Miscellaneous manufacturing | .007 |
| Other transportation equipment | .007 |
| Warehousing and storage | .006 |
| Food services and drinking places | .005 |
| Water transportation | .005 |
| Data processing, Internet publishing, and other information services | .005 |
| Support activities for mining | .005 |
| Pipeline transportation | .004 |
| Forestry, fishing, and related activities | .004 |
| Plastics and rubber products | .004 |
| Rail transportation | .004 |
| Performing arts, spectator sports, museums, and related activities | .004 |
| Social assistance | .004 |
| Electrical equipment, appliances, and components | .003 |
| Ambulatory health care services | .003 |
| Wood products | .003 |
| Other transportation and support activities | .002 |
| Textile mills and textile product mills | .002 |
| Petroleum and coal products | .001 |
| Apparel and leather and allied products | .000 |
| Mining, except oil and gas | -.001 |
| Accommodation | -.001 |
| Waste management and remediation services | -.001 |
| Furniture and related products | -.001 |
| Transit and ground passenger transportation | -.001 |
| Amusements, gambling, and recreation industries | -.002 |
| Nonmetallic mineral products | -.002 |
| Truck transportation | -.004 |
| Federal government | -.004 |
| Fabricated metal products | -.004 |
| Paper products | -.005 |
| Food and beverage and tobacco products | -.006 |
| Hospitals and nursing and residential care facilities | -.013 |
| Utilities | -.015 |
| Miscellaneous professional, scientific, and technical services | -.018 |
| State and local government | -.027 |
| Legal services | -.028 |
| Chemical products | -.028 |
| Other services, except government | -.031 |
| Rental and leasing services and lessors of intangible assets | -.035 |
| Educational services | -.044 |
| Construction | -.078 |
| Sources: Federal Aviation Administration, Bureau of Economic Analysis. | |
| Industry | Percent growth |
|---|---|
| Computer and electronic products | 6.1 |
| Air transportation | 3.3 |
| Support activities for mining | 2.5 |
| Funds, trusts, and other financial vehicles | 2.0 |
| Pipeline transportation | 1.9 |
| Motion picture and sound recording industries | 1.6 |
| Computer systems design and related services | 1.6 |
| Water transportation | 1.6 |
| Oil and gas extraction | 1.4 |
| Farms | 1.4 |
| Printing and related support activities | 1.4 |
| Warehousing and storage | 1.4 |
| Publishing industries, except Internet (includes software publishers) | 1.1 |
| Broadcasting and telecommunications | 1.1 |
| Forestry, fishing, and related activities | 1.1 |
| Administrative and support services | 1.0 |
| Motor vehicles, bodies and trailers, and parts | 1.0 |
| Rail transportation | .9 |
| Primary metals | .7 |
| Miscellaneous manufacturing | .7 |
| Wholesale trade | .6 |
| Securities, commodity contracts, and investments | .6 |
| Performing arts, spectator sports, museums, and related activities | .5 |
| Petroleum and coal products | .5 |
| Management of companies and enterprises | .5 |
| Other transportation equipment | .5 |
| Data processing, Internet publishing, and other information services | .4 |
| Social assistance | .4 |
| Textile mills and textile product mills | .4 |
| Electrical equipment, appliances, and components | .4 |
| Machinery | .4 |
| Real estate | .4 |
| Wood products | .4 |
| Retail trade | .3 |
| Other transportation and support activities | .3 |
| Plastics and rubber products | .3 |
| Federal Reserve banks, credit intermediation, and related activities | .2 |
| Insurance carriers and related activities | .2 |
| Food services and drinking places | .1 |
| Apparel and leather and allied products | .1 |
| Mining, except oil and gas | .1 |
| Ambulatory health care services | .1 |
| Accommodation | .0 |
| Federal government | .0 |
| Food and beverage and tobacco products | -.1 |
| Fabricated metal products | -.1 |
| State and local government | -.2 |
| Truck transportation | -.2 |
| Waste management and remediation services | -.2 |
| Furniture and related products | -.2 |
| Nonmetallic mineral products | -.2 |
| Amusements, gambling, and recreation industries | -.3 |
| Hospitals and nursing and residential care facilities | -.3 |
| Miscellaneous professional, scientific, and technical services | -.3 |
| Paper products | -.3 |
| Transit and ground passenger transportation | -.4 |
| Utilities | -.5 |
| Chemical products | -.6 |
| Other services, except government | -.8 |
| Construction | -.9 |
| Legal services | -1.5 |
| Rental and leasing services and lessors of intangible assets | -1.9 |
| Educational services | -3.0 |
| Sources: Federal Aviation Administration, Bureau of Economic Analysis. | |
In general, there has been a slowdown in gross output across the economy, and air transportation also has been deliberate in adopting a “capacity discipline” philosophy. Still, air transportation saw a labor decline from 2000 to 2010 because of the new economic structural changes introduced by the legacy carriers.
The analysis carried out in this article has found that multifactor productivity growth and labor productivity growth in the air transportation industry were substantial contributors to the nation’s productivity growth during the period from 1997 to 2014. This finding, based on the BEA/BLS integrated production account, adds another perspective on an industry that has had widely varying estimates of productivity among data providers. Specifically, noteworthy growth in labor productivity driven by labor input declines initiated by the legacy air carriers, as well as strong output growth from the low-cost carriers, during the 2002–07 period led the nation’s productivity growth during the longer 1997–2014 period examined. Over the longer period, air transportation accounted for 7 percent of the nation’s multifactor productivity growth and had the second-fastest multifactor productivity growth of all industries in the economy, after computers. This finding, which quantifies the extent to which the air transportation industry affects productivity growth in the total U.S. economy, is consistent with other work analyzing air transportation productivity growth and with the official measures of productivity produced by BLS.
Further, the analysis presented here provides another measure of productivity to supplement the existing ones and help statistical agencies bridge discrepancies concerning the vital air transportation industry, which has contributed much to growth in the computer industry as well as other industries throughout the economy.
The most important developments of the late 1990s in the air transportation industry were the industry’s capital investment in information technology and launching of the air carriers’ homepages whereby they could sell tickets directly to travelers. The latter innovation saved millions of dollars in expensive service commission fees, and the savings extended through the early part of the first decade of the 2000s. Also, legacy carriers that were supposedly locked into expensive labor contracts not suited to the pricing environment that low-cost carriers introduced found ways to exit those contracts through mergers and bankruptcies beginning shortly after the recessionary period from March through November 2001.
In addition to merging airlines and restructuring expenses, the airline industry began to outsource major technical repairs and maintenance, a move that allowed the carriers to reduce their staffing of maintenance workers. The action further reduced labor input in an industry that was already undergoing rapid labor declines. The middle of the first decade of the 2000s saw the industry use regional aircraft to meet rising demand from the traveling public; within the same period, the industry also established the single-aisle aircraft now typically used by the low-cost carrier fleet. Largely through the legacy carriers’ labor cuts and the low-cost carriers’ expansion of revenue passenger miles, during the 1997–2014 period the airline industry became the nation’s fourth-fastest labor-productivity-growing industry.
Later, as fuel prices began their volatile swings in the middle of and late into the first decade of the 21st century, air carriers found ways to increase fuel efficiency on existing aircraft to sustain operations. In addition, they cut back on the number of departures of their less fuel-efficient aircraft. Since the end of the Great Recession in June 2009, airlines have been in a “meet demand” mode of operation, carefully considering route decisions with an eye toward limiting capacity growth. The labor market in the air transportation industry appears to be settling, with the legacy carriers’ cuts subsiding and the low-cost carriers’ labor increases moderating. Throughout the period examined, the airline industry proved innovative in seeking more profitable and efficient ways to use the resources it had. Among the innovations introduced were lengthening the distances flown, increasing the gauge of aircraft to accommodate more paying passengers, and switching departures to aircraft that were more fuel efficient when the price of jet fuel became a substantial share of production expenses.
As the second decade of the 2000s is unfolding, real-output growth has been tempered through the air transportation industry’s implementation of the notion of capacity discipline; as a result, the number of departures of regional aircraft carrying fewer than 60 passengers has declined. What is most clear is that air carriers are not overcommitting themselves in an economy that has been slow to recover from the Great Recession and that, up until very recently, had been characterized by rapidly fluctuating fuel prices. This article has shown that, by its ability to adapt to changing production scenarios and achieve industry-leading efficiency gains, the air transportation industry has proven itself to be a key player in moving the nation’s growth forward. Given that productivity gains routinely represent 20 percent of the nation’s economic growth, it is clear that air transportation’s role as an industry leader in productivity gains will be essential in moving the nation forward from the ravages of the Great Recession.57
ACKNOWLEDGMENTS: Special thanks go to David Chin, Thea Graham, Tony Choi, Randy Matsunaga, Jon Samuels, Erich Strassner, Lucy Eldridge, Victor Torres, Jim Mildenberger, and Brian Chansky for their thoughtful and thorough comments that helped elevate this work. Thanks also go to those members of the staffs of the Federal Aviation Administration, U.S. Bureau of Labor Statistics, and U.S. Bureau of Economic Analysis who assisted in providing feedback.
Matthew Russell, "Economic productivity in the air transportation industry: multifactor and labor productivity trends, 1990–2014," Monthly Labor Review, U.S. Bureau of Labor Statistics, March 2017, https://doi.org/10.21916/mlr.2017.9
1 Susan Fleck, Steven Rosenthal, Matthew Russell, Erich H Strassner, and Lisa Usher, “A prototype BEA/BLS industry‐level production account for the United States,” paper presented at the second World KLEMS Conference, Harvard University, Cambridge, Massachusetts, August 9–10, 2012, https://apps.bea.gov/industry/pdf/Prototype%20BEA-BLS%20Industry-Level%20Production%20Account%20for%20the%20United%20States%201998-2010_Final.pdf; see especially p. 5.
2 Ibid., p. 15.
3Measuring productivity: measurement of aggregate and industry-level productivity growth (OECD manual) (Paris: Organisation for Economic Co-operation and Development, 2001), https://www.oecd.org/std/productivity-stats/2352458.pdf, see especially p. 20.
4 The economic impact of civil aviation on the U.S. economy (U.S. Department of Transportation, Federal Aviation Administration, June 2014), https://www.faa.gov/air_traffic/publications/media/2014-economic-impact-report.pdf, see especially pp. 4–5.
5 See Handbook of methods (U.S. Bureau of Labor Statistics), chapter 11, “Industry productivity measures,” https://www.bls.gov/opub/hom/pdf/homch11.pdf.
6 Some output data from the national accounts are derived from labor estimates—a situation that can be a concern from the standpoint of productivity measurement.
7 Fleck, Rosenthal, Russell, Strassner, and Usher, “A prototype BEA/BLS industry‐level production account.”
8 John Duke and Victor Torres, “Multifactor productivity change in the air transportation industry,” Monthly Labor Review, March 2005, pp. 32–45, https://www.bls.gov/opub/mlr/2005/03/art3full.pdf.
9 Anthony Apostolides, “An analysis of labor and multifactor productivity in air transportation: 1990–2001” (U.S. Department of Transportation, Bureau of Transportation Statistics), http://www.rita.dot.gov/bts/sites/rita.dot.gov.bts/files/publications/research_papers/an_analysis_of_labor_and_multifactor_productivity/pdf/entire.pdf
10 Robert A. Powell II, “Productivity performance of U.S. passenger airlines since deregulation,” master’s thesis, Master of Science in Transportation program (Cambridge, MA: Massachusetts Institute of Technology, June 2012).
11 David J. Donatelli, “Evolution of U.S. air cargo productivity,” master’s thesis, Master of Science in Transportation program (Cambridge, MA: Massachusetts Institute of Technology, September 2012).
12 Michael H. Cimini and Charles J. Muhl, “Labor–management bargaining in 1994,” Monthly Labor Review, January 1995, pp. 23–39, https://www.bls.gov/mlr/1995/01/art2full.pdf.
13 Bogdan Daraban, “The low cost carrier revolution continues: evidence from the U.S. airline industry,” Journal of Business & Economics Research, January 2012, pp. 37–44.
14 See Robert Solow, “Technical change and the aggregate production function,” Review of Economics and Statistics, August 1957, pp. 312–320.
15 Amanda S. Lyndaker, “Integrated BEA/BLS industry-level production account: initial statistics for 2014 and revised statistics for 1998–2013,” Survey of Current Business, July 2016, pp. 1–4, https://apps.bea.gov/scb/pdf/2016/07%20July/0716_integrated_industry_level_production_account.pdf.
16Thomas F. Howells and Edward T. Morgan, “Industry economic accounts: initial statistics for the second quarter of 2014; revised statistics for 1997–2013 and the first quarter of 2014,” Survey of Current Business, December 2014, https://apps.bea.gov/scb/pdf/2014/12%20December/1214_industry_economic_accounts.pdf, see especially pp. 9–11.
17 Fleck, Rosenthal, Russell, Strassner, and Usher, “A prototype BEA/BLS industry‐level production account.”
18 Evsey Domar, “On the measurement of technological change,” Economic Journal, December 1961, pp. 709–729.
19 See Dale Jorgenson, Frank Gollop, and Barbara Fraumeni, Productivity and U.S. economic growth (Cambridge, MA: Harvard University Press, 1987); and Frank Gollop, “Accounting for intermediate input: the link between sectoral and aggregate measures of productivity growth,” chapter 18 in Measurement and interpretation of productivity (Washington, DC: National Academy of Sciences, 1979), http://www.nap.edu/read/9578/chapter/18.
20 See Handbook on price and volume measures in national accounts (Luxemburg: Office for Official Publications of the European Communities, 2001), http://ec.europa.eu/eurostat/ramon/statmanuals/files/KS-41-01-543-__-N-EN.pdf, especially p. 84; and Technical note (U.S. Bureau of Labor Statistics, September 20, 2016), https://www.bls.gov/news.release/prin3.tn.htm.
21 Brian C. Moyer, Mark A. Planting, Mahnaz Fahim-Nader, and Sherlene K. S. Lum, “Preview of the comprehensive revision of the annual industry accounts: integrating the annual input–output accounts and gross-domestic-product-by-industry accounts,” in Survey of Current Business, March 2004, pp. 38–51, https://apps.bea.gov/scb/pdf/2004/03March/0304IndustryAcctsV3.pdf.
22 “Rental price tables: 1987–2014 rental price detail measures by asset type for NIPA-level manufacturing industries,” Multifactor productivity (U.S. Bureau of Labor Statistics, September 15, 2016), https://www.bls.gov/mfp/mprdload.htm.
23 “Labor productivity and costs, hours and labor composition tables for all NAICS 3-digit industries through 2014” (U.S. Bureau of Labor Statistics, June 2016), https://www.bls.gov/mfp/special_requests/prod3.hrslabcmp.zip.
24 Labor productivity and costs (U.S. Bureau of Labor Statistics), https://www.bls.gov/lpc/.
25 The legacy group comprises American Airlines, US Airways, America West, Trans World Airlines (TWA), Delta, Continental, United, Northwest, and Hawaiian, some of which are no longer operating. The low-cost group includes AirTran, Southwest Airlines, Alaska, JetBlue, Spirit, Allegiant, and Frontier. Labor input and output contributions did not add up directly, but were forced to totals for the industry. Labor input contributions were distributed by using employment shares controlled to total input change. For clarity, labor input and output contributions were controlled to growth.
26 Todd Woody, “Airline sites take off fast,” CNN.com, June 9, 1999, http://edition.cnn.com/TECH/computing/9906/09/airline.idg/.
27 Aircraft Form 41, Schedule P-6 (U.S. Department of Transportation, Bureau of Transportation Statistics), http://www.transtats.bts.gov/.
28 Ibid.
29 Apostolides, “An analysis of labor and multifactor productivity.”
30 “Air carrier statistics (Form 41 Traffic)—all carriers,” TranStats (U.S. Bureau of Transportation Statistics), http://www.transtats.bts.gov/Tables.asp?DB_ID=111.
31 Ibid.
32 Edward Wong, “American Air reaches deal with 3 unions on big cuts,” The New York Times, April 1, 2003, http://www.nytimes.com/2003/04/01/business/01AIR.html?pagewanted=all.
33 Marnie Hunter, “Travel: bumpy ride expected for airline industry in 2005,” CNN.com, December 10, 2004, http://www.cnn.com/2004/TRAVEL/ADVISOR/12/10/airline.forecast/index.html?iref=newssearch.
34 Brad Foss, “Increasing productivity a necessity for airlines,” Deseret News, January 9, 2005, http://www.deseretnews.com/article/600103191/Increasing-productivity-a-necessity-for-airlines.html?pg=all.
35 Richard Newman, “United, Continental merger resulted in job losses; flight attendants bear brunt of cuts,” North Jersey.com, June 18, 2014.
36 Terry Maxon, “Nearly a quarter of U.S. airline jobs vanished in decade, data show,” The Dallas Morning News, February 2010.
37 Ibid.
38 Robert F. Barron II, “Code-share agreements: a developing trend in U.S. bilateral aviation negotiations,” Indiana Law Journal, Spring 1997, http://www.repository.law.indiana.edu/ilj/vol72/iss2/12.
39 Michelle Higgins, “Airline alliances: decoding the mysteries of the code share,” The New York Times, December 17, 2006, http://www.nytimes.com/2006/12/17/travel/17prac.html?_r=0.
40 “The economic benefits generated by alliances and joint ventures,” IATA Economics Briefing, November 28, 2011.
41 Hugo Martín, “Airport kiosks do nearly everything but check luggage,” Los Angeles Times, December 5, 2009, http://articles.latimes.com/2009/dec/05/business/la-fi-briefcase5-2009dec05.
42 Giovanni Bisignani, Annual report 2007, presented at the 63rd Annual General Meeting of the International Air Transport Association, Vancouver, BC, Canada, June 2007.
43 Aircraft Form 41, Schedule P-6.
44 “FAA faulted for laxness on repair outsourcing,” NBC News.com, October 4, 2008, http://www.nbcnews.com/id/27019484/ns/business-us_business/t/faa-faulted-laxness-repair-outsourcing/.
45 Chris Kahn, “Airlines trying to lighten the load: high cost of fuel has carriers scouring planes to remove dead weight,” LJ World, March 29, 2008, http://www2.ljworld.com/news/2008/mar/29/airlines_trying_lighten_load/.
46 “Winglets: making their presence felt,” Aircraft Technology Engineering & Maintenance, April/May 2004, http://www.aviationpartnersboeing.com/pdf/news/at69winglets.pdf. An airline’s stage length is the length of the average flight of the airline.
47 “Table 4.1 Foreign Transactions in the National Income and Product Accounts,” National Economic Accounts (U.S. Bureau of Economic Analysis), https://apps.bea.gov/scb/pdf/2010/08%20August/nipa_Section4.pdf, click on “Section 4 – foreign transactions.”
48 Micheline Maynard, “To save fuel, airlines find no speck too small,” The New York Times, June 11, 2008, http://www.nytimes.com/2008/06/11/business/11air.html.
49 Michael D. Wittman, “2013 data update: trends and market forces shaping small community air service in the United States,” MIT Small Community Air Service White Paper No.6, Report No. ICAT-2014-03 (Cambridge, MA: Massachusetts Institute of Technology, MIT International Center for Air Transportation (ICAT), May 2014).
50 Genevieve Shaw Brown, “American Airlines: timeline of troubles,” October 2, 2012, ABC News.
51 Laura Keeney, “650 people let go as United dumps SkyWest as Denver baggage handler,” The Denver Post, September 9, 2014, http://www.denverpost.com/business/ci_26501189/650-people-let-go-united-dumps-skywest-denver.
52 Trefis Team, “Airline industry will have to maintain capacity discipline to remain profitable,” Forbes, June 20, 2014, http://www.forbes.com/sites/greatspeculations/2014/06/20/airline-industry-will-have-to-maintain-capacity-discipline-to-remain-profitable/.
53 Peter Belobaba, Amedeo Odoni, and Cynthia Barnhart, The global airline industry (Chichester, West Sussex, U.K.: John Wiley & Sons, 2009).
54 Up-gauging refers to the more recent trend by air carriers to purchase larger planes that accommodate more passengers or to buy planes similar to ones that the airline already owns but that can be configured with more seating.
55 Jad Mouawad, “Delta buys refinery to get control of fuel costs,” The New York Times, April 30, 2012, http://www.nytimes.com/2012/05/01/business/delta-air-lines-to-buy-refinery.html?_r=0.
56 “U.S. multifactor productivity, Division of Industry Productivity Studies - September 20, 2016” (U.S. Bureau of Labor Statistics), https://www.bls.gov/mfp/mfp_by_industry_and_measure.xlsx.
57 Steven Rosenthal, Matthew Russell, Jon D. Samuels, Erich H. Strassner, and Lisa Usher, “Integrated industry-level production account for the United States: intellectual property products and the 2007 NAICS,” paper presented at the 3rd World KLEMS Conference, Tokyo, Japan, May 19–20, 2014, https://apps.bea.gov/industry/pdf/IntegratedProductionAccount_3rdWorldKlems_BEA_BLS_paper.pdf.