An official website of the United States government
An official website of the United States government
The .gov means it's official.
Federal government websites often end in .gov or .mil. Before sharing sensitive information,
make sure you're on a federal government site.
The site is secure.
The
https:// ensures that you are connecting to the official website and that any
information you provide is encrypted and transmitted securely.
Education output measures for elementary and secondary schools typically include a physical volume measure, such as number of students, to estimate the quantity of education services provided. The quantity measure is then quality adjusted to capture increases in educational output due to curriculum changes, improved teaching methods, smaller classes, and other factors.1 Determining the best approach to capturing quality changes in education output has been the focus of much recent research in this area.2 But the measures that have been proposed assume that students are homogeneous; consequently, such measures do not account for different types of students.
In reality, both elementary and secondary schools offer substantially different services to well-defined groups of students. Today, public and private schools in the United States provide students with not only instructional services, but also supplementary student support services, such as guidance counseling, healthcare services (including school nurses; school psychologists; vision, dental, audiology, and speech screenings; and speech therapy services), food services, and transportation services (offered primarily by public schools). Additional support services for students with learning, emotional, or physical disabilities are also provided when appropriate. Students with disabilities, English language learners, and students from impoverished backgrounds require more and different services than their counterparts without disabilities require.
This article constructs alternative measures of education output for public elementary and secondary schools that account for differences in both instructional and noninstructional services provided to students with and without disabilities.3 In what follows, I compare these heterogeneous education output measures with homogeneous measures, for all public elementary and secondary school students. I also construct labor productivity measures for public elementary and secondary schools, using only the homogeneous “all students” output measure, the composite “students with and without disabilities” output measure, and U.S. Bureau of Labor Statistics research data series on public school labor input.
The physical volume–based education output measures I use are constructed from National Center for Education Statistics (NCES) enrollment data.4 The output measures are quality adjusted by means of National Assessment of Educational Progress (NAEP) Long Term Trend (LTT) test scores. The quality-adjusted “all students” and “students with/without disabilities” measures are augmented to explicitly account for selected noninstructional services. I draw conclusions from these results regarding the potential value of including further distinctions on services provided to other student groups and regarding the importance of improving, on a national basis, education-related data collection, particularly the collection of expenditure data targeted toward educational services for English language learners and impoverished children.
Public elementary and secondary schools in the United States are required to meet the needs of a diverse population of students, including students with disabilities, English language learners, and students from impoverished backgrounds.5 To do so, they provide, among other services, instructional services; student support services, such as guidance counseling, health room services, attendance services, and occupational and physical therapy; speech pathology services; and noninstructional services, such as transportation and food services. Public schools typically provide free bus transportation to students, including special transportation services as required by students with disabilities. Public schools also participate in the free and reduced-price lunch program overseen by the U.S. Department of Agriculture.
Students with disabilities include children with physical, mental, emotional, behavioral, and learning disorders.6 Under Section 504 of the Rehabilitation Act of 1973, the 1990 Americans with Disabilities Act, and the Education for All Handicapped Children Act of 1975, most recently updated by the Individuals with Disabilities Education Improvement Act (IDEA) of 2004, these students are entitled to receive a free and appropriate education in the least restrictive environment possible.7 Among the variety of services that students with disabilities may receive are the following:
English language learners are offered a range of different instructional approaches that vary by state and school district. Among these approaches are the following:
Students who come from families that are near or below the poverty level are provided with additional services through Title I, Part A, of the federal Elementary and Secondary Schools Act of 1965, most recently reauthorized by the Every Student Succeeds Act of 2015.9 This legislation provides financial assistance to local education agencies (LEAs) and schools with high numbers or high percentages of children from low-income families, to help ensure that all children meet challenging state academic standards. Title I funds are offered in the form of grants to LEAs,10 which then target the funds to schools with the highest percentages of children from low-income families. Schools in which children from low-income families make up at least 40 percent of enrollment are eligible to use Title I funds for schoolwide programs (programs that serve all children in the school). Unless a school is operating a schoolwide program, the school must focus Title I services on children who are failing, or most at risk of failing, to meet state academic standards.11 In addition to receiving Title I funds, students from families near or below the poverty level benefit from the National School Lunch Program, which provides free and reduced-price meals, school breakfasts, and, in some instances, summer meal programs to eligible students.12
The public school system relies on state and local funding, supplemented by funds from federal programs, to provide educational services to all students. Because both instructional and noninstructional services vary according to the type of student, the cost of providing educational services differs for each category of student. For example, educational services for a non–English language learner without a disability and from a family living above the poverty line are different in nature and cost from those for a student with a disability, an English language learner, or a student from a family living at or below the poverty line.
Ideally, to examine the importance of measuring the provision of different educational services to uniquely identified groups of students in capturing education output, each of the important student groups and associated services would be included in the output measure. Data on the number of students enrolled in public schools from each of these categories are readily available, and NAEP test scores of students in these groups have recently become available. However, adequate expenditure data on services provided to English language learners and low-income students are currently not available.13 Consequently, this article focuses on the importance of distinguishing the educational services provided to students with and without disabilities.
The population of public school students with disabilities has increased from 11 percent of all students in 1990 to 13 percent in 2013.14 At the same time, the percentage of public school students with disabilities who spend 80 percent or more of their time mainstreamed in a regular classroom increased from 33 percent in 1990 to 62 percent in 2013.15 Another large group, English language learners, saw its numbers increase in all but 11 states. The group grew from 5.0 percent of public school students in 1993 to 9.3 percent in 2013 and made up as much as 16.6 percent of public school students in large cities that year.16 Future research may focus on the educational services provided to these students as well.
In what follows, I develop the underlying data and framework required for distinguishing educational services provided to students with and without disabilities and for capturing the impact on measured output of providing services to these two groups of students at differing costs. I also develop measures of noninstructional services, including special and regular transportation services and food services, that are explicitly incorporated into one output measure in order to examine the impact of accounting for these services separately.
I begin by constructing three heterogeneous education output measures that I subsequently compare with three homogeneous “all students” education output measures. The homogeneous measures include the simple quantity measure
 =
=  , (1)
, (1)
based on unadjusted “all students” enrollment, and the quality-adjusted measure
 =
=  × (
× ( ) +
) +  × (
× ( ) +
) +  × (
× ( ), (2)
based on “all students” enrollment,17 where (, , ) is the number of students enrolled in grades K–12 (grades K–4, 5–8, and 9–12); the superscript A indicates that the measure includes “all students”; the superscript q indicates that the output data were quality adjusted; is a weight based on a simple average of mathematics and reading LTT test scores for age 9; is a weight based on a simple average of mathematics and reading LTT test scores for age 13; and is a weight based on a simple average of mathematics and reading LTT test scores for age 17.
The third homogeneous output measure,  includes transportation services and food services besides the aforementioned measures. Educational services are estimated as a physical volume measure based on public school student enrollment of students in grades K–12, quality adjusted with the use of NAEP LTT test scores.18 Transportation and food services for all students are explicitly included as separate noninstructional outputs. Transportation services for “all students” are estimated by a physical count of elementary and secondary school students transported at public expense.19 Food services for “all students” are estimated by a physical count of the number of school lunches served.20 For each individual output measure underlying the “all students” output measure, shares of total expenditures are constructed from expenditure data from the National Public Education Financial Survey.21 For the more inclusive output measure, education output is a weighted function of quality-adjusted educational services
  , transportation services
  , and food services
  , for all public school students—namely,
 =
=  +
+  +
+ 

 , (3)
, (3)
where w is the total expenditure share weight, E indicates educational services, T denotes transportation services, and F designates food services.
The three heterogeneous education output measures include a simple quantity measure, , based on expenditure-weighted public school enrollment of students with and without disabilities (ND = nondisability), unadjusted for quality change:
 =
= 
 +
+ 
 . (4)
. (4)
A second measure,  , is based on expenditure-weighted public school enrollment of students with and without disabilities, quality adjusted with the use of NAEP LTT test scores, and is given by
=  +
+  , (5)
, (5)
where w is as before,
= 
 +
+ 
 +
+ 
 , (6)
, (6)
and
= 
 +
+ 
 +
+ 
 . (7)
. (7)
Note that, in general,  is the number of students, where h denotes whether the student has (D) or does not have (ND) a disability and j–m indicates the grade range; and
  is a weight based on a simple average of mathematics and reading LTT test scores for students of status h at age 9 for grades K–4, age 13 for grades 5–8, and age 17 for grades 9–12.
The third heterogeneous measure of education output,  , is a weighted function of quality-adjusted educational services for students with disabilities, quality-adjusted educational services for students without disabilities, special transportation services for students with disabilities who require such services, regular transportation services for students with and without disabilities, and food services for all students, and is given by
 ´
´  ) + (
) + ( ´
´  ) + (
) + ( ´
´  ) +
) +
( ´
´  ) + (
) + ( ´
´  ) + (
) + ( ), (8)
where Spec T indicates special transportation services and Reg T denotes regular transportation services. The weights w are total expenditure weights.
Educational services for students with and without disabilities are physical volume measures based on public school enrollment of those students, quality adjusted by means of NAEP LTT scores for the two student categories. Public school enrollment of students with disabilities is estimated from data on the percentage of children in prekindergarten through grade 12 who are served under IDEA, Part B, on the basis of total enrollment in public schools.22
I construct two measures of transportation services to account, respectively, for the more costly “special transportation” services for some students with disabilities and for the less costly “regular transportation” services used by students who do not require special transportation. Using data on the total number of students transported and the percentage of students with disabilities who receive special and regular transportation services, I estimate the number of students with disabilities who receive special transportation services and the number of students (both those with and those without disabilities) who receive regular transportation services. Along with estimating the number of students who receive special transportation services, I use data on total transportation expenditures and the per-pupil cost of transporting students with disabilities via special transportation services to develop an expenditure weight for special transportation services. Similarly, I develop an expenditure weight for regular transportation services, using data on total transportation expenditures and the per-pupil cost of providing regular transportation services.23 I do not distinguish food services separately for students with and without disabilities, and I estimate such services by a physical count of the number of lunches served.
Public school student enrollment data for grades K–12, obtained from NCES, are used as the basis for the physical volume measures of education output. NCES conducts a number of surveys on education at all levels, including early childhood, elementary and secondary, and postsecondary education. Data on elementary and secondary public school education are available from the NCES Common Core of Data database and are obtained from public school administrative records.
Using data on the number of students ages 3–21 served under IDEA, I estimate public school enrollment of students with and without disabilities as a percentage of all public school enrollment. Data on the percentage of public school students enrolled are from the U.S. Department of Education, as published in the Digest of Education Statistics.24 The NCES public school enrollment data on all students are split into the categories of students without disabilities and students with disabilities on the basis of the percentage of the latter students enrolled in public schools. This percentage ranged from 10.1 percent in 1980 to 13.2 percent in 2009, with a high of 13.8 percent in 2004.25
For both the “all students” education output measures and the output measures for students with and without disabilities, I adjusted public school enrollment in each year with the use of NAEP LTT test score data. NAEP maintains two assessment programs: the Main NAEP Assessments,26 which are revised about every decade to reflect changes in curriculum in the nation’s schools, and the LTT Assessments, which have remained relatively unchanged since they were first administered in 1969.27 Both of these assessment programs include public and private elementary and secondary schools, with data reported for all schools, public schools only, and private schools only.28
To measure changes in the educational levels of students over time, LTT data are used. Because the framework underlying the Main NAEP Assessments is revamped approximately every decade to match changes in curriculum and instructional services, the length of time during which the Main NAEP Assessments can be used to make comparisons is reduced.29 By comparison, the LTT Assessment has used “substantially the same assessments” since it was first administered in 1969.30 The LTT Assessment originally covered reading, mathematics, writing, and science subjects. Writing and science, however, began to be transferred to the Main Assessment in 2004 and are no longer included in the LTT Assessment.
Until 1996, differences in the educational performance of students with specific educational needs were difficult to track. NAEP provided no testing accommodations for students with disabilities or for English language learners prior to that year. As a result, many of these students were excluded from NAEP testing, thus limiting the number who were available for testing. With the passage of the IDEA Amendments of 1997, NAEP prepared new guidelines for testing accommodations and for the inclusion of students with disabilities and English language learners in NAEP testing.31 Beginning in 2004, NAEP published the long-term reading and mathematics test scores of students with disabilities, English language learners, and students approved for free and reduced-price lunches.32
The LTT reading and mathematics scores for “all students” ages 9, 13, and 17 in public schools are used to quality adjust the NCES elementary and secondary public school student enrollment data series for “all students.” Reading test score data for public schools are available for 1980, 1984, 1988, 1990, 1992, 1994, 1996, 1999, 2004, 2008, and 2012. Mathematics test score data for public schools are available for 1978, 1982, 1986, 1990, 1992, 1994, 1996, 1999, 2004, 2008, and 2012. The test score data are interpolated between testing years to estimate scores for nontesting years. A ratio of the reading or mathematics test score to the perfect score for “all students” in public schools is computed for each year.
For public school quality-adjusted education output measures for “all students,” public school student enrollment for grades K–4 is adjusted by averaging the mathematics and reading test score ratios for age 9 to get a single score for grades K–4. The resulting test score ratio series is multiplied by public school “all students” enrollment for grades K–4 to obtain a quality-adjusted education output measure for grades K–4. A similar procedure is followed to quality adjust output for students in grades 5–8 and 9–12, using LTT mathematics and reading test scores for ages 13 and 17, respectively. The quality-adjusted enrollment data series for grades K–4, 5–8, and 9–12 are then summed to obtain a quality-adjusted “all students” elementary and secondary public school education output series for grades K–12.
For quality-adjusted education output measures for students with and without disabilities, public school enrollments are adjusted separately for the two groups with the use of the NAEP LTT reading and mathematics scores for students ages 9, 13, and 17 with and without disabilities.33 Because reading and mathematics test scores for both groups of students are published only for 2004, 2008, and 2012, these test scores are extrapolated back to 1980 by multiplying the current years’ “all students” test score by the ratio of the previous years’ test score for students with (or without) disabilities to the previous years’ “all students” test score. The test score data for students with and without disabilities are interpolated between the 2004, 2008, and 2012 testing years to estimate test scores for nontesting years.
Interestingly, for the 2004–12 period, for students with disabilities, reading test scores of those ages 9, 13, and 17, and mathematics test scores of those age 9, grew at a faster pace than test scores of students without disabilities who were the same ages, as shown in table 1. Over the lengthier 1990–2012 period, mathematics test scores of students with disabilities at age 9 and reading test scores at ages 9, 13, and 17 had larger growth rates than corresponding scores of students without disabilities. This difference suggests a relatively faster pace of improvement in learning at later ages for students with disabilities than for students without disabilities.
| Period and category of student | Mathematics | Reading | ||||
|---|---|---|---|---|---|---|
| Age 9 | Age 13 | Age 17 | Age 9 | Age 13 | Age 17 | |
| 2004–12: | ||||||
All students(1) | 0.240 | 0.276 | 0.042 | 0.293 | 0.293 | 0.184 |
Students with disabilities(1) | .404 | .306 | -.012 | .409 | .411 | .642 |
Students without disabilities(1) | .239 | .316 | .068 | .333 | .350 | .194 |
| 1990–2012:(1) | ||||||
All students(1) | .276 | .239 | .026 | .246 | .106 | -.052 |
Students with disabilities(2) | .315 | .225 | .021 | .264 | .185 | .191 |
Students without disabilities(2) | .237 | .256 | .061 | .262 | .173 | .015 |
Notes: (1) National Assessment of Educational Progress, Long Term Trend test scores. (2) National Assessment of Educational Progress, Long Term Trend test scores and estimated test scores prior to 2004 for students with and without disabilities. Sources: U.S. Department of Education and U.S. Bureau of Labor Statistics. | ||||||
As is done for the “all students” group, ratios of the reading and mathematics test scores to the perfect score are computed each year for the group of students with disabilities and, separately, the group of students without disabilities, in order to quality adjust the enrollment of students with disabilities and students without disabilities and obtain appropriate output measures. For example, the estimated public school enrollment of students with disabilities who are in grades K–4 is adjusted by using a simple average of the reading and mathematics test score ratios for students with disabilities at age 9. The resulting test score ratio is then multiplied by the public school enrollment of students with disabilities who are in grades K–4, yielding a quality-adjusted education output measure for students in those grades. The procedure is repeated for grades 5–8 and 9–12, with the estimated public school enrollment of students with disabilities who are in grades 5–8 and 9–12 adjusted by using simple averages of the reading and mathematics test score ratios for ages 13 and 17, respectively. The resulting test score ratios are then multiplied by the public school enrollment of students with disabilities who are in grades 5–8 and 9–12, respectively, to obtain quality-adjusted education output measures for students with disabilities who are in those grades.
Finally, the quality-adjusted enrollment data series for grades K–4, 5–8, and 9–12 are totaled to obtain a quality-adjusted elementary and secondary public school education output series for students with disabilities who are in grades K–12. A similar procedure is followed for students without disabilities, using LTT test scores for the group “students without disabilities” to obtain a quality-adjusted elementary and secondary public school education output series for students without disabilities who are in grades
Data on transportation services for “all students” include data on the number of students transported at public expense and data on public school transportation expenditures.34 However, our third heterogeneous education output measure for students with and without disabilities, described in equation (8), requires estimates of regular and special transportation services. Although all students without disabilities receive regular transportation services, only a portion of the population of students with disabilities receives special transportation services. Accordingly, data on the percentage of students who require special transportation, the per-pupil transportation expenditure for students who receive special transportation, and the per-pupil transportation expenditure for students who receive regular transportation are used to estimate separate transportation services for students with disabilities who require special transportation and for both students with disabilities and students without disabilities who require regular transportation.35
Special transportation services are estimated as
 = (
= ( ´
´  ) ´ (
) ´ ( ), (9)
where is the number of students with disabilities who are in public schools, is the percentage of students with disabilities who receive any transportation services (regular or special), and  is the percentage of students with disabilities who receive transportation services and who require special transportation.
Transportation services for students who require regular transportation are estimated as the number of students without disabilities who receive regular transportation services plus the number of students with disabilities who receive regular transportation services. The number of students with disabilities who receive regular transportation services is estimated as
 = (( ´ ) ´
  ), (10)
where is the number of students with disabilities who are in public schools and is the percentage of students with disabilities who require regular transportation services. The number of students without disabilities who receive regular transportation services is estimated on the basis of the equation
TrExp =  ´
´  +
+  ´ (
´ ( +
+  ), (11)
where TrExp denotes transportation expenditures,  is the per-pupil cost of special transportation in public schools, is the per-pupil cost of regular transportation in public schools, is the number of public school students with disabilities who require special transportation, is the number of public school students without disabilities who require regular transportation, and
  is the number of public school students with disabilities who require regular transportation. Solving equation (11) for yields the number of students without disabilities who receive regular transportation services:
= (((TrExp – ( ´ ))/ ) – ). (12)
The number of students who require regular transportation is then computed by summing the number of students with disabilities who require regular transportation and the number of students without disabilities who require regular transportation:
 = + .(13)
Data on food services include the number of lunches served and total expenditures for food services.36 To construct the separate composite output measure 37 for students with and without disabilities,38 I use the ratio of students with disabilities to all students and the ratio of students without disabilities to all students to estimate the number of lunches served and expenditures on school lunches for, respectively, students with and students without disabilities. These ratios are then applied to school lunch data from the U.S. Department of Agriculture National School Lunch Program and the U.S. Department of Education to create separate estimates of the number of school lunches and the amount of expenditures for the two groups of students. While food services are assumed to be identical for students with and without disabilities, estimating the cost of food services provided to students with and without disabilities is necessary in order to construct separate expenditure weights for the various outputs, including educational services provided to students with and without disabilities, regular transportation services, and special transportation services.
I constructed expenditure share weights for each of the five individual output measures underlying the education output measure for students with and without disabilities.39 For the purpose of constructing these weights, I use expenditures on educational services for students with disabilities to estimate a ratio of the average amount spent to educate a student with disabilities relative to the average amount spent to educate a student without disabilities.40 For students with disabilities, special and regular transportation and food costs are subtracted from educational expenditures to calculate the expenditure weight for educational services. Expenditures for special transportation services for those students are calculated with the use of estimates of both the percentage of students with disabilities who require special transportation services and the higher cost of special transportation services.41 Expenditures for regular transportation services for those students are estimated with the use of data on the percentage of students with disabilities who require regular transportation services and on expenditures for regular transportation services. Expenditures for food services are based on the same price per meal for students with and students without disabilities and are allocated to those two groups in proportion to their respective percentages within the public school student population.
Six alternative education output measures are presented. Three of the measures— , , and —are based on all public school students, and the other three measures—
 , , and —separately account for public school students with and without disabilities. Table 2 presents annual growth rates in enrollment of all students, students with disabilities, and students without disabilities in public elementary and secondary schools for 1981–2012. The annual growth rates in enrollment of public school students with and without disabilities tend to differ, correlating at a rate of just 0.67. During the 1990s, the high growth rates of public school students with disabilities relative to those without disabilities were the result of an overall increase in the growth rate of all public school students as well as large increases in the percentage of students identified as having specific learning disabilities.
| Year | All students | Students with disabilities | Students without disabilities |
|---|---|---|---|
| 1981 | -2.039 | -0.757 | -2.183 |
| 1982 | -1.195 | .081 | -1.341 |
| 1983 | -.792 | .473 | -.939 |
| 1984 | -.112 | 1.145 | -.260 |
| 1985 | .545 | 1.795 | .396 |
| 1986 | .840 | 2.078 | .690 |
| 1987 | .642 | 1.862 | .492 |
| 1988 | .451 | 1.655 | .301 |
| 1989 | .881 | 2.076 | .730 |
| 1990 | 1.662 | 2.527 | 1.552 |
| 1991 | 2.014 | 3.504 | 1.822 |
| 1992 | 1.847 | 3.305 | 1.655 |
| 1993 | 1.498 | 3.571 | 1.222 |
| 1994 | 1.488 | 3.107 | 1.267 |
| 1995 | 1.653 | 3.632 | 1.378 |
| 1996 | 1.718 | 2.809 | 1.564 |
| 1997 | 1.131 | 3.019 | .860 |
| 1998 | .893 | 2.575 | .646 |
| 1999 | .685 | 2.230 | .453 |
| 2000 | .739 | 1.709 | .592 |
| 2001 | .992 | 1.773 | .872 |
| 2002 | 1.072 | 1.811 | .958 |
| 2003 | .741 | 1.693 | .592 |
| 2004 | .526 | 1.300 | .403 |
| 2005 | .651 | -.031 | .760 |
| 2006 | .412 | -.458 | .550 |
| 2007 | -.047 | -1.347 | .157 |
| 2008 | -.055 | -1.726 | .204 |
| 2009 | .194 | -.033 | .228 |
| 2010 | .250 | -.695 | .392 |
| 2011 | .076 | -.543 | .168 |
| 2012 | .504 | .679 | .478 |
| Sources: U.S. Department of Education and U.S. Bureau of Labor Statistics. | |||
Students identified as having a disability under IDEA are categorized as having 1 of 13 types of disabilities. In 2009, the category into which most of these students (38 percent) fell was “students with a specific learning disability”42—a disorder in one or more of the basic psychological processes involved in understanding or in using language, spoken or written, that may manifest itself in an imperfect ability to listen, think, speak, read, write, spell, or do mathematical calculations.43 In 2005, public school students with disabilities saw their numbers fall, in part owing to a decline in the percentage of students identified with specific learning disabilities. Because 80 percent of students identified as having a learning disability are identified as such because they have difficulty learning to read, some experts attribute the decline in the number of public school students with disabilities to improvements in early reading intervention programs.44 Others argue that states began formally identifying fewer students with specific learning disabilities in reaction to the imposition of penalties by “No Child Left Behind” legislation for the failure of significant student subgroups to improve their test scores. By identifying fewer students with specific learning disabilities, these states could avoid creating a statistically reliable subgroup.45
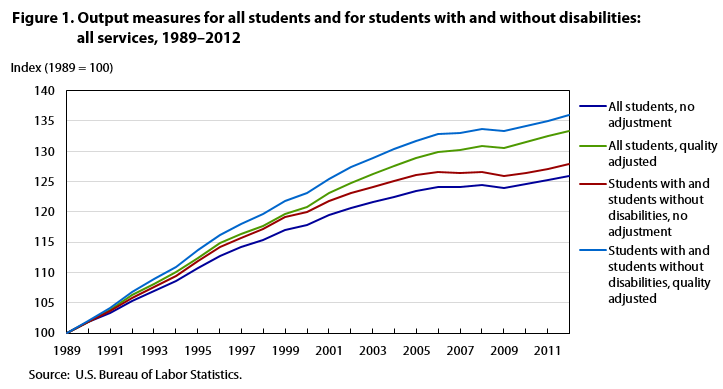
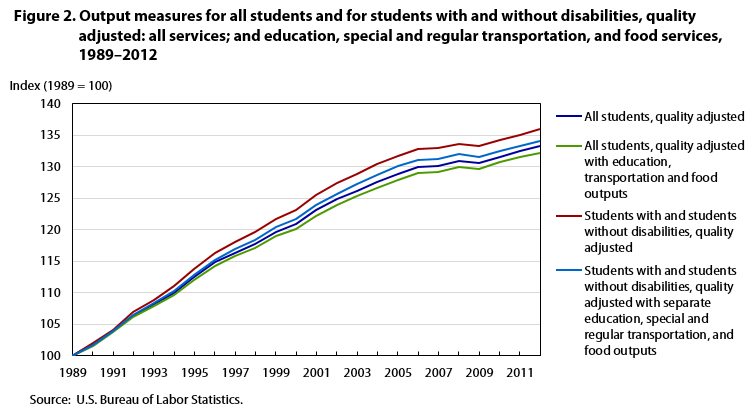
The unadjusted homogeneous output measure for “all students” and the unadjusted heterogeneous output measure for students with and without disabilities for the 1989–2012 period fall below the respective quality-adjusted measures, as shown in figure 1. Explicitly accounting for differences in education between students with and without disabilities, on the one hand, and “all students,” on the other, results in somewhat higher output on both an unadjusted and a quality-adjusted basis. Separately accounting for education, special and regular transportation, and food services results in slightly reduced output levels, a minor impact, as shown in figure 2.
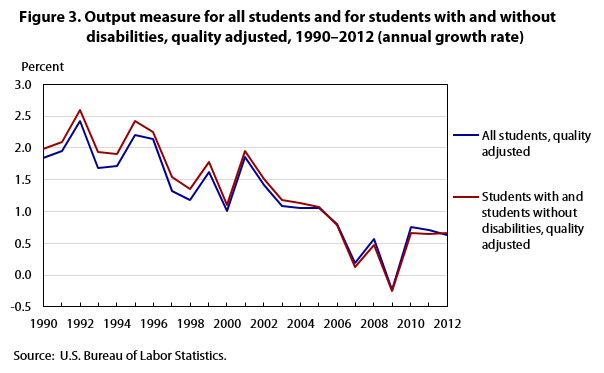
Measuring output by first constructing separate output measures for students with and without disabilities and then aggregating to total output with the use of expenditure weights captures the effects of variation in quality-adjusted outputs for those two categories of students over time. As shown in figure 3, quality-adjusted output based on the composite output measure for students with and students without disabilities, , grew at a faster annual rate than the quality-adjusted “all students” output measure, , prior to 2005 and at a similar annual rate from 2005 to 2012.
For the 1989–2012 period, as shown in table 3, quality-adjusted output constructed by combining separate quality-adjusted output measures for students with and without disabilities and using expenditure share weights ( grew more quickly than quality-adjusted output based on all students. For the subperiod 1990–2000, growth in this composite measure was above that of the “all students” measure,
  grew slightly more slowly than the “all students” measure.
| Period | All students | Students with and without disabilities, combined | ||||
|---|---|---|---|---|---|---|
| (no quality adjustment) | (quality adjusted) | (quality adjusted and separate education, transportation, and food services outputs) | (no quality adjustment) | (quality adjusted) | (quality adjusted and separate education, transportation, and food services outputs) | |
| 1.007 | 1.258 | 1.219 | 1.073 | 1.343 | 1.280 | |
| 1.478 | 1.724 | 1.681 | 1.653 | 1.898 | 1.800 | |
| .743 | 1.066 | 1.056 | .748 | 1.109 | 1.097 | |
| .288 | .484 | .455 | .218 | .440 | .413 | |
| Source: U.S. Bureau of Labor Statistics. | ||||||
As expected, the average annual growth rates of the quality-adjusted measures, and  are greater than those of the unadjusted measures, and . The average annual growth rates of the “all students” measure with explicit transportation and food services, , are slightly below, but still close to, those of the quality-adjusted “all students” measures, again illustrating that explicitly including total transportation and food services in the “all students” output measure is of limited value. Similarly, the average annual growth rate of is very close to the quality-adjusted measure for the composite output measure for students with and without disabilities, . Accordingly, explicitly accounting for special and regular transportation services, as well as food services, with the measure has little impact.
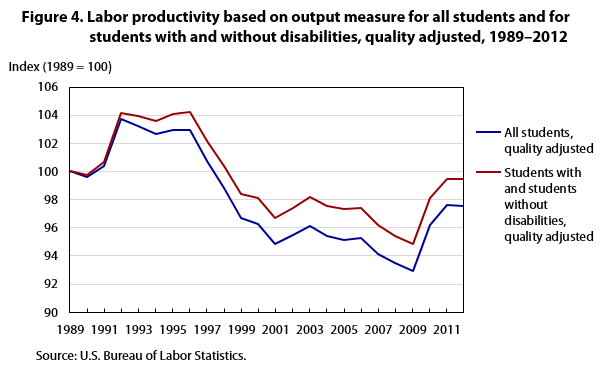
Measures of labor productivity, defined as output per unit of labor input, for public elementary and secondary schools and based on the quality-adjusted “all students” output measure and the quality-adjusted composite output measure for students with and without disabilities are presented in figure 4.46 Using the composite output measure for students with and without disabilities results in labor productivity indexes that are consistently greater than labor productivity based on the homogeneous “all students” output measure.
Labor productivity did not grow over the 1989–2012 period; in fact, it fell by –.024 percent, according to the composite output measure for students with and without disabilities, and by –.108 for the “all students” output measure . For the subperiod 1989–2005, labor productivity based on the composite output measure dropped by –.171 percent, and the decline was even greater, –.310 percent, with the homogenous “all students” output measure. For the 2005–12 subperiod, labor productivity grew, by .312 percent on the basis of and again by a greater .353 percent on the basis of . For the period 1990–2000, labor productivity decreased by –.17 percent by the composite output measure and by –.34 percent by the “all students” measure. Over the 2000–07 subperiod, labor productivity similarly declined, by . –279 percent according to the measure and, again, by a greater –.321 percent according to the measure. For the subperiod 2007–12, labor productivity grew, by .665 percent with the composite measure and .71 percent with the “all students” output measure.
All these results suggest that it is important to include information on the diverse educational services provided to public elementary and secondary school students in the education output measure in order to generate a measure that reflects historical changes in the mix, cost, quality, and growth of these services over time. For both students with and students without disabilities, substantial differences in the education services provided and in the relative costs of those services exist. However, students with disabilities made up only 11–13 percent of all public school students over the 1990–2012 period. Accounting for diversity in education services and expenditures provided to other groups, such as English language learners, would capture additional changes in services over time. Improving national data, such as expenditure data, on education services for English language learners would facilitate future analysis and improvements to the education output measure for public elementary and secondary schools.
Susan G. Powers, "Heterogeneous education output measures for public school students with and without disabilities," Monthly Labor Review, U.S. Bureau of Labor Statistics, September 2016, https://doi.org/10.21916/mlr.2016.42
1 Susan G. Powers and Steven Flint, “Labor productivity growth in elementary and secondary school services: 1989–2012,” Monthly Labor Review, June 2016, https://www.bls.gov/opub/mlr/2016/article/labor-productivity-growth-in-elementary-and-secondary-school-services.htm.
2 See, for example, Barbara M. Fraumeni, Marshall B. Reinsdorf, Brooks B. Robinson, and Matthew P. Williams, “Price and real output measures for the education function of government: exploratory estimates for primary and secondary education,” NBER Working Paper No. 14099 (Cambridge, MA: National Bureau of Economic Research, June 2008), http://www.nber.org/papers/w14099. In this paper, the authors summarize alternative measures of public sector education output that have been used in the international community. Having developed their own experimental estimates of public school education output in the United States for comparison, they find that, although many countries have experimented with various quality adjustments to education output measures, those countries often adopt a simple output measure, such as number of students enrolled or number of pupil hours taught, as their official education output measure.
3 The article focuses on public elementary and secondary schools because of the limited data available on private schools.
4 See Susan G. Powers, “Measuring education output in elementary and secondary schools: first steps” (unpublished paper, December 8, 2011), which compares U.S. Census Bureau data on the enrollment of all students in public and private schools with NCES enrollment data in respect of constructing quality-adjusted measures of output in public and private elementary and secondary schools. This paper is available on request from the author.
5 Private schools also may provide schooling for these groups. However, the majority of such students attend public schools.
6 Examples of disabilities covered under the Individuals with Disabilities Education Act are mental retardation; hearing impairment; speech or language impairment; visual impairment; serious emotional disturbance; orthopedic impairment; autism; traumatic brain injury; other health impairments, including limited strength, vitality, or alertness due to chronic or acute health problems; specific learning disabilities; and multiple disabilities, such as deaf–blindness. (For further information, see “Building the legacy: IDEA 2004” (U.S. Department of Education), http://idea.ed.gov.)
7 Rehabilitation Act of 1973, Pub. L. No. 93-112, September 26, 1973, https://archive.org/stream/publiclaw931129300unit#page/n1/mode/2up; Individuals with Disabilities Education Act Amendment of 1997, Pub. L. No. 108-446, December 3, 2004, https://www.congress.gov/108/plaws/publ446/PLAW-108publ446.pdf (based on the Education for All Handicapped Children Act, Pub. L. No. 94-142, November 29, 1975), https://www.govtrack.us/congress/bills/94/s6/text; and Americans with Disabilities Act, Pub. L. No. 101-336, July 26, 1990, https://www.congress.gov/bill/101st-congress/senate-bill/933/text/pp?q=%7B%22search%22%3A%5B%22americans+with+disabilities+act+1990%22%5D%7D&resultIndex=2.
8 “English-language learners,” Education Week, August 4, 2004, updated June 16, 2011.
9 Elementary and Secondary Schools Act of 1965, Pub. L. No. 89-10, April 11, 1965, https://federaleducationpolicy.wordpress.com/2011/02/19/1965-elementary-and-secondary-education-act/; Every Student Succeeds Act, Pub. L. No. 114–95, December 10, 2015, https://www.congress.gov/114/plaws/publ95/PLAW-114publ95.pdf.
10 Basic Grants provide funds to LEAs for which the number of schoolchildren counted in the formula is at least 10 and exceeds 2 percent of an LEA's school-age population. Concentration Grants flow to LEAs for which the number of schoolchildren counted in the formula exceeds 6,500, or 15 percent of the total school-age population. Targeted Grants are based on the same data used for Basic and Concentration Grants, except that the data are weighted so that LEAs with higher numbers or higher percentages of children from low-income families receive more funds. Targeted Grants flow to LEAs for which the number of schoolchildren counted in the formula (without application of the formula weights) is at least 10 and at least 5 percent of the LEA's school-age population. Education Finance Incentive Grants distribute funds to states on the basis of (1) factors that measure a state's effort to provide financial support for education compared with the state’s relative wealth as measured by its per-capita income and (2) the degree to which education expenditures among LEAs within the state are equalized. (See “Programs: improving basic programs operated by local educational agencies: (Title I, Part A)” (U.S. Department of Education, Oct. 5, 2015), https://oese.ed.gov/offices/office-of-formula-grants/school-support-and-accountability/title-i-part-a-program/.
11 LEAs also must use Title I funds to provide academic enrichment services to eligible children enrolled in private schools. (For further information, visit the U.S. Department of Education’s website, www.ed.gov.)
12 See “National School Lunch Program (NLSP)” (U.S. Department of Agriculture, published daily), https://www.fns.usda.gov/nslp.
13 Programs for English language learners receive both federal and state funding. Expenditure data on these programs are not available at a national level. Additional research to develop expenditure data for English language learners and low-income students may be undertaken in the future.
14 Digest of education statistics, table 204.30, “Children 3 to 21 years old served under Individuals with Disabilities Education Act (IDEA), Part B, by type of disability: selected years, 1976–77 through 2013–14” (U.S. Department of Education, Institute of Education Sciences, National Center for Education Statistics, 2015), https://nces.ed.gov/programs/digest/d15/tables/dt15_204.30.asp.
15 Digest of education statistics, table 204.60, “Percentage distribution of students 6 to 21 years old served under Individuals with Disabilities Education Act (IDEA), Part B, by educational environment and type of disability: selected years, fall 1989 through fall 2013” (U.S. Department of Education, Institute of Education Sciences, National Center for Education Statistics, 2015), https://nces.ed.gov/programs/digest/d15/tables/dt15_204.60.asp.
16 See “English language learner students in U.S. public schools: 1994 and 2000,” in Issue brief, NCES 2004–035 (U.S. Department of Education, Institute of Education Sciences, National Center for Education Statistics, August 2004), p. 1, http://nces.ed.gov/pubs2004/2004035.pdf; Digest of education statistics, table 204.20, “Number and percentage of public school students participating in programs for English language learners, by state: selected years, 2003–04 through 2013–14” (U.S. Department of Education, Institute of Education Sciences, National Center for Education Statistics, 2015), https://nces.ed.gov/programs/digest/d15/tables/dt15_204.20.asp; and Lauren Musu-Gillette, Jennifer Robinson, Xiaolei Wang, Amy Rathbun, Jijun Zhang, Sidney Wilkson-Flicker, Amy Barmer, and Erin Dunlop Velez, The condition of education 2015, NCES 2015-144 (U.S. Department of Education, Institute of Education Sciences, National Center for Education Statistics, May 2015), http://nces.ed.gov/pubs2015/2015144.pdf, especially p. 85.
17 Data on NAEP Long-Term Trend test scores are used to quality adjust this measure.
18 Enrollment data for public school students are obtained from the National Center for Education Statistics (NCES) of the U.S. Department of Education and consist of the number of enrolled public school students in grades K–12 as well as students who are ungraded.
19 Digest of education statistics, table 236.90, “Students transported at public expense and current expenditures for transportation: selected years, 1929–30 through 2012–13” (U.S. Department of Education, Institute of Education Sciences, National Center for Education Statistics, 2015), https://nces.ed.gov/programs/digest/d15/tables/dt15_236.90.asp.
20 School lunch data are obtained from the U.S. Department of Agriculture, National School Lunch Program.
21 National Public Education Financial Survey (U.S. Department of Education, National Center for Education Statistics, Common Core of Data (CCD)), https://nces.ed.gov/ccd/stfis.asp. Note that, for educational services, the expenditure share weight is calculated as total expenditures less expenditures for transportation and food services.
22 U.S. Department of Education, Digest of education statistics, table 204.30.
23 See What are we spending on transportation services for students with disabilities, 1999-2000? Report 3, Special Education Expenditure Project, prepared under the auspices of the U.S. Department of Education, Office of Special Programs (American Institutes for Research, Center for Special Education Finance, November 2002); M. T. Moore, E. W. Strang, M. Schwartz, and M. Braddock, Patterns in special education service delivery and cost (Washington, DC: Decision Resources Corp., 1988); and U.S. Department of Education, National Public Education Financial Survey.
24 Data on the percentage of students served in 1989 under IDEA are obtained from the Digest of education statistics, table 52, “Children 3 to 21 years old served in federally supported programs for the disabled, by type of disability: selected years, 1976–77 to 2001–02” (U.S. Department of Education, Institute of Education Sciences, National Center for Education Statistics, 2003), https://nces.ed.gov/programs/digest/d03/tables/dt052.asp; similar data for 1980 and 1990–2013 are obtained from U.S. Department of Education, Digest of education statistics, table 204.30. Data for the years 1981 through 1988 are interpolated.
25 Digest of education statistics (National Center for Education Statistics, 2001 and 2010).
26 The Main NAEP Assessments occur at grades 4, 8, and 12 every 2 years in various subjects. Mathematics assessment data for grades 4 and 8 are available for 1990, 1992, 1996, 2000, 2003, 2005, 2007, and 2009; data for grade 12 are available only for 2005 and 2009. Reading assessment data are available for 1992, 1994, 1998, 2000, 2002, 2004, 2005, 2007, and 2009. Other subjects assessed are the arts, civics, economics, foreign languages, geography, science, technology and engineering literacy, U.S. history, world history, and writing. However, the number of years of available assessment data for these additional subjects is limited.
27 See “More about the NAEP Long-Term Trend Assessment,” in National Assessment of Educational Progress (NAEP) (National Center for Education Statistics, June 25, 2013), http://nces.ed.gov/nationsreportcard/ltt/moreabout.asp.
28 NCES and the National Assessment Governing Board have established participation rate standards that states and jurisdictions are required to meet in order to have their results published. The weighted participation rate for the initial school sample must be greater than or equal to 85 percent for results to be published. Prior to 2003, the requirement was 70 percent. For further information on participation rate requirements, see “Participation rate requirements,” in National Assessment of Educational Progress (NAEP) (National Center for Education Statistics, September 3, 2012), http://nces.ed.gov/nationsreportcard/about/participrates.asp.
29 See “About national NAEP,” in National Assessment of Educational Progress (NAEP) (National Center for Education Statistics, December 30, 2009), https://nces.ed.gov/nationsreportcard/about/.
30 See U.S. Department of Education, “More about the NAEP Long-Term Trend Assessment.”
31 Individuals with Disabilities Education Improvement Act of 2004, Pub. L. No. 108-446, December 3, 2004, https://www.congress.gov/108/plaws/publ446/PLAW-108publ446.pdf.
32 NAEP 2004 trends in academic progress: three decades of student performance in reading and mathematics, NCES 2005-464 (National Center for Education Statistics, July 2005), http://nces.ed.gov/pubsearch/pubsinfo.asp?pubid=2005464, especially p. 103. (See also “Inclusion of special-needs students,” in National Assessment of Educational Progress (NAEP) (National Center for Education Statistics, July 7, 2014), http://nces.ed.gov/nationsreportcard/about/inclusion.asp.
33 NAEP LTT test scores of only students with disabilities and of only students without disabilities in public and private schools combined are used in these estimates because the representative sample of schools does not allow for separate publication of test scores of the two groups of students for public schools versus private schools. For the categories “students with disabilities” and “students without disabilities,” the test scores drawn from all public and private schools combined are typically slightly higher than those for public schools only.
34 Data on the number of students transported are obtained from the following publications from the U.S. Department of Education, National Center for Education Statistics: Statistics of state school systems, 1929–30 through 1975–76, and Revenues and expenditures for public elementary and secondary education, 1977–78 and 1979–80; and from the following sources: Common Core of Data (CCD), National Public Education Financial Survey, 1987–88 through 2007–08; Bobit Publishing Co., “School transportation: 2000–2001 school year,” in School bus fleet, and 2010 fact book; and “K–12 enrollment/transportation data,” in School transportation news, 2001–02 through 2007–08; and unpublished data. Data on transportation expenditures are obtained from Common Core of Data (CCD), National Public Education Financial Survey, as published in the Digest of education statistics.
35 Data on the percentage of students with disabilities who receive special transportation are obtained from What are we spending on transportation services for students with disabilities, 1999–2000?, Report 3 (U.S. Department of Education, Office of Special Education Programs, November 2002); and from Moore, Strang, Schwartz, and Braddock, Patterns in special education. Both studies provide data on the percentage of students with disabilities who received special transportation in 1985 and 1999. This percentage is interpolated for 1986 through 1998 on the basis of the data for 1985 and 1989, respectively, and is held constant for 2000–07.
36 Data on food services are obtained from the U.S. Department of Agriculture National School Lunch Program and the U.S. Department of Education. Data on total expenditures for food services are obtained from Common Core of Data (CCD), National Public Education Financial Survey, as published in the Digest of education statistics.
37 See equation (8).
38 The output measure is composed of quality-adjusted output of students with disabilities, quality-adjusted output of students without disabilities, regular transportation services, special transportation services, and food services, and is constructed with the use of expenditure share weights for each type of output.
39 I used data from Common Core of Data (CCD), National Public Education Financial Survey; Moore, Strang, Schwartz, and Braddock, Patterns in special education; and U.S. Department of Education, What are we spending?.
40 Total expenditures for students with disabilities, 1999–2000: spending variation by disability, Report 5, study prepared under the auspices of the U.S. Department of Education, Office of Special Education Programs (American Institutes for Research, Center for Special Education Finance, June 2003).
41 Data on the per-pupil cost of providing special education transportation services for 1985 and 1999 are obtained from Moore, Strang, Schwartz, and Braddock, Patterns in special education, and U.S. Department of Education, What are we spending?. The per-pupil cost of special education transportation services is obtained by interpolation for 1986–98 and held at the 1999 value for 2000–07.
42 “Christina A. Samuels, “Boom in learning disabled enrollment ends,” Education Week, vol. 30, no. 3, September 15, 2010.
43 Ibid.
44 Ibid.
45 See Candace Cortiella, The state of learning disabilities (New York: National Center for Learning Disabilities, 2011).
46 Data on labor input for public elementary and secondary schools are obtained from the U.S. Bureau of Labor Statistics.