An official website of the United States government
An official website of the United States government
The .gov means it's official.
Federal government websites often end in .gov or .mil. Before sharing sensitive information,
make sure you're on a federal government site.
The site is secure.
The
https:// ensures that you are connecting to the official website and that any
information you provide is encrypted and transmitted securely.

The Bureau of Labor Statistics Consumer Expenditure Surveys (CE) program conducts surveys that provide data to produce average and total annual consumer expenditure estimates for a variety of goods and services at the national level. These estimates are produced by assigning a population weight to each interviewed consumer unit; this tells us how many other households that consumer unit represents. A consumer unit differs slightly from a household. That is, a household comprises the physical dwelling in which a consumer unit may live. In contrast, a consumer unit comprises either: (1) all members of a particular household who are related by blood, marriage, adoption, or other legal arrangements; (2) a person living alone or sharing a household with others or living as a roomer in a private home or lodging house or in permanent living quarters in a hotel or motel, but who is financially independent; or (3) two or more persons living together who use their income to make joint expenditure decisions. The sum of the CE population weights is designed to equal the total U.S. population of consumer units.1
The CE national weight is calibrated to produce representative estimates of the population for several subnational geographies (e.g., census region, some metropolitan statistical areas) but since the surveys’ inception, it has never been calibrated to represent state level populations. Recently, CE has investigated the possibility of designing a supplemental weight, computed separately from the national weight, which could apply to interviewed consumer units in specific states.
This Beyond the Numbers article focuses on how New Jersey consumers allocate spending among the components of the market basket of total spending, and how their spending pattern differs from that of consumers at national and subnational geographies. By comparing expenditure data from the CE in conjunction with the state weights for New Jersey, the article explore economic questions related to the state. This is the first in a series of new experimental state weights that CE is producing for public use and making available with the public-use microdata. In addition, it examines spending on one of the largest components of the consumer market basket—housing—in greater depth for both New Jersey and the nation. All of the data used for the proceeding analysis are from the public-use microdata, meaning they will differ slightly from the published estimates due to confidentiality edits.
Data users have long communicated a need for state-level expenditure estimates to conduct policy analysis that is state specific using the CE data. Due to the CE’s relatively small sample size, only a handful of states have representation in the sample that is capable of supporting a state-level weight. Coverage is the most important criterion for determining if a state weight can reasonably be created. Large, sufficient samples can be drawn from the self-representing primary sampling units (PSU) (i.e. large geographic areas that are always sampled from) that some states’ geographies are covered by. This allows the reweighting of their sampled population to be representative of that state. Each consumer unit is assigned a number that represents other non-sampled consumer units in that state—that consumer unit’s state weight. That consumer unit also has a national weight, meaning the number of consumer units that consumer unit represents across the entire nation. When the weight for all consumer units sampled is added up, you will have the target population of the state. The target population is sourced from the Census Bureau. In addition, these values are calibrated to the socioeconomic characteristics available in the survey. This means the weight also includes the target populations for race, gender, household composition, etc.
Of all the eligible states, New Jersey was a natural first choice, due to its geographical boundary being almost entirely covered by self-representing metropolitan statistical areas (MSAs). Specifically, the New York MSA and the Philadelphia MSA include almost every county in the state. The CE public-use microdata already provide a state-level identifier in the data; however, that identifier is only useful for computing sample estimates as opposed to nationally weighted values for that state if enough consumer units happen to be sampled.2 With these new state weights, robust statistical inferences can be drawn about state-level expenditure and income estimates.
All consumer units sampled in New Jersey also reside in either the New York MSA or Philadelphia MSA. Weighted expenditure estimates for these MSAs are computed using the national weight. The New Jersey state weights, if operating appropriately when applied with expenditures, should produce estimates similar to these MSAs because they share a large percentage of the same consumer units. Table 1 provides evidence that the New Jersey state weights appear to perform as expected. These sorts of internal consistency checks are important for determining the statistical validity of any new data product.
| Categories | New York MSA(1) | Philadelphia MSA(1) | New Jersey(2) |
|---|---|---|---|
|
Total expenditures |
$65,764 | $60,504 | $63,099 |
|
Food |
9,190 | 8,649 | 8,641 |
|
Housing |
24,308 | 20,047 | 23,617 |
|
Apparel |
1,645 | 1,119 | 1,491 |
|
Transportation |
6,828 | 8,188 | 7,295 |
|
Healthcare |
4,260 | 4,800 | 5,239 |
|
Entertainment |
2,277 | 2,496 | 2,097 |
|
Education |
2,171 | 2,081 | 2,182 |
|
(1) Nationally weighted estimates. (2) State weighted estimates. Note: Not all expenditure categories are reported in this table. Source: U.S. Bureau of Labor Statistics, Consumer Expenditure Surveys Public-Use Microdata. |
|||
In addition to ensuring that state-weighted estimates are consistent with existing data products from CE data, the CE program assessed these state-weighted estimates with estimates from external data sources so that they are conceptually comparable to CE data. Every year, the CE program compares estimates of several key expenditure categories with estimates from the American Community Survey (ACS).3 The ACS is a useful comparison target because it is also a national representative household survey with the added benefit of already being calibrated at the state level. Due to differences in questionnaire design, scope, and coverage, the estimates will not match exactly with those from the ACS, but the values are reasonably comparable. The ACS samples in each individual state, so it is possible to compare state-weighted estimates from CE with ACS values.
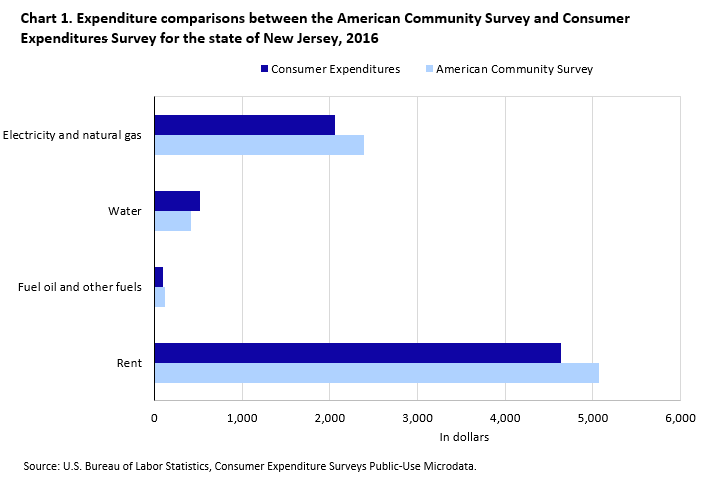
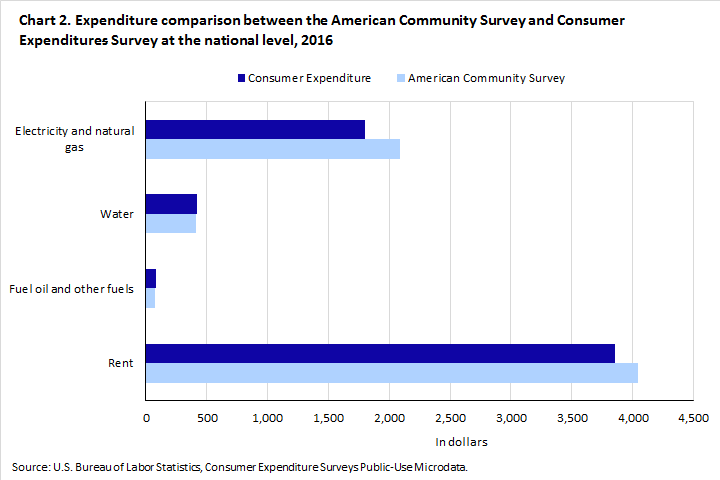
The actual expenditure values between the two surveys are not useful for comparison but rather how different they are. This can be measured with a ratio of the two expenditure values from each survey. The closer the CE–ACS ratio is to 1, the more similar the estimates from the two surveys are. Ideally, the New Jersey state weight will produce CE estimates that vary from the ACS New Jersey numbers to the same degree as the CE national estimates vary from the ACS national estimate. Generally, the results of the New Jersey CE–ACS comparison are similar to those from the national CE–ACS comparison. The CE–ACS ratio for rent in New Jersey is 0.91, whereas the same ratio for the nation as a whole is 0.95. Electricity and natural gas expenditures are at a ratio of 0.86 in both New Jersey and the nation. The results of the comparisons for those key expenditure items are presented in charts 1 and 2 below. To visualize the ratio for each category, the expenditure amounts are presented.
Chart 1 above shows the average annual expenditures for the state of New Jersey on four comparable categories between Consumer Expenditure Survey data and American Community survey data. In each of the four presented categories, the expenditures are all relatively close to each other. With the exception of water, CE tends to underestimate ACS. However, these comparisons are only useful in comparing the efficacy of the CE New Jersey Weight to the ACS New Jersey weight if the relationship between the CE national weight and the ACS national weight is understood. As such, the four categories are compared below in chart two for the national level showing similar differences at the broader geography. Overall, because the New Jersey weight causes differences from ACS that are similar in magnitude to the National weight differences from ACS then the weight is performing as expected.
Do urban consumers in New Jersey spend more on housing expenditures than U.S. urban consumers? State weight analysis can help answer this question. By using the weight, is possible to create a market basket of goods and services that New Jersey consumers are purchasing. In order to do this, the data are divided into categories of expenses and the shares of the total that each of these expenses makes up help the CE data user understand what U.S. consumers are spending their money on. Deciding how to divide up expenses is a non-trivial exercise. For the purposes of this analysis, the major item categories were selected to match the item categories the Consumer Price Index (CPI) uses in the national market basket. The larger the share the higher the ‘relative importance’ of the item is to the market basket compared to the other items in the basket.4 The New Jersey market basket for 2016 can be approximated reasonably from the shares of total weighted expenditures.5
The resulting market basket presented below may not be reflective of one’s individual purchasing experience.6 This is because any particular household’s market basket may differ significantly from that of the average U.S. urban household. Table 2 shows the weighted shares of total expenditures by major item category for both New Jersey and the nation.
| Categories | New Jersey shares | National shares | Absolute difference |
|---|---|---|---|
|
Food and beverages |
0.12 | 0.13 | 0.01 |
|
Housing |
0.39 | 0.33 | 0.06 |
|
Apparel |
0.03 | 0.03 | 0.00 |
|
Transportation |
0.12 | 0.16 | 0.04 |
|
Medical care |
0.09 | 0.08 | 0.01 |
|
Recreation |
0.04 | 0.05 | 0.01 |
|
Education(1) |
0.04 | 0.02 | 0.02 |
|
Other goods and services |
0.19 | 0.20 | 0.01 |
|
(1) The CPI category is ‘Education and communication,’ for clarity only education is included here and communication is placed in ‘Other goods and services.’ Source: U.S. Bureau of Labor Statistics, Consumer Expenditure Surveys, CPI shares of relative importance. |
|||
It is clear that consumers in New Jersey differ from the average U.S. urban consumer, as shares for several key components of the market basket, most notably housing, differ by several percentage points. This type of holistic analysis at spending patterns allows users to answer very general questions like the one posited at the beginning of this section. In the next section, housing is explored in greater depth as being the largest difference in spending patterns between New Jersey and U.S. households.
New Jersey is a unique state. Much of the landmass of the state is covered with the metropolitan sprawl of neighboring New York City and Philadelphia city centers. This results in a large population being packed into a comparatively small landmass. According to the 2010 Census, the state of New Jersey has the highest population density of any state at 467.2 persons per square kilometer. With such a large number of people living in a small space, New Jersey has a comparatively high demand for housing, and thus, living costs are higher in New Jersey, compared with national and subnational estimates.
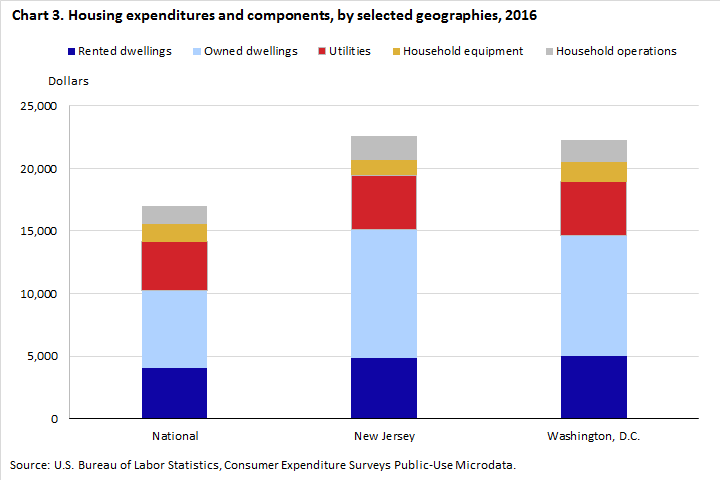
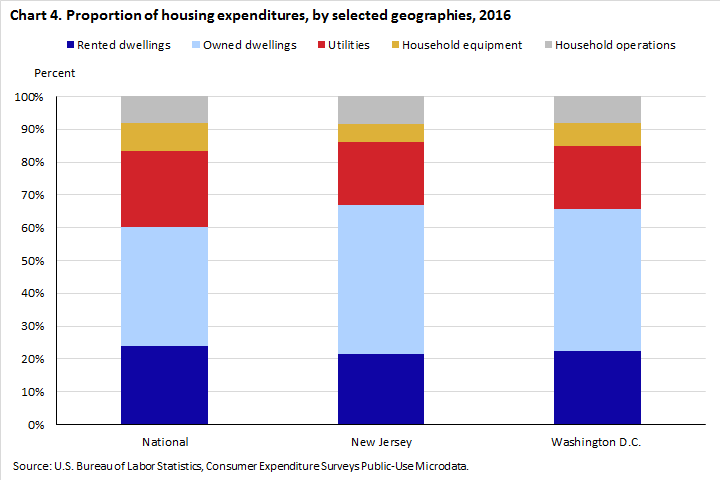
According to the Census Bureau, New Jersey has ranked consistently as one of the most expensive places to buy a home for over half a century.7 Lower income families, whose housing costs mostly consist of monthly rent payments, are not insulated from the effect of higher home prices in the state, as these prices translate into higher rents so that landlords are able to cover their debt service payments. Chart 3 shows that costs for owned dwellings in New Jersey outpace other selected geographies. In addition, with the exception of San Francisco, New Jersey has the highest owned-dwelling expenditure compared to any MSA in absolute amount. Average rent for a dwelling in New Jersey is slightly lower than that for Washington, D.C., but higher than the national average by 21 percent. Looking at these figures as a percentage of total housing in each geography, users can equalize the relative cost of rent. Chart 4 shows that owned-dwellings expenditures still make up a larger proportion of total housing for the state of New Jersey than for Washington, D.C. or the nation as a whole.8 Owned-dwellings are 46% of total housing for New Jersey. Even San Francisco, is lower than this amount at 36% of total housing even if their absolute amount is higher. As a direct result, the proportion of total housing expenditures consisting of rent is higher nationally than that for either New Jersey or Washington, D.C.
Overall, the New Jersey state weights perform well on quality metrics like internal consistency and external validity. Estimates produced with the New Jersey state weights are consistent with internal data sources and perform favorably with external data sources. They add additional power to CE data by allowing users to explore economic conditions in the state. New Jersey consumers allocate a larger share of total expenditures to housing than the national average and expenditures on owned dwellings make up a larger proportion of housing expenditures in New Jersey compared with the national average. The results from an analysis of housing expenditures seem consistent with economic hypotheses about the state. More of this kind of research is forthcoming as CE explores the quality of the weights when the data are used in more rigorous statistical analyses. Looking forward, the CE program intends to publish the New Jersey weights annually in an experimental non-production capacity, and investigate other states as candidates for weight creation. These weights will remain experimental because there are no plans to place them into production capacity in the foreseeable future. Presently, the weights are used and evaluated by the public and other Bureau of Labor Statistic (BLS) researchers. Eventually, researchers will be able to examine the effects of economic shocks over time for these states and test more detailed hypotheses.
This Beyond the Numbers article was prepared by Taylor J. Wilson, Economist in the Information and Analysis Section, Office of Prices and Living Conditions, Email: Wilson.Taylor@bls.gov, telephone: (202) 691-6550.
Upon request, the information in this article will be made available to individuals who are sensory impaired. Voice phone: (202) 691-5200. Federal Relay Service: 1-800-877-8339. This article is in the public domain and may be reproduced without permission.
Taylor J. Wilson, “Consumer spending by state: BLS puts New Jersey to the test ,” Beyond the Numbers: Regional Economies, vol. 7, no. 2 (U.S. Bureau of Labor Statistics, March 2018), https://www.bls.gov/opub/btn/volume-7/consumer-spending-by-state-bls-puts-new-jersey-to-the-test.htm
1 For more information about population totals and state weights documentation, see https://www.bls.gov/cex/stateweights-documentation.pdf.
2 For more information about microdata and how to obtain these data that is available, see https://www.bls.gov/cex/pumd.htm.
3 For more information about comparisons between the American Community Survey and Consumer Expenditure Survey, see https://www.bls.gov/cex/cecomparison.htm#ACS.
4 Relative importance of item groups are obtained from the most recent 2 years of the Consumer Expenditure Survey and are the proportion of total expenditures in the super-index area that come from an item group. For more information, see https://www.bls.gov/opub/hom/pdf/homch17.pdf.
5 For more information about the goods and services CPI covers, see https://www.bls.gov/cpi/questions-and-answers.htm#Question_7
6 For more information about how CPI measures price change, see https://www.bls.gov/cpi/questions-and-answers.htm#Question_5.
7 For more information about historic home values, see https://www.census.gov/hhes/www/housing/census/historic/values.html.
8 Owned-dwellings and rented-dwellings are the two components of housing. Owned-dwellings focuses on expenditures like mortgage interest and homeowner’s insurance where are rented dwellings consist primarily of rent and renter’s insurance, see https://www.bls.gov/cex/pumd/2016/csxintstub.txt.
Publish Date: Thursday, March 15, 2018