
An official website of the United States government
An official website of the United States government
The .gov means it's official.
Federal government websites often end in .gov or .mil. Before sharing sensitive information,
make sure you're on a federal government site.
The site is secure.
The
https:// ensures that you are connecting to the official website and that any
information you provide is encrypted and transmitted securely.
Work with agricultural scientists in plant, fiber, and animal research, or assist with animal breeding and nutrition. Set up or maintain laboratory equipment and collect samples from crops or animals. Prepare specimens or record data to assist scientists in biology or related life science experiments. Conduct tests and experiments to improve yield and quality of crops or to increase the resistance of plants and animals to disease or insects.
Employment estimate and mean wage estimates for Agricultural Technicians:
| Employment (1) | Employment RSE (3) |
Mean hourly wage |
Mean annual wage (2) |
Wage RSE (3) |
|---|---|---|---|---|
| 13,150 | 6.4 % | $ 22.50 | $ 46,810 | 1.0 % |
Percentile wage estimates for Agricultural Technicians:
| Percentile | 10% | 25% | 50% (Median) |
75% | 90% |
|---|---|---|---|---|---|
| Hourly Wage | $ 14.79 | $ 17.50 | $ 20.76 | $ 25.54 | $ 31.47 |
| Annual Wage (2) | $ 30,750 | $ 36,400 | $ 43,180 | $ 53,120 | $ 65,470 |
Industries with the highest published employment and wages for Agricultural Technicians are provided. For a list of all industries with employment in Agricultural Technicians, see the Create Customized Tables function.
Industries with the highest levels of employment in Agricultural Technicians:
| Industry | Employment (1) | Percent of industry employment | Hourly mean wage | Annual mean wage (2) |
|---|---|---|---|---|
| Scientific Research and Development Services | 2,540 | 0.28 | $ 21.47 | $ 44,660 |
| Colleges, Universities, and Professional Schools | 2,180 | 0.07 | $ 22.65 | $ 47,110 |
| Merchant Wholesalers, Nondurable Goods (4241, 4247, and 4249 only) | 1,410 | 0.26 | $ 24.12 | $ 50,170 |
| Management, Scientific, and Technical Consulting Services | 1,160 | 0.06 | $ 23.32 | $ 48,510 |
| Architectural, Engineering, and Related Services | 1,070 | 0.07 | $ 21.56 | $ 44,840 |
Industries with the highest concentration of employment in Agricultural Technicians:
| Industry | Employment (1) | Percent of industry employment | Hourly mean wage | Annual mean wage (2) |
|---|---|---|---|---|
| Support Activities for Animal Production | 780 | 2.43 | $ 20.29 | $ 42,210 |
| Farm Product Raw Material Merchant Wholesalers | 260 | 0.36 | $ 24.62 | $ 51,210 |
| Scientific Research and Development Services | 2,540 | 0.28 | $ 21.47 | $ 44,660 |
| Merchant Wholesalers, Nondurable Goods (4241, 4247, and 4249 only) | 1,410 | 0.26 | $ 24.12 | $ 50,170 |
| Pharmaceutical and Medicine Manufacturing | 430 | 0.13 | $ 18.44 | $ 38,360 |
Top paying industries for Agricultural Technicians:
| Industry | Employment (1) | Percent of industry employment | Hourly mean wage | Annual mean wage (2) |
|---|---|---|---|---|
| Other Miscellaneous Retailers | 150 | 0.03 | $ 31.82 | $ 66,180 |
| Dairy Product Manufacturing | 50 | 0.03 | $ 31.51 | $ 65,540 |
| Beverage Manufacturing | 70 | 0.02 | $ 29.41 | $ 61,160 |
| Machinery, Equipment, and Supplies Merchant Wholesalers | 30 | (7) | $ 28.96 | $ 60,250 |
| Management of Companies and Enterprises | 310 | 0.01 | $ 28.13 | $ 58,510 |
States and areas with the highest published employment, location quotients, and wages for Agricultural Technicians are provided. For a list of all areas with employment in Agricultural Technicians, see the Create Customized Tables function.
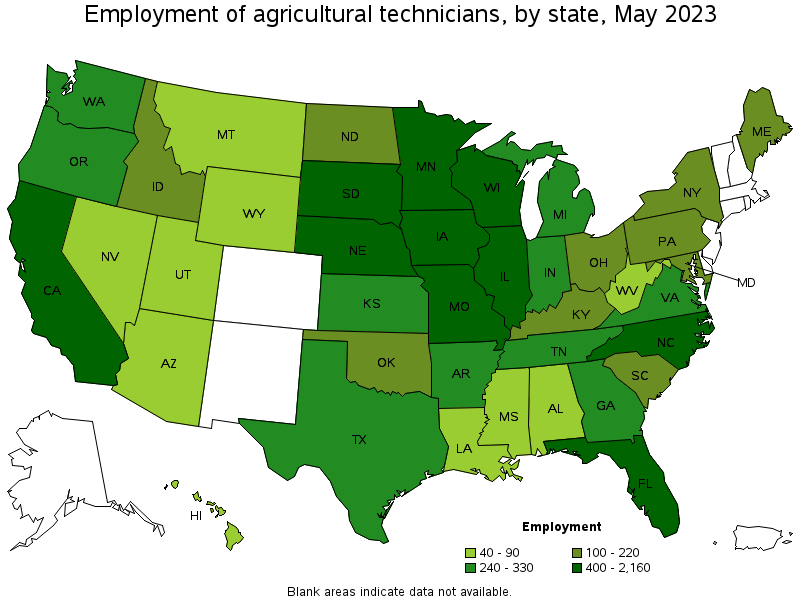
States with the highest employment level in Agricultural Technicians:
| State | Employment (1) | Employment per thousand jobs | Location quotient (9) | Hourly mean wage | Annual mean wage (2) |
|---|---|---|---|---|---|
| California | 2,160 | 0.12 | 1.39 | $ 22.83 | $ 47,490 |
| Iowa | 1,310 | 0.85 | 9.82 | $ 20.84 | $ 43,340 |
| Illinois | 610 | 0.10 | 1.17 | $ 22.63 | $ 47,070 |
| Nebraska | 540 | 0.54 | 6.24 | $ 21.91 | $ 45,560 |
| South Dakota | 480 | 1.08 | 12.49 | $ 18.83 | $ 39,160 |
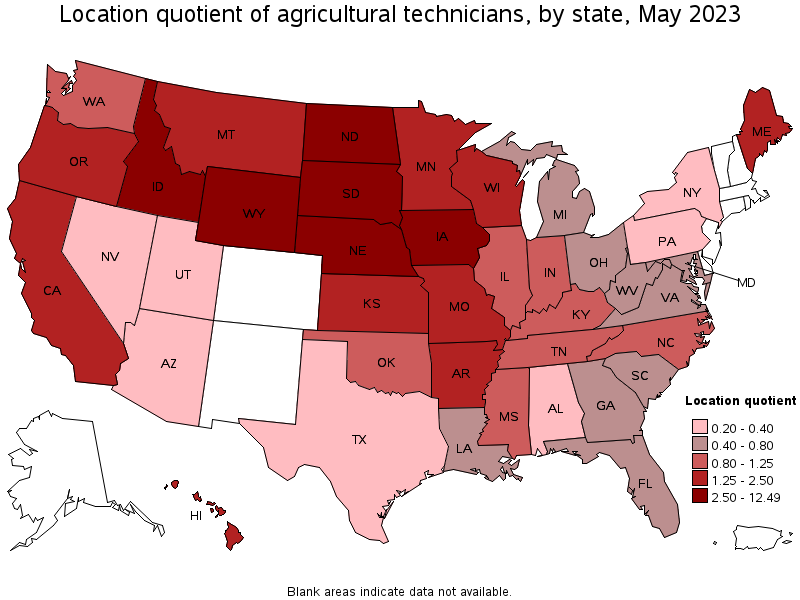
States with the highest concentration of jobs and location quotients in Agricultural Technicians:
| State | Employment (1) | Employment per thousand jobs | Location quotient (9) | Hourly mean wage | Annual mean wage (2) |
|---|---|---|---|---|---|
| South Dakota | 480 | 1.08 | 12.49 | $ 18.83 | $ 39,160 |
| Iowa | 1,310 | 0.85 | 9.82 | $ 20.84 | $ 43,340 |
| Nebraska | 540 | 0.54 | 6.24 | $ 21.91 | $ 45,560 |
| North Dakota | 140 | 0.33 | 3.83 | $ 23.82 | $ 49,550 |
| Idaho | 220 | 0.26 | 3.03 | $ 24.00 | $ 49,920 |
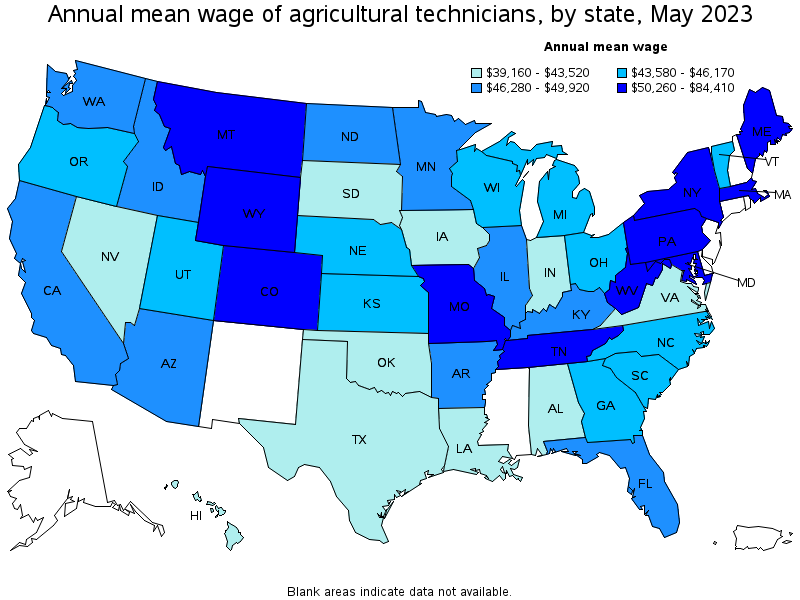
Top paying states for Agricultural Technicians:
| State | Employment (1) | Employment per thousand jobs | Location quotient (9) | Hourly mean wage | Annual mean wage (2) |
|---|---|---|---|---|---|
| Massachusetts | (8) | (8) | (8) | $ 40.58 | $ 84,410 |
| Wyoming | 60 | 0.22 | 2.56 | $ 29.89 | $ 62,160 |
| Maryland | 160 | 0.06 | 0.71 | $ 27.37 | $ 56,930 |
| Missouri | 400 | 0.14 | 1.62 | $ 26.91 | $ 55,980 |
| Colorado | (8) | (8) | (8) | $ 26.53 | $ 55,170 |
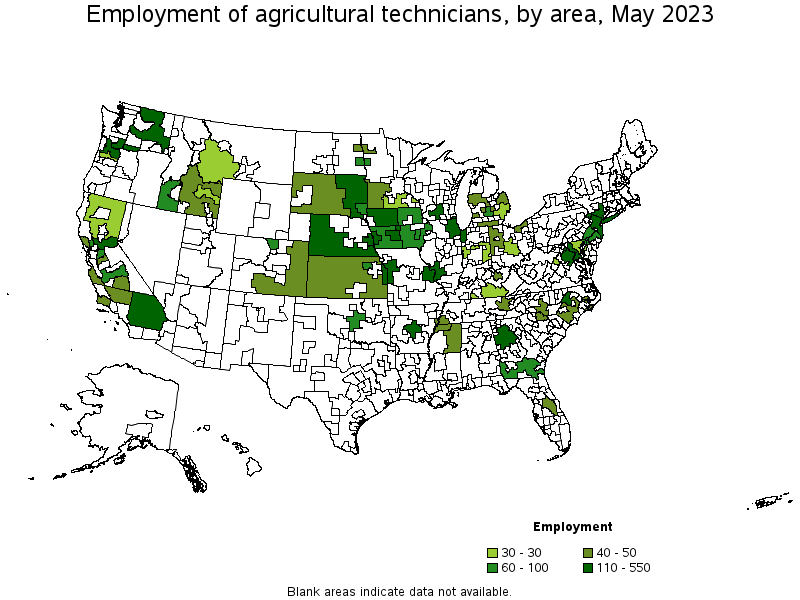
Metropolitan areas with the highest employment level in Agricultural Technicians:
| Metropolitan area | Employment (1) | Employment per thousand jobs | Location quotient (9) | Hourly mean wage | Annual mean wage (2) |
|---|---|---|---|---|---|
| Des Moines-West Des Moines, IA | 550 | 1.45 | 16.69 | $ 20.01 | $ 41,620 |
| New York-Newark-Jersey City, NY-NJ-PA | 450 | 0.05 | 0.55 | $ 21.76 | $ 45,250 |
| Raleigh, NC | 250 | 0.35 | 4.08 | $ 23.98 | $ 49,890 |
| Chicago-Naperville-Elgin, IL-IN-WI | 250 | 0.05 | 0.63 | $ 21.61 | $ 44,940 |
| Ames, IA | 230 | 4.95 | 57.16 | $ 23.62 | $ 49,140 |
| Madison, WI | 230 | 0.57 | 6.61 | $ 22.25 | $ 46,270 |
| Sacramento--Roseville--Arden-Arcade, CA | 200 | 0.19 | 2.18 | $ 23.24 | $ 48,330 |
| Kansas City, MO-KS | 130 | 0.12 | 1.35 | $ 27.50 | $ 57,190 |
| Little Rock-North Little Rock-Conway, AR | 120 | 0.36 | 4.10 | $ 23.43 | $ 48,740 |
| Washington-Arlington-Alexandria, DC-VA-MD-WV | 120 | 0.04 | 0.44 | $ 25.21 | $ 52,430 |

Metropolitan areas with the highest concentration of jobs and location quotients in Agricultural Technicians:
| Metropolitan area | Employment (1) | Employment per thousand jobs | Location quotient (9) | Hourly mean wage | Annual mean wage (2) |
|---|---|---|---|---|---|
| Ames, IA | 230 | 4.95 | 57.16 | $ 23.62 | $ 49,140 |
| Manhattan, KS | 90 | 2.34 | 27.05 | $ 21.63 | $ 45,000 |
| Des Moines-West Des Moines, IA | 550 | 1.45 | 16.69 | $ 20.01 | $ 41,620 |
| Grand Forks, ND-MN | 50 | 0.99 | 11.41 | $ 19.86 | $ 41,300 |
| Iowa City, IA | 80 | 0.89 | 10.33 | $ 22.92 | $ 47,660 |
| Napa, CA | 60 | 0.76 | 8.80 | $ 27.02 | $ 56,210 |
| Sioux Falls, SD | 100 | 0.60 | 6.91 | $ 19.25 | $ 40,030 |
| Madison, WI | 230 | 0.57 | 6.61 | $ 22.25 | $ 46,270 |
| Harrisonburg, VA | 30 | 0.50 | 5.79 | $ 20.72 | $ 43,100 |
| Fargo, ND-MN | 60 | 0.39 | 4.53 | $ 23.98 | $ 49,870 |
Top paying metropolitan areas for Agricultural Technicians:
| Metropolitan area | Employment (1) | Employment per thousand jobs | Location quotient (9) | Hourly mean wage | Annual mean wage (2) |
|---|---|---|---|---|---|
| St. Louis, MO-IL | 120 | 0.09 | 1.02 | $ 30.22 | $ 62,850 |
| Baltimore-Columbia-Towson, MD | 30 | 0.02 | 0.28 | $ 29.17 | $ 60,680 |
| Kansas City, MO-KS | 130 | 0.12 | 1.35 | $ 27.50 | $ 57,190 |
| Fort Collins, CO | 70 | 0.38 | 4.42 | $ 27.39 | $ 56,980 |
| Denver-Aurora-Lakewood, CO | (8) | (8) | (8) | $ 27.10 | $ 56,360 |
| Napa, CA | 60 | 0.76 | 8.80 | $ 27.02 | $ 56,210 |
| Salinas, CA | 50 | 0.29 | 3.37 | $ 25.64 | $ 53,340 |
| Washington-Arlington-Alexandria, DC-VA-MD-WV | 120 | 0.04 | 0.44 | $ 25.21 | $ 52,430 |
| Santa Rosa, CA | 50 | 0.24 | 2.76 | $ 24.76 | $ 51,500 |
| Orlando-Kissimmee-Sanford, FL | 40 | 0.03 | 0.38 | $ 24.65 | $ 51,270 |
Nonmetropolitan areas with the highest employment in Agricultural Technicians:
| Nonmetropolitan area | Employment (1) | Employment per thousand jobs | Location quotient (9) | Hourly mean wage | Annual mean wage (2) |
|---|---|---|---|---|---|
| East South Dakota nonmetropolitan area | 300 | 2.25 | 25.93 | $ 18.87 | $ 39,250 |
| South Nebraska nonmetropolitan area | 260 | 1.72 | 19.90 | $ 23.81 | $ 49,520 |
| Eastern Washington nonmetropolitan area | 130 | 1.29 | 14.93 | $ 24.04 | $ 50,010 |
| Northwest Iowa nonmetropolitan area | 110 | 0.81 | 9.33 | $ 19.55 | $ 40,660 |
| Southeast Iowa nonmetropolitan area | 100 | 0.45 | 5.23 | $ 20.54 | $ 42,710 |
Nonmetropolitan areas with the highest concentration of jobs and location quotients in Agricultural Technicians:
| Nonmetropolitan area | Employment (1) | Employment per thousand jobs | Location quotient (9) | Hourly mean wage | Annual mean wage (2) |
|---|---|---|---|---|---|
| East South Dakota nonmetropolitan area | 300 | 2.25 | 25.93 | $ 18.87 | $ 39,250 |
| South Nebraska nonmetropolitan area | 260 | 1.72 | 19.90 | $ 23.81 | $ 49,520 |
| Eastern Washington nonmetropolitan area | 130 | 1.29 | 14.93 | $ 24.04 | $ 50,010 |
| Southwest Iowa nonmetropolitan area | 70 | 0.83 | 9.54 | $ 18.88 | $ 39,260 |
| Northwest Iowa nonmetropolitan area | 110 | 0.81 | 9.33 | $ 19.55 | $ 40,660 |
Top paying nonmetropolitan areas for Agricultural Technicians:
| Nonmetropolitan area | Employment (1) | Employment per thousand jobs | Location quotient (9) | Hourly mean wage | Annual mean wage (2) |
|---|---|---|---|---|---|
| North Valley-Northern Mountains Region of California nonmetropolitan area | 30 | 0.33 | 3.83 | $ 29.82 | $ 62,020 |
| South Central Kentucky nonmetropolitan area | 30 | 0.19 | 2.21 | $ 29.58 | $ 61,520 |
| Southeast-Central Idaho nonmetropolitan area | 40 | 0.45 | 5.15 | $ 27.67 | $ 57,550 |
| Southwest Montana nonmetropolitan area | 30 | 0.20 | 2.33 | $ 24.71 | $ 51,390 |
| Eastern Washington nonmetropolitan area | 130 | 1.29 | 14.93 | $ 24.04 | $ 50,010 |
These estimates are calculated with data collected from employers in all industry sectors, all metropolitan and nonmetropolitan areas, and all states and the District of Columbia. The top employment and wage figures are provided above. The complete list is available in the downloadable XLS files.
The percentile wage estimate is the value of a wage below which a certain percent of workers fall. The median wage is the 50th percentile wage estimate—50 percent of workers earn less than the median and 50 percent of workers earn more than the median. More about percentile wages.
(1) Estimates for detailed occupations do not sum to the totals because the totals include occupations not shown separately. Estimates do not include self-employed workers.
(2) Annual wages have been calculated by multiplying the hourly mean wage by a "year-round, full-time" hours figure of 2,080 hours; for those occupations where there is not an hourly wage published, the annual wage has been directly calculated from the reported survey data.
(3) The relative standard error (RSE) is a measure of the reliability of a survey statistic. The smaller the relative standard error, the more precise the estimate.
(7) The value is less than .005 percent of industry employment.
(8) Estimate not released.
(9) The location quotient is the ratio of the area concentration of occupational employment to the national average concentration. A location quotient greater than one indicates the occupation has a higher share of employment than average, and a location quotient less than one indicates the occupation is less prevalent in the area than average.
Other OEWS estimates and related information:
May 2023 National Occupational Employment and Wage Estimates
May 2023 State Occupational Employment and Wage Estimates
May 2023 Metropolitan and Nonmetropolitan Area Occupational Employment and Wage Estimates
May 2023 National Industry-Specific Occupational Employment and Wage Estimates
Last Modified Date: April 3, 2024