An official website of the United States government
An official website of the United States government
The .gov means it's official.
Federal government websites often end in .gov or .mil. Before sharing sensitive information,
make sure you're on a federal government site.
The site is secure.
The
https:// ensures that you are connecting to the official website and that any
information you provide is encrypted and transmitted securely.
The Injuries, Illnesses, and Fatalities (IIF) program produces a wide range of information about workplace injuries and illnesses. These data are collected and reported annually through the Survey of Occupational Injuries and Illnesses (SOII) and the Census of Fatal Occupational Injuries (CFOI).
For information on nonfatal workplace injury and illness, see the most recently published industry data. See the latest industry incidence rates (OSHA recordable case rates), or calculate a firm's incidence rate by using BLS's incidence rate calculator. More information on calculating incidence rates.
Total nonfatal work injury and illness rates, private industry
Year
Total recordable cases
Cases involving days away from work, job restriction, or transfer
Other recordable cases
2018
2.8
1.6
1.3
2019
2.8
1.5
1.2
2020
2.7
1.7
1
2021
2.7
1.7
1.0
2022
2.7
1.7
1.0
Note: Components may not add to totals due to rounding. For more information on case types, please see our Handbook of Methods concepts page: https://www.bls.gov/opub/hom/soii/concepts.htm.
Total recordable cases:
2,804,200 in 2022
![]()
Cases involving days away from work:
1,184,200 in 2022
![]()
Median days away from work (DAFW):
10 in 2022
![]()
DAFW Cases involving sprains, strains, tears:
547,980 in 2022
![]()
DAFW Cases involving injuries to the back:
250,830 in 2022
![]()
DAFW Cases involving falls, slips, trips:
450,540 in 2022
![]()
Total fatal injuries (all sectors):
5,486 in 2022
![]()
Roadway incidents (all sectors):
1,369 in 2022
![]()
Falls, slips, trips (all sectors):
865 in 2022
![]()
Homicides (all sectors):
524 in 2022
![]()
12/19/2023
There were 5,486 fatal work injuries recorded in the United States in 2022, a 5.7-percent increase from 5,190 in 2021. The fatal work injury rate was 3.7 fatalities per 100,000 full-time equivalent (FTE) workers, up from 3.6 per 100,000 FTE in 2021.
HTML
|
PDF
|
RSS
|
Charts
11/08/2023
In 2022, employers reported 2.8 million injury and illness cases in private industry, up 7.5 percent from 2021. Injury cases increased 4.5 percent to 2.3 million, while illness cases increased by 26.1 percent to 460,700 cases in 2022.
HTML
|
PDF
|
RSS
|
Charts
The Census of Fatal Occupational Injuries data for 2022 are scheduled to be released on Tuesday, December 19, 2023 at 10:00 A.M. Eastern Time.
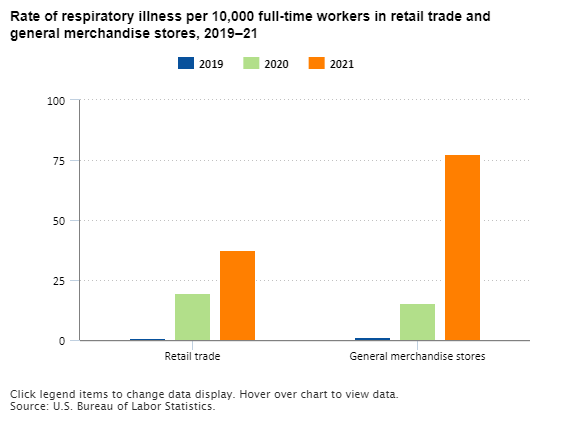
Respiratory illnesses in the retail trade sector rose 96.0 percent from 2020 (21,500 cases) to 2021 (42,100 cases). That drove a 75.6-percent increase in all illnesses (29,500 to 51,850). read more »

In 2020, fatalities caused by falls, slips, and trips accounted for 35.3 percent, (345 of 976) of the fatalities within construction and extraction occupations. Workers in construction and extraction occupations experienced 21,400 nonfatal workplace injuries and illnesses due to falls, slips, and trips. Of the 345 construction occupation fatalities from falls, 96 were experienced by construction laborers alone. read more »

This article explores the challenges associated with calculating occupational fatality rates in three high-risk occupations: firefighters, young farm workers, and police officers. read more »
In 2019, 5,333 people died as a result of injuries that occurred at work. Although some fatal injuries result in death on the same day, there are a substantial number of cases that have some latency, or delay between the date of injury and the date of death. This Beyond the Numbers article presents information on these latent cases. read more »