
An official website of the United States government
An official website of the United States government
The .gov means it's official.
Federal government websites often end in .gov or .mil. Before sharing sensitive information,
make sure you're on a federal government site.
The site is secure.
The
https:// ensures that you are connecting to the official website and that any
information you provide is encrypted and transmitted securely.
The National Compensation Survey (NCS) program's Employment Cost Index (ECI) tracks compensation costs for wages and salaries as well as benefits. Constant dollar estimates are current (nominal) costs that have been adjusted by the change in consumer prices in order to show the real compensation cost changes.
Constant dollar estimates have been adjusted in order to remove the changes in consumer prices from the ECI indexes. This is done to show real changes in compensation costs.1
In order to do this adjustment, the CPI-U must be converted to the same index base period as the ECI. The ECI is currently based on December 2005.2 The converted (re-based) CPI-U is calculated by dividing each period's CPI-U index number by the CPI-U index number for December 2005. The converted CPI-U indexes for each period are then divided into the respective period's current ECI index to derive the constant dollar ECI index. The CPI-U U.S. City Average for All Urban Consumers, All Items was used to adjust all ECI series except the regional index estimates which used corresponding CPI-U regional series.3
For example, the March 2022 non-seasonally adjusted constant dollar wages and salaries index for civilian workers was 102.4 and the current dollar index value was 149.6.
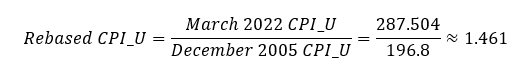
To compute the index value, first calculate the rebased CPI-U U.S. City Average for All Urban Consumers, All Items. This is done by dividing the March 2022 CPI-U of 287.504 by the December 2005 CPI-U of 196.800. (Series ID - CUUR0000SA0)
Then divide the March 2022 non-seasonally adjusted current dollar wages and salaries index for civilian workers which was 149.6 by the rebased CPI-U U.S. City Average for All Urban Consumers, All Items.

The estimates for the regions follow the same process but use different series. Table A below provides the CPI series codes for the 4 regions and the nation.
| Geographic areas | CPI monthly series |
|---|---|
|
National |
CUUR0000SA0 |
|
Northeast |
CUUR0100SA0 |
|
South |
CUUR0300SA0 |
|
Midwest |
CUUR0200SA0 |
|
West |
CUUR0400SA0 |
|
Source: Bureau of Labor Statistics, Consumer Price Index |
|
Constant dollar estimates are very useful because they can show the real change in compensation costs by removing changes in consumer prices from the ECI indexes. The importance of this is illustrated in Chart 1 below. Chart 1 depicts the index of wages and salaries for private industry workers in both current and constant dollars. It is clear that the current dollar estimate, and the constant dollar estimate tell two different stories. One tells how wages and salaries have changed in terms of a nominal value and the other tells how they have changed in the context of changing consumer prices. Inflation makes the current wages worth less and less as time goes on because it can buy less goods and services over time. The constant wages capture the wages given the change in purchasing power.
Chart 2 below gives a closer look at the change of these two series by looking at the 12-month percent change for each March release from March 2012 to March 2022. The current dollar estimates show positive increases in wages and salaries for the private industry during this time frame. The constant dollar estimates show positive increases for most years; however, these increases seem to be usually less than the current dollar estimates and there are even two points of negative decreases in wages and salaries.
To get a better understanding of what is going on in the 12-month constant dollar percent change for private industry workers in March 2022, the 3-month percent change can be examined for that 12-month period. Chart 3 below illustrates the 3-month percent change for the wages and salaries for private industry workers from March 2017 to March 2022 in current dollars and constant dollars. The 3-month percent change can be used to determine if the large 12-month percent change in March 2022 was an outlier or if this trend has been building through the preceding reference periods.
It is clear that current dollar estimates are very useful to observe the trends in compensation costs over time; however, constant dollar estimates give more insight into the context of those changes in compensation costs. The cost of the compensation could increase but the value of the cost could have decreased over time.
Constant dollar estimates are also available for different ownerships, occupations, industries, and characteristics such as bargaining status. Constant dollar estimates for different regions, census divisions, and metropolitan areas are also available for private industry.
These estimates are available through the public database. This data was previously only available in tables in PDF or TXT format. These publications have now been discontinued with the March 2022 reference period as the final update. They will be replaced with an excel file for the June 2022 release.
1 Constant dollar estimates are calculated by adjusting the current dollar indexes by the Consumer Price Index for all Urban Consumers (CPI-U).
2For more information about the ECI rebase look at Change is coming to the ECI.
3For more information about the CPI definitions look at the presentation section of the CPI Handbook of Methods.
Last Modified Date: June 16, 2022