An official website of the United States government
An official website of the United States government
The .gov means it's official.
Federal government websites often end in .gov or .mil. Before sharing sensitive information,
make sure you're on a federal government site.
The site is secure.
The
https:// ensures that you are connecting to the official website and that any
information you provide is encrypted and transmitted securely.

| February 2018
Everyone has likes and dislikes, even on the job. Maybe you’d be happiest having a regular, predictable schedule. Or perhaps you don’t want to lift heavy objects.
Whatever your work preferences, the U.S. Bureau of Labor Statistics (BLS) has a survey for you. The Occupational Requirements Survey (ORS) can help identify types of jobs that may—or may not—be a good match for your interests and abilities. This new survey highlights some of the conditions and demands that are typical in different occupations. Read on to learn more about the survey and how its data may help you in choosing a career.
In 2015, the BLS National Compensation Survey program began collecting occupational requirements data for the ORS. The first estimates were published in 2016 and 2017. BLS collects these data for the Social Security Administration, which plans to use them to help workers with disabilities.
The four categories of data from ORS are:
The tables in this article illustrate one requirement from each category, showing data by selected occupational groups.
The tables also show median annual wages in the selected groups, using data from the BLS Occupational Employment Statistics survey. Compare these data with $37,040, the median annual wage for all workers—half made more and half made less than this amount—in 2016. These wage data exclude the self-employed.
When looking at overall wages for a group of occupations, keep in mind that these wages are averages of the occupations in the group; wages for specific occupations may be higher or lower than the average. For example, the sales and related occupations group had a relatively low median wage overall, $26,590, but occupations such as wholesale and manufacturing sales representatives for technical and scientific products ($78,980) had much higher wages.
Identified in this category are some of the conditions workers might be exposed to in a job as it’s typically performed. These conditions include extreme heat or cold, hazardous contaminants, and outdoor work.
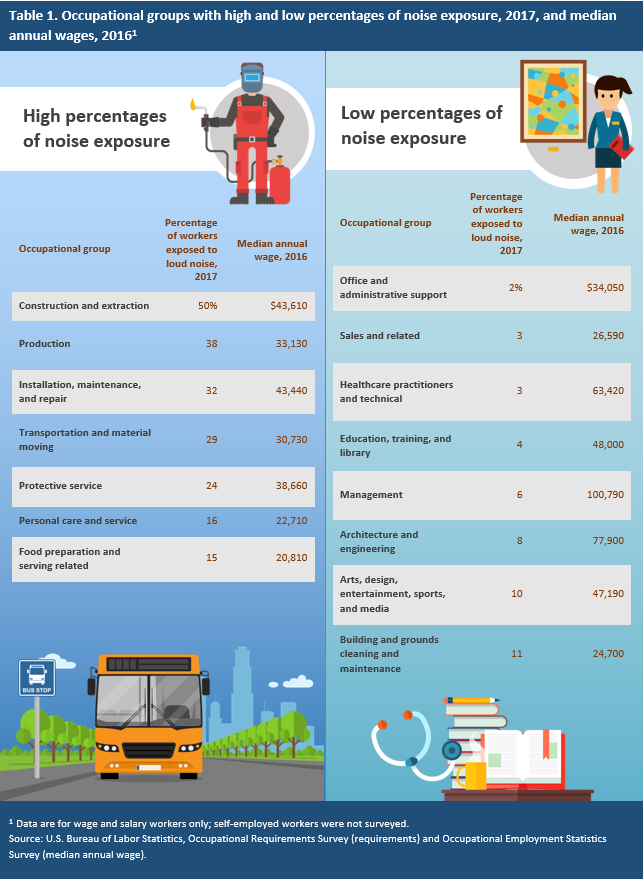
Some people are sensitive to noise, for example. These people might opt for a quiet job in an art museum, rather than a job with the loud intensity of bulldozing work. Table 1 shows selected occupational groups in which workers were, or were not, exposed to loud noises. About 13 percent of all workers were subject to this environmental condition in 2017.
The construction and extraction group and the installation, maintenance, and repair group had the highest wages among occupational groups with above-average exposure to loud noises: $43,610 and $43,440, respectively.
About half of all workers in construction and extraction occupations were subject to loud noises—the most of any occupational group. If you prefer working in quieter surroundings, you may want to avoid occupations such as construction equipment operators, carpenters, and welders.
An occupation’s cognitive requirements include the need to interact with others, make decisions, and adapt to changes.
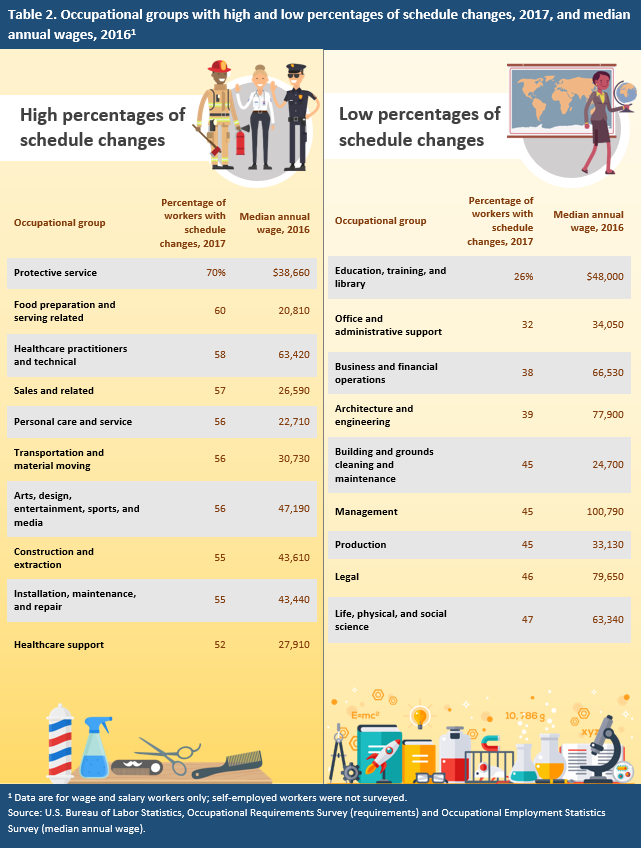
If you prefer to work a consistent schedule, for example, ORS data help to identify occupations that may let you do that—as well as to find those in which your schedule might frequently change. Table 2 shows the percentage of occupational groups in which schedule changes were more common or less common. In 2017, about 48 percent of all workers had jobs with changing schedules.
A number of the occupational groups with lower-than-average percentages of workers with schedule changes had above-average wages in 2016. Occupations in these higher paying groups also typically require a bachelor’s degree or more education.
About 3 out of 4 security guards had schedule changes—the most of any of the detailed occupations for which there were data in 2017. Home health aides and police patrol officers also topped the list.
Occupations in which relatively few workers had schedule changes were teacher assistants, general office clerks, and elementary school teachers.
This category assesses the physical effort generally required to successfully do work-related tasks. It includes requirements such as kneeling, lifting, and carrying.
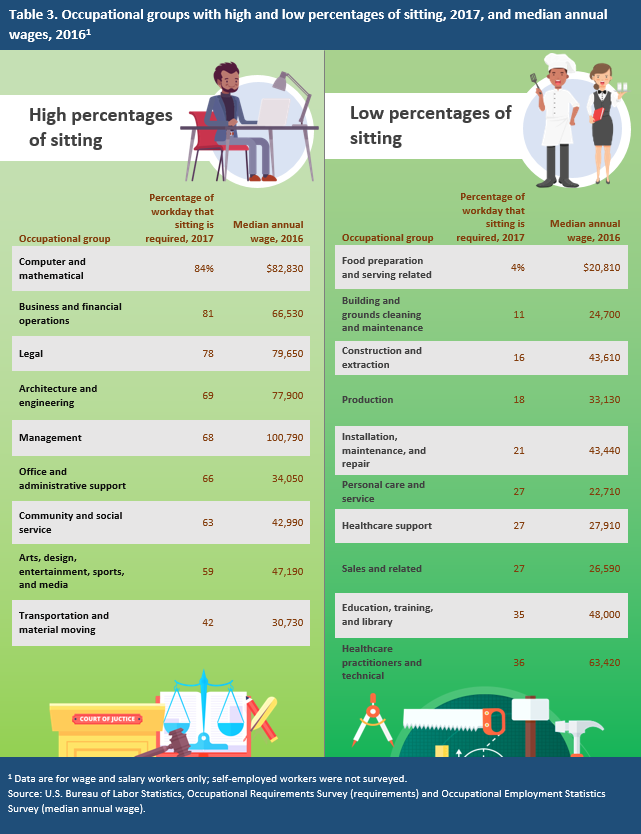
Maybe you know you don’t want to sit all day at work, for example, or maybe you’d prefer not to stand or move around. Table 3 shows, for selected occupational groups, the percentage of the workday in 2017 during which sitting was required. Workers, on average, spent about 40 percent of their day at work sitting.
Many of the occupational groups in table 3 include jobs that required sitting for extended lengths of time and also had relatively high wages. The level of education typically required to enter the occupations in these groups is often higher, too, with many employers requiring a bachelor’s or higher degree.
In specific occupations for which there are ORS data, telemarketers spent the largest portion of their day sitting—about 93 percent, on average. Combined food preparation and serving workers, including fast food workers spent the least, 2 percent.
For a mix of sitting and standing, consider light truck or delivery services drivers, driver/sales workers, and first-line supervisors of correctional officers. Jobs in these occupations required about equal amounts of time sitting and standing or moving around.
Data in this category provide information about the education level, work experience, and pre- and post-employment training required to prepare for an occupation.
To qualify for jobs in some occupations, for example, you might need pre-employment training. This type of training may lead to a credential—such as an educational certificate, license, or certification—or may be available in an apprenticeship. Table 4 shows the prevalence of pre-employment training in selected occupational groups. In 2017, about 28 percent of all workers needed some form of pre-employment training.
As table 4 shows, occupational groups with higher-than-average requirements of pre-employment training had varied wages. These ranged from a high of $79,650 for legal occupations to a low of $22,710 for personal care and service occupations.
Healthcare occupations had the highest percentages of workers who required training prior to employment. Many of the occupations in this group have specific licensing or certification requirements, which vary by state. Licensed practical and licensed vocational nurses, nursing assistants, and registered nurses were among those with the highest percentages of workers who need pre-employment training.
This article provides an overview of the many types of data available from the ORS. For more, visit the ORS website. Find summaries of requirements by occupational group at www.bls.gov/ors/factsheet/orsprofiles.htm.
You can get detailed descriptions of occupations, including specific work duties, job outlook, and more in the Occupational Outlook Handbook (OOH). Additional wage data are available from the BLS Occupational Employment Statistics program.
Elka Torpey, "Work that suits you: Using BLS data to match your preferences," Career Outlook, U.S. Bureau of Labor Statistics, February 2018.