An official website of the United States government
An official website of the United States government
The .gov means it's official.
Federal government websites often end in .gov or .mil. Before sharing sensitive information,
make sure you're on a federal government site.
The site is secure.
The
https:// ensures that you are connecting to the official website and that any
information you provide is encrypted and transmitted securely.

| February 2018
Did you use roads, electronics, or appliances today? Thank an engineer.
Engineers have a role in creating a variety of structures and products, from airports to zippers. If that sounds intriguing, consider a career in engineering. The U.S. Bureau of Labor Statistics (BLS) projects employment growth for these workers, with nearly 140,000 new jobs expected for engineers over the 2016–26 decade. And in 2016, engineers had a median annual wage of $91,010—more than twice the median wage for all workers.
Read on to see which engineering occupations are projected to have the most new jobs from 2016 to 2026 and which had the highest wages in 2016. You’ll also learn about the industries that employ engineers and the typical requirements for entering engineering.
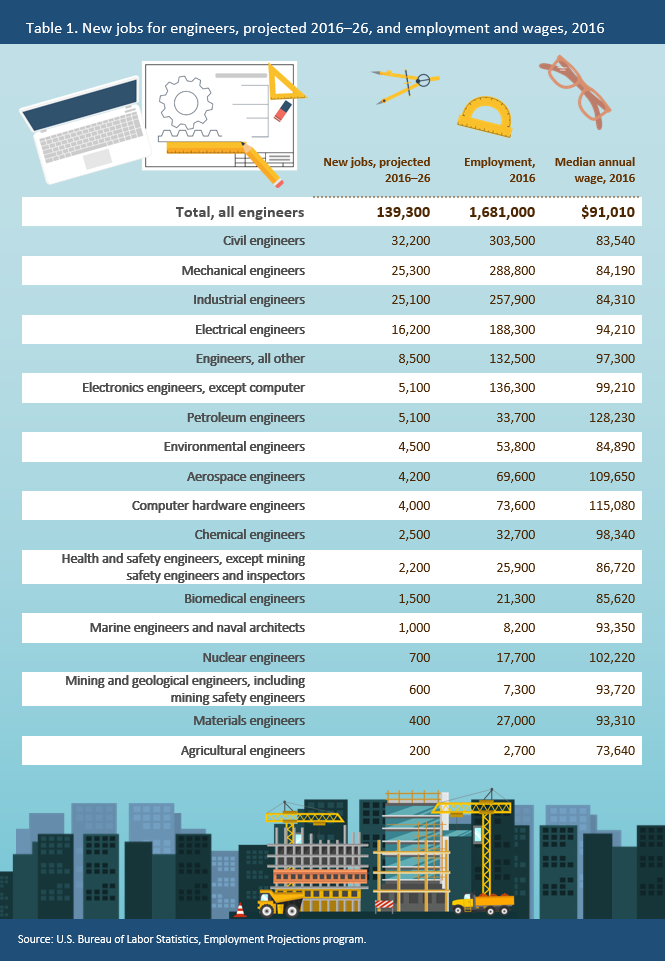
BLS prepares employment projections for 18 engineering occupations. Table 1 shows how many of the 139,300 jobs for engineers are expected to be added in each of these occupations from 2016 to 2026.
About 23 percent of new jobs for engineers are projected to be for civil engineers, the largest engineering occupation.
Mechanical and industrial engineers are second and third in projected job growth among engineers. Together, these two occupations accounted for about 36 percent of new jobs for engineers.
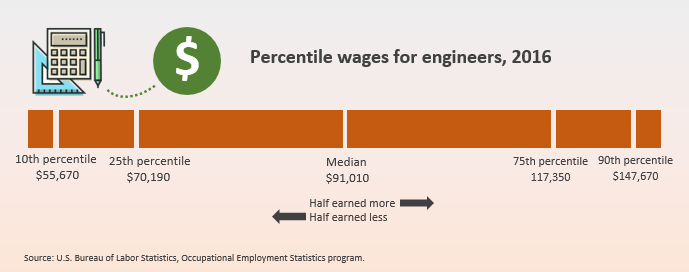
As table 1 also shows, median annual wages for engineers vary. A median wage is the 50th percentile: half of workers in the occupation made less than that amount, and half made more.
Percentiles show wage ranges within an occupation. For example, entry-level engineers, like entry-level workers in most occupations, usually earn less than the median; engineers with experience are likely to earn more. As the illustration shows, engineers at even the 10th percentile make $55,670—meaning that more than 90 percent of engineers have wages that are higher than the $37,040 median for all workers.
Chart 1 shows percentile wages for the top-paying engineering occupations in 2016. Petroleum engineers earned a median wage of $128,230 per year, the highest of all engineers. At the 90th percentile, these workers had an annual wage that was equal to or greater than $208,000, the top percentile wage for 2016 published by the BLS Occupational Employment Statistics program.
Manufacturing employed more than 578,000 engineers in 2016, the most of any industry. (See chart 2.) Within manufacturing, the largest number of jobs for engineers were related to the production of computer and electronic products, transportation equipment, and machinery.
All of the industries in the chart are projected to add jobs for engineers from 2016 to 2026. Of the industries shown, engineering services is projected to have the most new jobs—more than 54,000—over the decade.
Different industries employ different types of engineers. For example, the construction industry employs civil, electrical, and health and safety engineers to ensure that structures and systems are built correctly.
Hover over a bar in the chart to see the number of new jobs projected and the 2016 median annual wage for engineers in the industry. Click on a bar to see the engineering occupations with the most employment in the industry in 2016.
For entry-level engineering jobs, you typically must have a bachelor’s degree in an engineering discipline that’s related to the type of work you plan to do. Additional education or licensure, or both, may be needed for advancing in the occupation.
Getting practical experience while in college, such as by completing an internship or participating in a cooperative engineering program, also is recommended. But you can start to prepare for an engineering career as early as high school by taking classes such as trigonometry, calculus, and physics.
Other occupations might require—or benefit from—a background in engineering. Of the occupations in chart 3, all but one typically require a bachelor’s degree or more education at the entry level.
Chart 3 shows that the median annual wages for these engineering-related occupations, like wages for engineers, were higher than the median for all workers in 2016. Together, the occupations in the chart are projected to add 41,500 jobs over the 2016–26 decade.
Read more about engineers and related careers in the Occupational Outlook Handbook (OOH). The OOH provides information on hundreds of occupations, including descriptions of the work performed, skills needed, and job prospects.
Detailed employment and wage data for engineering occupations by industry and geographic location are available from the Occupational Employment Statistics survey.
O*NET has a searchable database with additional information on occupations, such as interests and technology skills needed. You can search occupations by career cluster, outlook, and other criteria.
Elka Torpey, "Engineers: Employment, pay, and outlook," Career Outlook, U.S. Bureau of Labor Statistics, February 2018.