
An official website of the United States government
An official website of the United States government
The .gov means it's official.
Federal government websites often end in .gov or .mil. Before sharing sensitive information,
make sure you're on a federal government site.
The site is secure.
The
https:// ensures that you are connecting to the official website and that any
information you provide is encrypted and transmitted securely.
The JOLTS sample of 16,000 establishments does not directly support the production of sample based state or sub-state estimates. However, Metropolitan Statistical Area (MSA) estimates have been produced for the 18-largest MSAs identified by Current Employment Statistics (CES) Metro Area employment by combining the available sample with model-based estimates, and smoothed by taking a 3-month moving average. These data are experimental. As such, they have not been subject to the same level of review as the current official JOLTS national and regional estimates. BLS is inviting data users to comment on both the methodology used to produce these estimates and on the usefulness of these data.
These estimates consist of four major estimating models; the Composite Regional model (an unpublished intermediate model), the Synthetic model (an unpublished intermediate model), the Composite Synthetic model (published historical series through the most current benchmark year), and the Extended Composite Synthetic model (published current-year monthly series). The Composite Regional model uses JOLTS microdata, JOLTS regional published estimates, and Current Employment Statistics (CES) employment data. The Composite Synthetic model uses JOLTS microdata and Synthetic model estimates derived from monthly employment changes in microdata from the Quarterly Census of Employment and Wages (QCEW), and JOLTS published regional data. The Extended Composite Synthetic extends the Composite Synthetic estimates by ratio-adjusting the Composite Synthetic by the ratio of the current Composite Regional model estimate to the Composite Regional model estimate from one year ago.
The Extended Composite Synthetic model (and its major component—the Composite Regional model) is used to extend the Composite Synthetic estimates because all of the inputs required by this model are available at the time monthly estimate are produced. In contrast, the Composite Synthetic model (and its major component—the Synthetic model) can only be produced when the latest QCEW data are available. The plan is to use Extended Composite Synthetic model estimates to extend the Composite Synthetic model estimates during the annual JOLTS re-tabulation process. The extension of the Composite Synthetic model using current data-based Composite Regional model estimates will ensure that the Composite Synthetic model estimates reflect current economic trends.
The following outlines each model in a non-technical summary format. Each model is summarized separately, and answers the following:
The Composite Regional approach calculates MSA-level JOLTS estimates from JOLTS microdata using sample weights, and the adjustments for non-response (NRAF). The Composite Regional estimate is then benchmarked to CES MSA-supersector employment to produce MSA-supersector estimates. The JOLTS sample, by itself, cannot ensure a reasonably sized sample for each MSA-supersector cell. The small JOLTS sample results in quite a number of MSA-supersector cells that lack enough data to produce a reasonable estimate. To overcome this issue, the MSA-level estimates derived directly from the JOLTS sample are augmented using JOLTS regional estimates when the number of respondents is low (that is, less than 30). This approach is known as a composite estimate which leverages the small JOLTS sample to the greatest extent possible and supplements that with a model-based estimate. Previous research has found that regional industry estimates are a good proxy at finer levels of geographical detail. That is, one can make a good prediction of JOLTS estimates at the regional-level using only national industry-level JOLTS rates. The assumption in this approach is that one can make a good prediction of JOLTS estimates at the MSA-level using only regional industry-level JOLTS rates.
In this approach, the JOLTS microdata-based estimate is used, without model augmentation, in all MSA-supersector cells that have 30 or more respondents. The JOLTS regional estimate will be used, without a sample-based component, in all MSA-supersector cells that have fewer than five respondents. In all MSA-supersector cells with 5–30 respondents an estimate is calculated that is a composition of a weighted estimate of the microdata-based estimate and a weighted estimate of the JOLTS regional estimate. The weight assigned to the JOLTS data in those cells is proportional the number of JOLTS respondents in the cell (weight=n∕30, where n is the number of respondents).
These estimates are based upon a model. There is, as of yet, no methodology in place that can produce an estimate of error for the estimates the model produces. Research on a methodology to produce an error estimate is currently underway.
The Composite Regional supersector estimates are summed across MSA industry supersectors to the nonfarm level.
The Synthetic model differs fundamentally from the Composite Regional model. The Synthetic approach does not use JOLTS microdata but rather it uses data from the QCEW that have been linked longitudinally (Longitudinal Database—LDB), the QCEW-LDB. The Synthetic model attempts to convert QCEW-LDB monthly employment change microdata into JOLTS job openings, hires, quits, layoffs and discharges, and total separations data.


These estimates are based upon a model. There is, as of yet, no methodology in place that can produce any estimate of error for the estimates the model produces. Research on a methodology to produce an error estimate is currently underway.
The Composite Synthetic model is nearly identical to the Composite Regional model. The primary difference is the use of the Synthetic model estimates (described in the first section) rather than JOLTS published regional estimates when there is an insufficient amount of JOLTS microdata to produce a MSA-supersector estimate.
Just like the Composite Regional approach, the JOLTS microdata-based estimate is used in all MSA-supersector cells that have 30 or more respondents. However, in contrast to the Composite Regional approach, the Composite Synthetic approach uses the Synthetic estimate in all MSA-supersector cells that have fewer than five respondents. In all MSA-supersector cells with 5–30 respondents an estimate is calculated that is a composition of a weighted estimate of the microdata-based estimate and a weighted estimate of the Synthetic estimate. The weight assigned to the JOLTS data in those cells is proportional the number of JOLTS respondents in the cell (weight=n∕30, where n is the number of respondents).
The Composite Synthetic supersector estimates are summed across MSA-supersectors to the nonfarm level. Composite Synthetic estimates are averaged across 3 months, creating a 3-month moving average.
These estimates are based upon a model. There is, as of yet, no methodology in place that can produce any estimate of error for the estimates the model produces. Research on a methodology to produce an error estimate is currently underway.
The Extended Composite Synthetic model is designed to project the Composite Synthetic forward until QCEW-LDB data are available to produce Composite Synthetic estimates. The Composite Synthetic estimates are extended using the ratio of the current Composite Regional MSA industry estimate to the Composite Regional MSA industry estimate from one year ago.
This approach ensures that the Extended Composite Synthetic MSA estimates reflect current JOLTS regional and industry-level economic conditions. The Extended Composite Synthetic estimates reflects current JOLTS MSA economic conditions to the extent that sufficient JOLTS microdata are available.
The Composite Synthetic model estimates are produced at a lag since QCEW-LDB data are only available at a 6–9 month lag relative to JOLTS data. The Composite Regional model estimates, in contrast, are not produced at a lag and are available concurrent with JOLTS data. Therefore, Composite Synthetic estimates can be extended by ratio-adjusting the Composite Synthetic estimates by the ratio of current Composite Regional estimates to the Composite Regional estimates from one year ago at the MSA-industry-level as follows:
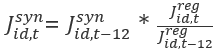
Where
 is the Extended Composite Synthetic MSA industry estimate for month t
 is the Composite Synthetic MSA industry estimate for month t-12 (one year ago)
 is the Composite Regional MSA industry estimate for month t
 is the Composite Regional MSA industry estimate for month t-12 (one year ago)
MSA-level estimates are produced by summing the Extended Composite Synthetic estimates over industry.
The JOLTS MSA Research Estimates Sample Allocation table below, provides a snapshot of the sample used in the MSA research estimates. Sample are utilized in both components of the model. The sample component incorporates JOLTS MSA respondent data. The model component incorporates JOLTS regional-level respondent data, CES Metro Area respondent data, and QCEW establishment counts.
| MSA Code | Area Title | JOLTS MSA respondents[1] | JOLTS Regional respondents[2] | QCEW Establishments[3] | CES Metro Area respondents[4] | ||
|---|---|---|---|---|---|---|---|
| 2018 | 2018 | 2019 | 2018 | 2018 | 2019 | ||
12060 | Atlanta-Sandy Springs-Roswell, GA | 135 | 3,086 | 2,979 | 148,425 | 4,245 | 4,243 |
16980 | Chicago-Naperville-Elgin, IL-IN-WI | 254 | 2,153 | 2,096 | 255,494 | 9,490 | 9,205 |
19100 | Dallas-Fort Worth-Arlington, TX | 164 | 3,086 | 2,979 | 184,405 | 4,889 | 4,516 |
19740 | Denver-Aurora-Lakewood, CO | 96 | 2,034 | 1,933 | 106,323 | 2,945 | 2,735 |
19820 | Detroit-Warren-Dearborn, MI | 92 | 2,153 | 2,096 | 98,957 | 3,991 | 3,870 |
26420 | Houston-The Woodlands-Sugar Land, TX | 147 | 3,086 | 2,979 | 158,941 | 4,094 | 4,005 |
31080 | Los Angeles-Long Beach-Anaheim, CA | 306 | 2,034 | 1,933 | 641,292 | 10,917 | 10,658 |
33100 | Miami-Fort Lauderdale-West Palm Beach, FL | 152 | 3,086 | 2,979 | 223,400 | 4,251 | 4,076 |
33460 | Minneapolis-St. Paul-Bloomington, MN-WI | 130 | 2,153 | 2,096 | 98,850 | 2,781 | 2,768 |
35620 | New York-Newark-Jersey City, NY-NJ-PA | 522 | 1,893 | 1,862 | 614,481 | 15,366 | 14,910 |
37980 | Philadelphia-Camden-Wilmington, PA-NJ-DE-MD | 171 | 1,893 | 1,862 | 167,824 | 6,181 | 6,066 |
38060 | Phoenix-Mesa-Scottsdale, AZ | 107 | 2,034 | 1,933 | 106,318 | 3,332 | 3,318 |
40140 | Riverside-San Bernardino-Ontario, CA | 81 | 2,034 | 1,933 | 131,032 | 3,664 | 3,616 |
41740 | San Diego-Carlsbad, CA | 69 | 2,034 | 1,933 | 115,834 | 3,659 | 3,587 |
41860 | San Francisco-Oakland-Hayward, CA | 87 | 2,034 | 1,933 | 205,333 | 5,515 | 5,450 |
42660 | Seattle-Tacoma-Bellevue, WA | 97 | 2,034 | 1,933 | 132,862 | 3,946 | 3,864 |
47900 | Washington-Arlington-Alexandria, DC-VA-MD-WV | 156 | 3,086 | 2,979 | 194,899 | 3,050 | 2,964 |
71650 | Boston-Cambridge-Nashua, MA-NH NECTA | 174 | 1,893 | 1,862 | 175,160 | 5,966 | 5,851 |
00000 | All Areas | 2,940 | 9,166 | 8,870 | 3,759,830 | 98,282 | 95,702 |
Footnotes: [1]JOLTS Sample Units used in Sample Component of the Composite & Extended Composite Models [2]JOLTS Sample Units used in Model Component of the Composite & Extended Composite; the Total is the sum of the four regions [3]QCEW Establishments used in the Model Component of the Synthetic and Composite Synthetic Model [4]CES UI Sample Units used in Model Component of the Composite Synthetic & Extended Composite Models | |||||||
These estimates are based upon a model. There is, as of yet, no methodology in place that can produce any estimate of error for the estimates the model produces. Research on a methodology to produce an error estimate is currently underway.
Last Modified Date: July 31, 2020