An official website of the United States government
An official website of the United States government
The .gov means it's official.
Federal government websites often end in .gov or .mil. Before sharing sensitive information,
make sure you're on a federal government site.
The site is secure.
The
https:// ensures that you are connecting to the official website and that any
information you provide is encrypted and transmitted securely.
From December 2009 to January 2010, 30 states and the District of Columbia recorded unemployment rate increases, 9 states registered rate decreases, and 11 states had no rate change. Over that same period, nonfarm payroll employment increased in 31 states and the District of Columbia, decreased in 18 states, and remained unchanged in 1 state.
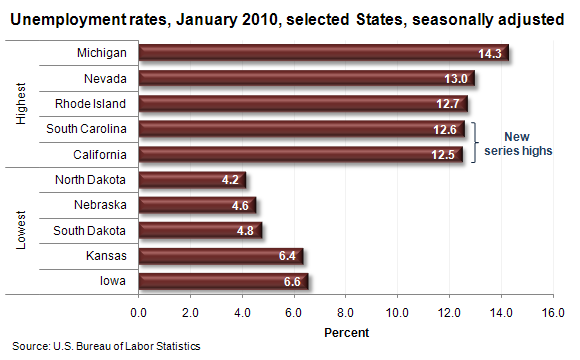
In January, Michigan again recorded the highest unemployment rate among the states, 14.3 percent. The states with the next highest rates were Nevada, 13.0 percent; Rhode Island, 12.7 percent; South Carolina, 12.6 percent; and California, 12.5 percent. North Dakota continued to register the lowest jobless rate, 4.2 percent in January, followed by Nebraska and South Dakota, 4.6 and 4.8 percent, respectively.
The rates in California and South Carolina set new series highs, as did the rates in three other states: Florida (11.9 percent), Georgia (10.4 percent), and North Carolina (11.1 percent). The rate in the District of Columbia (12.0 percent) also set a new series high.
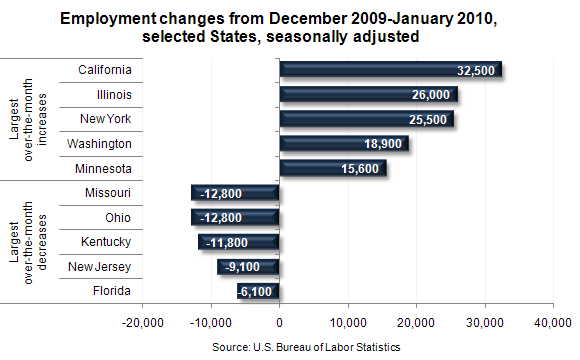
From December 2009 to January 2010, the largest over-the-month increase in employment occurred in California (+32,500), followed by Illinois (+26,000), New York (+25,500), Washington (+18,900), and Minnesota (+15,600). The largest over-the-month decreases in employment occurred in Missouri and Ohio (‑12,800 each), followed by Kentucky (‑11,800), New Jersey (‑9,100), Florida (‑6,100), and Nevada (‑5,700).
These data are from the Local Area Unemployment Statistics and Current Employment Statistics (State and Metro Area) programs and are seasonally adjusted. To learn more, see "Regional and State Employment and Unemployment — January 2010" (HTML) (PDF), news release USDL 10-0284.
Bureau of Labor Statistics, U.S. Department of Labor, The Economics Daily, State unemployment rates and over-the-month employment changes, January 2010 at https://www.bls.gov/opub/ted/2010/ted_20100312.htm (visited April 19, 2024).