An official website of the United States government
An official website of the United States government
The .gov means it's official.
Federal government websites often end in .gov or .mil. Before sharing sensitive information,
make sure you're on a federal government site.
The site is secure.
The
https:// ensures that you are connecting to the official website and that any
information you provide is encrypted and transmitted securely.
The BLS mission statement states that BLS executes its mission by “. . . providing products and services that are accurate, objective, relevant, timely, and accessible.” The Consumer Expenditure Survey (CE) program supports this mission in its research and development projects. In particular, the CE program maintains the relevance of the surveys through research projects and regular biennial updates to the Consumer Expenditure Quarterly Interview (CEQ) questionnaire and improves data quality through methodological and data collection revisions. A team of economists, survey methodologists, and statisticians work together to identify and propose solutions for measurement error problems, develop new approaches to maintaining response rates and other data collection issues, streamline data processing procedures, and investigate and implement estimation methods that are more efficient.
The CE measures spending by consumers for the total U.S. noninstitutional population. The principal purpose of the survey is to provide the Consumer Price Index (CPI) program with the expenditure weights that the CPI program uses to generate an all-items index. The CPI is the primary measure of household inflation and is one of the most important economic measures of the U.S. economy. Accurate information on consumer spending habits—used to determine expenditure weights—is vital to the CPI. An expenditure weight is an estimate of consumer expenditure needed to weight the market basket of goods. In addition to collecting expenditure data, the CE collects information on family income, assets, liabilities, housing characteristics, and detailed demographic information, making the survey a unique data source for policy analysis and research.
The article comprises (1) an introduction to the CE program, (2) a history of the CE’s methodological improvements, (3) an overview of the Gemini Project, and (4) highlights of recent research conducted in support of the redesign. The article concludes with a discussion of next steps for the CE as the Gemini Project transitions from development to implementation.
The CE program currently consists of two independent surveys, the Consumer Expenditure Quarterly Interview (CEQ) and the Consumer Expenditure Diary (CED). The geographic samples for the surveys are updated every 10 years using the decennial census to create the sampling frame, and new addresses are selected each year from a master address file that is updated with new addresses from a Postal Service file. The unit of measure is a consumer unit (CU), which consists of all members of a household who are related or who share expenditure decisions. The CE data are collected by the U.S. Census Bureau.
In the CED, respondents complete two 1-week expenditure diaries that capture all expenditures for everyone in the CU. The diaries span 2 consecutive weeks. The CED is designed primarily to collect expenditure data on small or frequently purchased items such as food, meals away from home, apparel, and personal care items. Interviewers visit the selected sample units to collect demographic and income information, leave the diaries, and ask the diary keeper to record expenditures daily. About 7,000 CUs participate in the CED per year and complete about 14,000 diaries.
The purpose of the CEQ is to capture expenditures for larger and less frequently purchased items and for items, such as rent or utilities, for which payments are made on a regular basis, such as monthly. The CEQ is a quarterly survey with a rotating panel design. Each CU is interviewed four times over the course of 10 months (although respondents are only in the sample for 10 months, the survey’s recall period still covers a 12-month period). In the first interview, the interviewer collects demographic data for all CU members and establishes an inventory of items such as properties, vehicles, and insurance policies, which are updated in subsequent interviews. The interviewer collects data on all expenditures for the previous 3-month period and updates demographic and inventory data. Income data are collected in interviews 1 and 4 only; assets and liabilities are asked in the fourth interview. The CEQ produces usable interviews for about 28,000 CUs per year.
While there is some overlap in spending categories covered in the CED and CEQ, some items, such as personal care items, are not captured in the CEQ while others, such as food expenditures, are captured only at an aggregate level (i.e., not at finer levels of detail) in the CEQ.
The revision of the CPI biennial expenditure weights remains the primary reason for undertaking the CE. However, CE data are used by a wide variety of researchers, policy analysts, and government agencies that are interested in studying the economic well-being of America’s families. The CE allows outside researchers to relate the expenditures and income of consumers to the characteristics of those consumers. Data from the CE are used by economic policymakers and others to evaluate the effects of tax or other policy changes on levels of well-being among diverse socioeconomic groups. Econometricians use the CE data in various ways. For example, some use it to construct economic models, such as structural models of optimal life-cycle consumption expenditures. Others use it to test whether people’s spending is based on their current income or on what they expect to earn over a longer period of time, or to investigate the distributional effect of consumption taxes. Market researchers find CE data valuable in analyzing the demand for groups of goods and services. These are some specific uses of CE data:
On an exploratory research basis, CE data are used to determine poverty thresholds for the U.S. government’s Supplemental Poverty Measure.1
The U.S. Department of Agriculture uses CE data to estimate the cost of raising a child.2 Policies on foster care and child support are based on the amounts parents spend on health care, education, transportation, and other expenses for their children.
The Department of Defense uses CE data to update cost-of-living adjustments for military families.
The Center for Medicare and Medicaid Services uses CE data to estimate American spending on health care. The CE is one of the few sources of data on out-of-pocket expenses for hospital care.
The Bureau of Economic Analysis uses information from homeowners to measure personal spending for its calculation of gross domestic product.
This section presents major changes that have been introduced into the CEQ and CED since 2000. Many of the changes are not visible to users of aggregate-level data, as the changes occur in detailed questions asked of respondents sometimes with, but often without, the creation of new expenditure category codes for analysis. The changes include efforts to reduce response burden by designing data collection instruments that are easier for respondents to complete and by phrasing questions so they are easier to understand and more accurately convey the intent of the question. Changes also address survey response through new field procedures and training materials. The 2009 paper by Karen Goldenberg and Jay Ryan, “Evolution and change in the Consumer Expenditure surveys: adapting methodologies to meet changing needs,” provides additional documentation on many of the changes presented here.3
What follow are major innovations to the CEQ.
Automating the CEQ instrument: conversion to CAPI. In April 2003 the CEQ moved from a paper-and-pencil data collection form to a computer-assisted personal interview (CAPI) data collection instrument. The CAPI development project was an interagency effort with the Census Bureau that started in the late 1990s. It was the largest survey improvement project ever undertaken by the CE program, and was one of the first major government surveys to use CAPI data collection.
New field procedures for telephone interviewing. The CEQ questions were designed to be asked during a personal visit and had no provision for interviewing by telephone. The move to CAPI collection gave CE staff the ability to monitor collection mode for the first time. In response to analysis of these data, CE staff took two actions. First, they developed a set of procedures that specify the conditions under which it is acceptable to conduct a telephone interview, as well as the process—the mobility of cell phones means that interviewers must be sensitive to the fact that a respondent may not be at a convenient or appropriate place at the time an interviewer calls. Second, CE staff developed a new series of paradata items in the CAPI instrument to better measure the use of telephone interviewing.
CEQ biennial revisions. The CE program updates and revises the CEQ every 2 years, in conjunction with the CPI market-basket revision. The revision process begins shortly after the last set of biennial revisions goes into production, and is the mechanism by which the survey stays abreast of changes in the consumer environment. Research into potential changes includes
• a review of new or emerging products and services that are not currently collected;
• identification of changes in the ways existing products or services are marketed and billed (e.g., bundled utilities);
• a review of selected expenditure categories to determine whether products need their own category codes;
• a review of questionnaire content to correct any items that have been identified as problematic or confusing for respondents or difficult for interviewers to handle within the instrument; and
• solicitation of input from CPI and other BLS users, Census field staff, and others about needed or desired changes.
Other methodological improvements. The following improvements have already been made:
• Tax estimation: a new process was put in place for the 2013 data to estimate federal and state income taxes for the CEQ. The estimation process incorporates computer code from the National Bureau of Economic Research TAXSIM model, as well as a process to assign CUs into tax units.4 An analysis of the data was written and published as a Monthly Labor Review article in 2015.5
• Race edit imputation: when race data are missing, they are now imputed using current geographic population totals from the Census Bureau.
• Weighting for missing high-income CUs: a Conference on Research in Income and Wealth paper pointed out that the CE was underrepresenting high-income CUs.6 A new weighting process was developed to use Internal Revenue Service data to account for these missing units.
Bounding interview elimination. With the 2015 data collection cycle, the CEQ design was changed from a five-wave design to a four-wave design. In the five-wave design, the main intention of the first interview was to “bound” the interview period so that respondents didn’t “telescope,” which means bringing forward expenditure reports from outside the recall period. Analysis of the data showed that telescoping had little impact and that the bounding interview was unnecessary.7 Eliminating the first interview did cause the new first interview to take more time because additional questions were added. But the CE made an effort to streamline the survey in 2015 to reduce the overall length of the interview.
What follow are major innovations to the CED.
The respondent-friendly diary. The design of the CED form had been reviewed and revised over the years but continued to be a challenging document for respondents. The goal of the diary redesign project was to improve response rates while maintaining the same level of data quality. Steps in this process included simplifying the form layout, improving navigation throughout the form, and reducing the number of major categories. Various prototype forms were tested and refined. One redesign version was selected for a major field test, which was conducted in the fall of 2002. Results from the successful field test of the new form led to some additional modifications of that form, which were implemented in production in January 2005.
The diary forms are shipped to the Census Bureau’s National Processing Center to be entered into a database. To support the redesign project, the National Processing Center introduced a new keying and item coding system. About 65 percent of the time, the system assigns the item code on the basis of the expenditure description recorded by the respondent. If a code cannot be assigned automatically, the system displays a list of likely expenditure categories and the keyer makes a selection. Data are keyed, first by one keyer and then by another. When the item code values assigned by the two keyers differ, a keying adjudicator determines the item code.
CAPI collection of demographic and household data. When the diary initially is provided to the household, the interviewer collects demographic data for the household. The interviewer also obtains CU income information at the time the second week diary is picked up. Following the conversion of the Interview Survey to CAPI, the interview portion of the Diary Survey was also converted to CAPI. The CAPI interview portion of the Diary Survey went into use in March 2004.
What follow are major innovations to both the CEQ and CED.
Asking better questions. The CE tests all new and revised questions in the cognitive laboratory operated by the BLS Office of Survey Methods Research. Laboratory staff maintain a pool of individuals from the local community who serve as test respondents. Research staff develop study protocols to test asking respondents alternative survey question wording, and then seek additional information to learn about the validity of response. In addition, research staff ask the respondents how they went about formulating their answers. Using a set of standard cognitive testing techniques, researchers identify any issues they discover about each question or question set and propose solutions to address those issues. Revised questions are retested until the questions are understood properly, answered accurately, and function as intended.
Contact History Instrument. The Contact History Instrument (CHI) is one tool in the collection of approaches being developed to help staff understand and combat survey nonresponse. It is an automated module administrated in conjunction with a CAPI survey instrument. The CHI is designed to record information about every attempted and actual interaction between an interviewer and a CU. For each in-person or telephone contact, interviewers record the nature of the contact or noncontact, any issues or concerns perceived by the interviewer as being problematic for the respondent that will affect response, and the strategies the interviewer used to reach the CU. The CHI was added to the CEQ in 2005 and to the CED in 2006.
Income imputation. Income is a key variable for the CE surveys, but it is also a sensitive item and one that is prone to item nonresponse. Beginning with publication of the 2004 data, the CE instituted a multiple imputation procedure to estimate values for income when respondents did not report precise values. Imputation allows the CE program to publish mean income that reflects all CUs. For respondents who provide a bracket value for income, the imputed values lie within the range described by the bracket. When respondents provide no information about their income, a regression-based multiple imputation method estimates their income. Essentially, a regression is run to provide coefficients for use in estimating values for missing data points on the basis of observed independent variables. Each coefficient is then “shocked” by adding random noise to it, and missing values are estimated using the shocked coefficients. This process is used to generate unbiased variances; the first shock is designed to account for the variance in the parameter estimates and the second shock is to account for the variance in the regression residual. To each of these estimated values, additional random noise is added to ensure that consumer units (or members) with identical characteristics (e.g., urban service worker ages 25 to 34) will not receive identical estimates for their income. The resulting values are used to fill in invalid blanks where they occur, whereas reported values are retained. This process is then repeated four times, so that a total of five imputed values are computed for each missing value. The filled-in value is the average of all five imputations.
Source selection for best estimates. As already noted, the CEQ is designed to capture major expenditure items, household characteristics, and income data, and the CED is designed to capture purchases that respondents are not likely to recall accurately over a long period of time. However, CED respondents are asked to report all expenses (except overnight travel) that their CU incurs during the survey week. As a result, the CED and CEQ overlap somewhat in their coverage of household expenditures. In a procedure known as integration, the CE chooses the CED or CEQ component of the CE as the most statistically reliable source for each expenditure item and uses data from that source for both the CE publications and data comparisons. A new selection of expenditures is done every other year in conjunction with the CPI staff to ensure that both programs use the same data source.
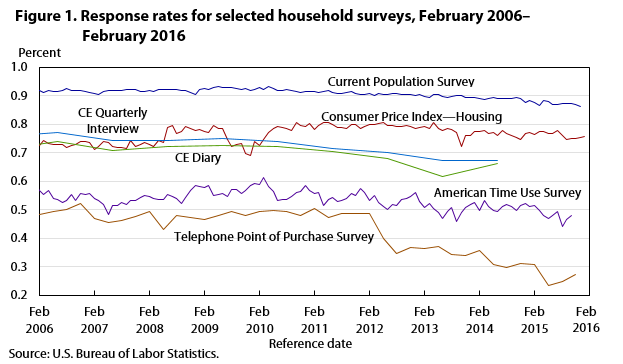
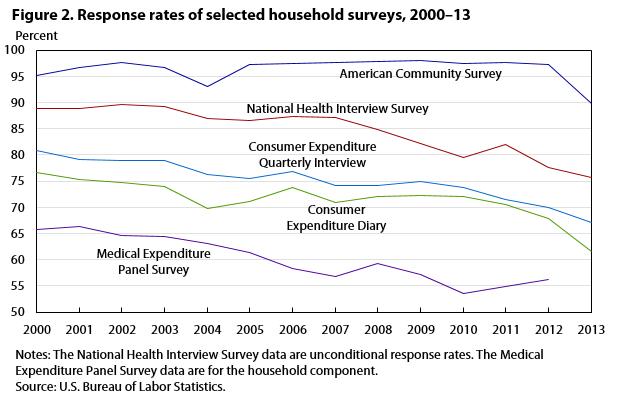
In 2009, the CE program initiated the Gemini Project to research, develop, and implement an improved survey design. The project name “Gemini,” Latin for “twins,” is a nod to the twin components of the current design—the CEQ and CED. In 2013, the CE redesign proposal was approved, outlining the future direction of the CE. As stated in the project’s vision document,8 the objective of the redesign is to improve data quality through a quantifiable reduction in measurement error, particularly error generally associated with underreporting. As secondary goals, the CE program seeks to reduce the burden for respondents and, to the extent possible, do no further harm to response rates, which have been trending downward for both BLS surveys and surveys in general (see figures 1 and 2). While earlier methodological improvements targeted specific components of the overall survey protocol, the Gemini Project is the first to pursue a comprehensive redesign. Complete background information on the Gemini Project, as well as associated materials, are publicly accessible from the project website.9
The CE program contracted with CNSTAT in 2011 to convene an expert panel that would analyze issues facing the CE and propose redesign options. The panel included nationally recognized experts in the fields of economics, statistics, and survey methodology. Their recommendations are detailed in a final report that synthesized information from past CE research projects, outreach to data users and industry experts, and independent papers into concrete design recommendations.10
CNSTAT released its final report in late 2012, recommending that BLS support a major redesign of the CE. The CNSTAT final report also included a series of potential design options that would address some of the major issues that face the survey.
In 2013, the CE program developed a comprehensive redesign proposal—which relied heavily on the CNSTAT design recommendations that were approved in 2013—outlining the future direction of CE.11 CNSTAT’s final report served as a key input to the redesign plan’s development and remains central to the ongoing CE redesign process. The redesign aims to modernize the survey to reflect changes in consumption behavior, such as the expansion of online shopping, the growth of large general merchandise stores, automatic bill paying, and other new modes of payment (e.g., smartphone apps). In addition, the redesign initiative aims to address the changing landscape of survey administration. These changes include less willingness on the part of households to respond to surveys, a greater number of competing surveys, and increased concerns about safeguarding information.
The following are CNSTAT recommendations that were incorporated into the redesign plan:
• A one-sample design (i.e., not separate samples for CEQ and CED)
• Fewer and shorter interviews to lessen respondent burden
• Increased use of technology, especially to facilitate “in-the-moment” (i.e., contemporaneous) reporting
• Increased record use to improve data quality (e.g., asking a respondent to refer to a utility bill rather than asking them to recall what they paid)
• Individual diaries to reduce proxy reporting
• Mixed-mode data collection
• Incentives to increase compliance and engagement
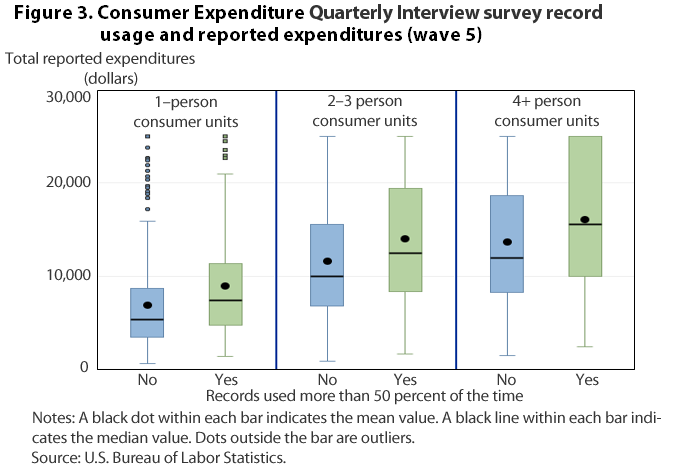
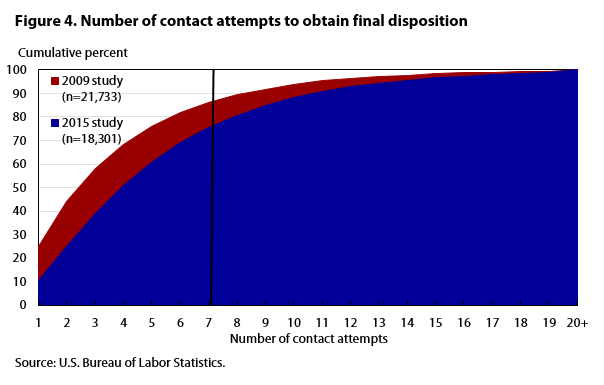
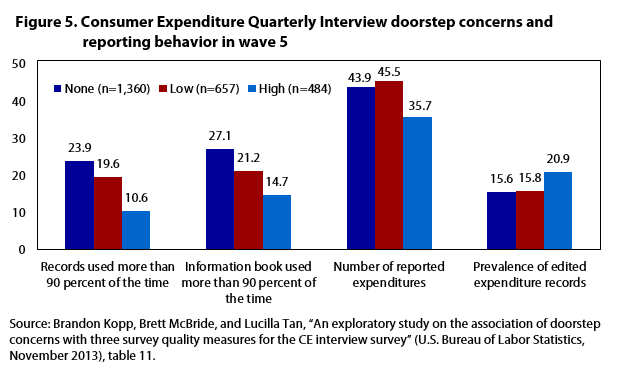
A single-sample design increases cost efficiencies and reduces overall respondent burden. After we control for other factors, including household size, increased record use has been shown to be associated with a higher level of expenditures that are reported (see figure 3). The design includes the use of incentives to increase respondent cooperation and engagement. Incentives help counterbalance both the increase observed in contact attempts needed to reach final disposition over time (see figure 4) and the lower level of expenditure reporting associated with respondent concerns (see figure 5).
The redesign plan calls for a single sample of CUs participating in two waves of data collection set 12 months apart. Each wave is identical in structure: a wave consists of two visits with a single respondent serving as a proxy reporter for all CU members (although other members may be present at the interview and may contribute) and a 1-week diary for completion by every CU member 15 years and older. In addition, the redesign introduces a web diary (accessible via computer, smartphone, or other mobile device) and performance-based incentives.
The redesign plan attempts to increase the CE’s ability to collect high-quality data while maintaining response rates and stabilizing cost through the use of
• incentives to address respondent motivation;
• individual diaries to reduce proxy reporting;
• technology to encourage real-time data capture; and
• shortened interview length and increased record use to improve data quality.
An overview of the redesign is presented in table 1.
| Item | Type of record | ||
|---|---|---|---|
| Visit 1 | Diary week | Visit 2 | |
Interview type | Recall based | Contemporaneous recall | Records based |
Mode | Personal visit | Self-administered web or paper form (respondent preference) | Personal visit |
CU level or person level | CU-level interview with proxy respondent | All CU members ages 15 years and older | CU-level interview with proxy respondent |
Reference period | 3 months | 1 week | 3 months |
Interview | Household roster, select large expenditure categories | All expenditures | Select large expenditure categories, diary review, paper diary pickup |
Postinterview instructions | Respondent to collect records for select expenditure categories for visit 2, diary placed with respondent, provide training for web diary | Not applicable | Not applicable |
Anticipated length of interview | 45 minutes | 20 minutes per day | 45 minutes |
Incentive conditional on completion | Yes | Yes | Yes |
Level at which incentive is provided | CU | Person | CU |
Value of incentive | $20 debit card | $20 debit card | $20 debit card without records, or $40 if records used |
Note: In wave 1, a prepaid token $5 cash incentive accompanies the survey advance letter. Wave 2 is repeated 1 year later. Nonmonetary household spending summary is sent upon completion of wave 2. Source: Consumer Expenditure Survey program, U.S. Bureau of Labor Statistics. | |||
Visit 1. Visit 1 is an in-person recall-based interview, with some reduction to the number of included items. During visit 1, the interviewer (i.e., field representative) establishes a household roster and conducts a recall interview to collect large, easily remembered household expenditures (e.g., such as cars and major appliances) from the previous 3 months. After the recall interview, the interviewer asks the respondent to collect records for select expenditures to be used in the visit 2 interview. Lastly, the interviewer places diaries and trains respondents on using the web diary. Visit 1 is expected to last approximately 45 minutes on average. Upon successful completion of visit 1, the CU receives a $20 debit-card incentive.
Diary week. Beginning the day after the visit 1 interview, all CU members 15 years and older keep a diary of their expenditures for the next 7 days. A $20 incentive in the form of a debit card is given to each CU member who completes the diary task. Any CU member unable or unwilling to use the web diary is given a paper diary form. This multimode diary allows respondents to use the technology they are most comfortable with. The diary portion of the survey is intended to capture items that are frequently purchased and might not be recalled accurately over a long period of time, in addition to more sensitive items and items that a proxy respondent may not know for other CU members.
Visit 2. Visit 2 takes place after the diary-keeping period, 1 week after visit 1. Visit 2 consists of a records-based interview, in which the interviewer collects expenditures on the basis of records requested in visit 1. This interview targets expenditures respondents tend not to remember accurately but keep records of—for example, mortgage principal and interest and phone bills. In addition, the interviewer collects any paper diaries and enters any additional expenses missed by members during the diary week. Like visit 1, visit 2 is expected to last approximately 45 minutes on average. The incentive amount for visit 2 is $20 awarded to the CU, or $40 if records are used.
Wave 2. Twelve months later, each CU repeats the full process. The second wave of data collection follows the same structure as the first, with the visit 1 recall interview, the individual 1-week diaries, and the visit 2 records interview. The incentive structure also remains the same.
One advantage of having only two waves is the reduction in respondent burden. There is an additional risk, which is that of losing the FR–respondent rapport developed during the first wave. To offset this, a respondent engagement mailing is sent to CUs after the first wave. This mailing is envisioned as a postcard or email thanking the respondents for their time, reiterating the importance of their participation, and reminding them of the next wave.
Incentives. Each wave begins with an advance mailing that describes the survey and explains the importance of their participation (similar to the current CE design’s wave 1 advance letters). The letter also includes a token $5 cash incentive and information about the promised incentives for successfully completing the household interview and diary components.
Under the redesign plan, incentives are performance based and awarded at the individual level. A single-household CU respondent receives $20 for completing the visit 1 recall interview and $20 or $40 for the completion of the visit 2 records interview, depending on whether records are used. Each CU member, including the household CU respondent, receives $20 for successfully completing the diary task. All monetary incentives are repeated for wave 2.
The final incentive is a nonmonetary “respondent experience package” awarded after each wave of data collection. This brochure package contains a personalized graph showing the household’s expenditures compared with national averages, as well as an information sheet listing helpful, relevant government websites about spending.
After releasing the redesign plan in 2013, the Gemini Project entered a testing and development phase which will lead to implementation. A high-level timeline for redesign implementation is publicly accessible from the project website, with additional description provided here of the proof-of-concept test (POC), questionnaire design tests, and the large-scale feasibility test.12 The timeline for redesign implementation is funding dependent; the CE’s goal is to implement a fully redesigned survey by the mid-2020s.
POC test. The purpose of the POC test is to mirror as closely as possible the design on a small scale, including the administration of one wave of the redesign plan. The POC’s main objective is to ensure that the basic underlying structure and components of the new design are feasible. The test will also provide information on the effectiveness of incentives, length of interviews, and respondents’ willingness and ability to complete each component of the survey. The POC incorporates the major factors of the redesign plan: the visit 1 recall interview, 1 week of individual diarykeeping and records collection, the visit 2 records interview, web diaries (with a paper backup), and incentives for each component. The POC test was fielded in 2015; results are pending.
Gemini content project. The Gemini design team reviewed required expenditure categories and determined whether each expenditure category was best collected via recall, records, or a diary. The design team identified 36 expenditure categories to be collected via recall during the visit 1 interview, 68 categories to be collected via the diary, and 36 categories to be collected via records in the visit 2 interview. Information collected in the recall interview includes home goods, improvements, and services; information and information services; transportation; pets; and recreation. Diary categories include clothing, food, personal care, and housekeeping supplies. For the records interview, categories such as utilities, housing, vehicles, medical expenses, insurance, and education are included. These designations are being tested and evaluated to ensure the best collection method is used. The Gemini content project was completed in 2014, with results summarized in a final report.13
Recall interview question development. The questionnaire for the visit 1 recall interview of the redesigned CE is in development. Through cognitive interviews, contracted Westat researchers are testing various aspects of the questionnaire, including question wording and the level of aggregation at which each question should be asked. For example, the category for educational expenses may be asked as a single question— “What did your household spend on education expenses in the past X months”—or as multiple questions—“In the past X months, what did your household spend on
• college tuition?
• tutoring and test preparation?
• educational books and supplies?”
The level of aggregation required for some expenditure categories may result in data provided by some lower level questions in the recall interview and by responses in the records-based interview, so that the category is spread across both interviews.
Recall interview protocol. Although the current CEQ has a protocol in place, this protocol has never been fully evaluated to identify possible improvements. To ensure that the redesigned recall interview uses the best method for collecting recall information, the CE tested two alternative protocols: (1) a respondent-driven versus interviewer-driven interview structure, and (2) a grouped versus interleafed question order.
The respondent-driven versus interviewer-driven dimension concerned interview order and flow. In the respondent-driven protocol, respondents were presented with a list of broad expenditure categories (e.g., trips and vacations, housing repairs and maintenance, education expenses) and controlled the order of the interview. The interviewer-driven protocol progressed with a set order and is the method used in the current CEQ.
The grouped versus interleafed dimension focused on how questions flowed within each section. For grouped sections, the respondents were presented with a list of items in the section and were asked to indicate all items for which they had an expense. Once a list of expenses was complete, followup questions were asked about each of those items. For the interleafed protocol, all followup questions were asked directly after an affirmative item expense—that is, before continuing on to the next item. The interleafed protocol is the procedure used in the current CEQ.
Through a series of cognitive interviews, contracted Census researchers found that the original structure—interviewer-driven with an interleafed question order—worked best for respondents and interviewers alike.
Records interview protocol. For the visit 2 records interview protocol test completed in 2015, CE program staff tested a track in which respondents handle their records and determine the order of the interview. The staff then compared the results with those from a track in which the interviewer organizes the records and follows a scripted interview order.
With the respondent track, the respondent has a great deal of control over the interview. The interviewer asks the respondent to report expenses from the records gathered, in an order chosen by the respondent. An expected advantage of this design is that respondents can complete the interview in a manner that aligns with how they organize and think about their own records. A possible limitation of this design is that respondents may require more time to locate required information from their own records than would experienced interviewers who know where to look on receipts and other expense documents. Additionally, if a respondent’s record collection is not well organized, the interviewer may be required to revisit categories multiple times to collect all the needed data.
Using the interviewer track, the field representative leads the participant through the interview in a defined order. The interviewer follows a predetermined question order and handles the records (with respondent permission). Expected strengths of this design are reductions to both interview length and respondent burden.
The project resulted in findings that both interviewer-driven and respondent-driven protocols were feasible for a records interview. However, the frequency of use of electronic records was significantly greater in the respondent-driven group, and some participants expressed reluctance to hand over records to the interviewer. The team recommended moving forward with a hybrid approach whereby interviewers control the order of the questions and respondents control their own records. The study also showed the importance of a checklist in managing respondent expectations of interview content.
Large-scale feasibility test. The CE program plans to field a large-scale feasibility test (LSF) in 2019. The purpose of the LSF test is to evaluate the effectiveness of the redesigned survey in terms of response rate, data quality, and expenditure reporting differences. The test will benefit from the statistical power of a larger sample size. The LSF test will be designed to reflect all of the redesign components in an environment closer to what the production survey will operate in than the current survey. For example, the most up-to-date questionnaire revisions will be included, and all materials used will be designed specifically for the test. The LSF test will employ new collection instruments and revised protocols based on inputs from all previous field tests and other research activities.
This section offers a summary of recent research conducted in support of the redesign and is organized by which of the redesign objectives—reducing error, reducing burden, maintaining cost neutrality, or monitoring results—the study was developed to address. It concludes with a discussion of ongoing research challenges.
Reducing measurement error, particularly error generally associated with underreporting, is the primary objective of the redesign. To this end, the CE program is researching the linking of administrative data to respondent records. Recommended by the CNSTAT expert panel, supplementing respondent-provided data with relevant auxiliary data has the potential to both increase the accuracy of CE estimates and reduce data collection and processing costs. This approach is currently being tested with CE housing data, for which there is some evidence of underreporting.
Additional measurement-error research focuses on proxy reporting. CE staff have long been concerned about underreporting due to proxy reporting. Research and development of individual-level diaries to replace household-level diaries offers the potential to address this issue in the CED. The path is less clear for the CEQ. On the basis of questions asked in a 2013 research section, respondents who reported being “very knowledgeable” of other CU member expenditures showed a 5-percent increase in total reported expenditures compared with those reporting less proxy knowledge.14 Work continues in this area via a recent cognitive lab study offering design recommendations for future proxy protocols to minimize such error.15
The CE program also seeks to reduce error due to nonresponse. Like other surveys, the CE has experienced a marked decline in response rates, leading to greater concern about nonresponse bias. Research in this area includes analysis of data from the CHI module, which provides a log of contact-attempt observations. Results have been remarkably consistent, particularly for interview observations related to respondent initial concerns.16 The type of respondent’s initial concerns regarding survey participation was found to be associated with both an increased likelihood of nonresponse and reduced reporting quality in the final survey wave. Given this, the CE program is exploring a responsive design approach, in which hostile or concerned respondents receive tailored contact attempt treatments.
Additionally, CE researchers are using text analysis tools to apply quantitative techniques to qualitative data.17 For example, analyzing interviewer refusal notes quantitatively can speed up the information loop and provide assistance in gaining cooperation in later waves by tailoring information to respondent concerns.
Reducing burden is the secondary goal of the redesign. The CE program recognizes that participating in the survey requires a substantial commitment of time and energy from respondents. Therefore, the program seeks to strike a balance between the scope of data collected and the effort required from the respondent. In a 2013 research module, respondents identified interview length and number of interviews as the most burdensome aspects of the survey.18 Information like this assists the CE in evaluating redesign options.
Though the Gemini Project will result in major changes to the survey, the redesign is a necessarily cost-neutral undertaking. Research into the optimal number of contact attempts and the elimination of the bounding interview has supported this goal by identifying potential means of cost savings.
Because analysis results suggest that seven is the optimal maximum number of contact attempts from a total survey error perspective (that is, attempting contact for sample units beyond this ceiling was costly, did not have a substantive impact on sample characteristics, did not reduce measurement error, and did not improve sample representativeness despite increasing the response rate),19 CE researchers have proposed implementing this threshold.
Similarly, because of evidence that the bounding interview may not be effective in minimizing telescoping errors, and also because its expenditure data were not used in the production of official estimates nor released as part of the microdata files, CE researchers suggested eliminating the bounding interview as a way to reduce data collection costs without adversely affecting data quality. Starting with the 2015 production cycle, the bounding interview has been eliminated.
Along with undertaking projects in support of the redesign effort, CE researchers are developing ways to monitor the results of the redesign and verify its impact on measurement error. A set of data quality metrics is in development, which will be used to establish baselines for monitoring trends in the quality of routine survey production activities.20 These metrics can also be used to evaluate the impact of survey design options under consideration as well as external interventions that affect the survey. From this process, an annual data quality profile will be available first to internal stakeholders, and then eventually to external stakeholders, making data quality assessment more transparent.
Also in development is a composite burden index, which will allow the CE to track respondent burden over time. The burden index draws from questions asked in a 2013 research module to assess perceived burden; the CE tentatively plans to implement a burden index by 2017 as a baseline measure.
The CE program faces many challenges ahead. Specific challenges include
• reducing respondent burden due to data security requirements for online instruments,
• enabling interviewer handling of incentives,
• returning data of value to respondents through a spending summary report,
• accommodating acceptance of annotated grocery receipts, and
• incorporating innovations and lessons learned from administrative data linkage projects that use auxiliary housing and income data files from third party aggregators.
More broadly speaking, challenges include
• synthesizing test results into in-progress redesign testing and implementation,
• overcoming difficult limitations on research, testing, evaluation, and implementation because of ongoing budget constraints,
• achieving sufficient sample sizes in research tests,
• keeping up with the pace of technological change, and
• negotiating the promises and pitfalls of emergent private sector technologies, many which have limitations that are not yet fully understood or well suited to the federal government data-collection environment.
One example of the last challenge is balancing the tradeoffs between ease of access and data security in electronic survey instruments, as discussed in a recent paper by Brandon Kopp.21
However, through innovative design discussions, adherence to the CE’s planned redesign roadmap, iterative updates based on ongoing research and development, regular and interactive communication with stakeholders, and the support of a dedicated research and development staff, the CE program continues toward the successful implementation of a comprehensive survey redesign.
Adam Safir, Jay Ryan, Laura Erhard, Lindsay Jilk, and Lucilla Tan, "The Consumer Expenditure Survey redesign initiative," Monthly Labor Review, U.S. Bureau of Labor Statistics, April 2016, https://doi.org/10.21916/mlr.2016.15
1 “Research experimental poverty threshold,” U.S. Bureau of Labor Statistics, at https://www.bls.gov/pir/spmhome.htm.
2 “Expenditures on children by family,” U.S. Department of Agriculture, at https://www.fns.usda.gov/resource/expenditures-children-families-reports-all-years.
3 Karen Goldenberg and Jay Ryan, “Evolution and change in the Consumer Expenditure Surveys: adapting methodologies to meet changing needs” (U.S. Bureau of Labor Statistics, 2009), https://www.bls.gov/cex/nber2009ryan1.pdf.
4 More information about TAXSIM is available at http://users.nber.org/~taxsim/.
5 Geoffrey D. Paulin and William Hawk, “Improving data quality in Consumer Expenditure Survey with TAXSIM,” Monthly Labor Review, March 2015, https://www.bls.gov/opub/mlr/2015/article/pdf/improving-data-quality-in-ce-with-taxsim.pdf.
6 John Sabelhaus, David Johnson, Stephen Ash, David Swanson, Thesia Garner, John Greenlees, and Steve Henderson, “Is the Consumer Expenditure Survey representative by income?” (Cambridge, MA: National Bureau of Economic Research working paper, October 2013), http://www.nber.org/papers/w19589.pdf.
7 Ian Elkin, “Recommendation regarding the use of a CE bounding interview,” bounding interview project paper (U.S. Bureau of Labor Statistics, May 2013).
8 “Gemini Project vision document,” Gemini Project Steering Team, U.S. Bureau of Labor Statistics, April 16, 2010, last revised February 25, 2015, https://www.bls.gov/cex/gemini_vision_2015.pdf.
9 “Gemini Project to redesign the Consumer Expenditure Survey,” U.S. Bureau of Labor Statistics, revised November 5, 2015, https://www.bls.gov/cex/geminiproject.htm.
10 Don A. Dillman and Carol C. House, eds., Measuring what we spend: toward a new Consumer Expenditure Survey, National Research Council (Washington, DC: The National Academies Press, 2012), http://nap.edu/catalog.php?record_id=13520.
11 Jennifer Edgar, Dawn V. Nelson, Laura Paszkiewicz, and Adam Safir, “The Gemini Project to redesign the Consumer Expenditure Survey: redesign proposal,” CE Gemini Project materials (U.S. Bureau of Labor Statistics, June 2013), https://www.bls.gov/cex/ce_gemini_redesign.pdf.
12 “Gemini redesign project high level timeline,” March 7, 2014, at https://www.bls.gov/cex/geminitimeline.pdf. For the project website, see “Gemini Project to redesign the Consumer Expenditure Survey” at https://www.bls.gov/cex/geminiproject.htm.
13 Jennifer Edgar, Brandon Kopp, Erica Yu, Laura Erhard, and Adam Safir, “Gemini content team: final report,” Gemini content project paper (U.S. Bureau of Labor Statistics, February 2014).
14 Brett McBride, Erica Yu, Mik Slomka, Laura Erhard, and Jeanette Davis, “2012 research section analysis,” unpublished paper, 2012 CE research section analysis project (U.S. Bureau of Labor Statistics, December 2013); Brett McBride and Lucilla Tan, “Quantifying CHI doorstep concerns as risk factors of wave 1 nonresponse for the CE Interview Survey,” unpublished paper, CHI panel data analysis of survey burden project (U.S. Bureau of Labor Statistics, April 2014).
15 Erica Yu, “Asking questions about household member activities to improve expenditure reporting,” unpublished paper, proxy reporting lab study project (U.S. Bureau of Labor Statistics, September 2013).
16 Brandon Kopp, Brett McBride, and Lucilla Tan, “An exploratory study on the association of doorstep concerns with three survey quality measures for the CE Interview Survey” (U.S. Bureau of Labor Statistics, November 2013) and McBride and Tan, “Quantifying CHI doorstep concerns.”
17 Wendy Martinez and Lucilla Tan, “An exploratory text analysis project for the Consumer Expenditure Interview Survey,” unpublished paper, CE CHI text analysis project (U.S. Bureau of Labor Statistics, June 2015).
18 Daniel K. Yang, “Compiling respondent burden items: a composite index approach,” paper presented at the annual Consumer Expenditure Survey Methods Symposium, June 14, 2015, https://www.bls.gov/cex/respondent-burden-index.pdf.
19 Adam Safir and Lucilla Tan, “Towards Determining an Optimal Contact Attempt Threshold for a Large-Scale Personal Visit Survey,” paper presented at the American Association for Public Opinion Research annual conference, May 16, 2015.
20 Scott Fricker and Lucilla Tan, “A proposal for a preliminary framework for monitoring and reporting on data quality for the Consumer Expenditure Survey,” CE research library papers (U.S. Bureau of Labor Statistics, May 2012), https://www.bls.gov/cex/research_papers/pdf/cesrvmeth_quality.pdf.
21 Brandon Kopp, “The evolution of password requirements in the Consumer Expenditure Diary Survey,” paper presented at the FESAC annual conference, June 12, 2015.