
An official website of the United States government
An official website of the United States government
The .gov means it's official.
Federal government websites often end in .gov or .mil. Before sharing sensitive information,
make sure you're on a federal government site.
The site is secure.
The
https:// ensures that you are connecting to the official website and that any
information you provide is encrypted and transmitted securely.
The Occupational Employment and Wage Statistics (OEWS) program produces employment and wage estimates annually for approximately 830 occupations. These estimates are available for the nation as a whole, for individual states, and for metropolitan and nonmetropolitan areas; national occupational estimates for specific industries are also available.
04/03/2024
Office and administrative support occupations had employment of 18.5 million
and an annual mean wage of $47,940 in May 2023. Customer service representatives
(2.9 million) and general office clerks (2.5 million) were the largest office
and administrative support occupations.
HTML
|
PDF
|
RSS
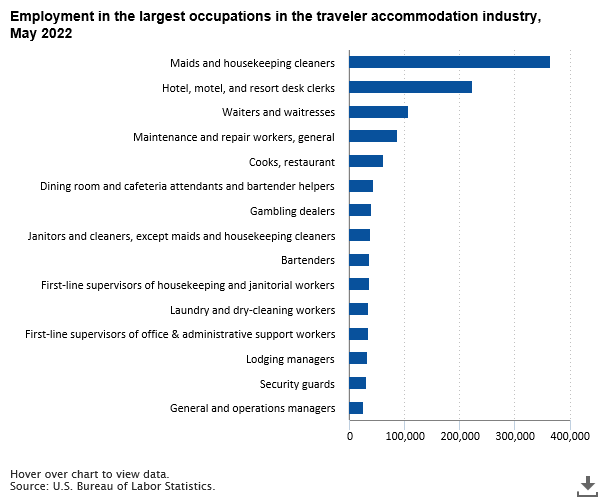
September 1 is National Hotel Employee Day, which recognizes the workers who keep the nation’s approximately 65,000 hotels, motels, and other lodging establishments running smoothly. As the summer travel season draws to a close, we examine some of the jobs found in the traveler accommodation industry. read more »

This is an overview of the employment composition and wages of the seven metropolitan areas with the highest population growth rates and the seven metropolitan areas with the lowest population growth rates or that have lost population using Occupational Employment and Wage Statistics data from the Bureau of Labor Statistics. read more »
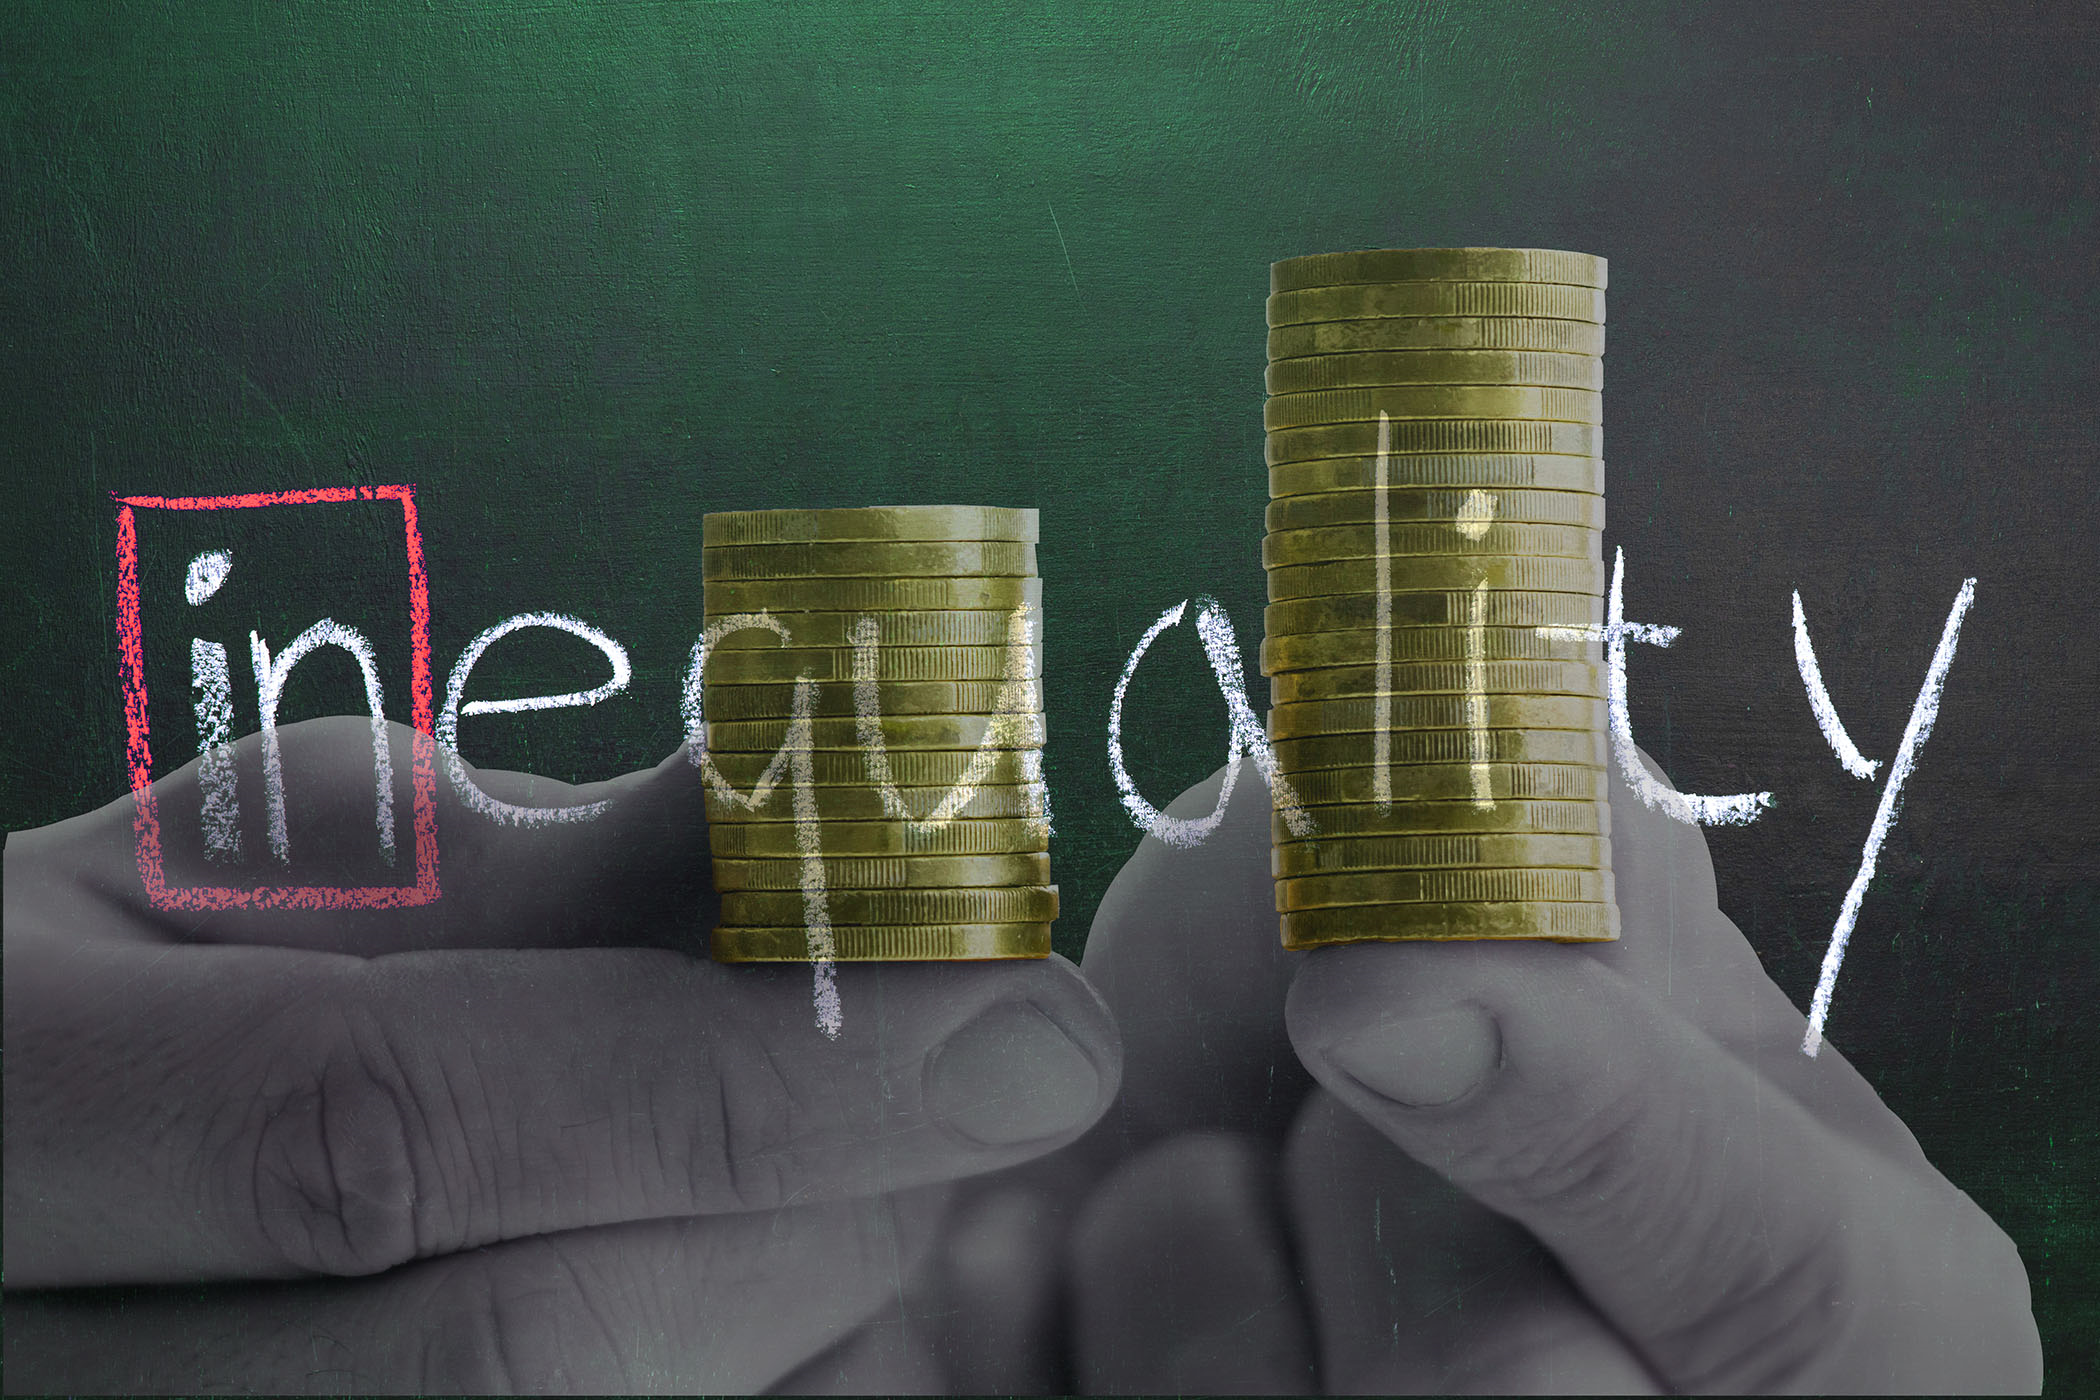
Wage inequality grew from 2003 to 2013 but either declined or plateaued from 2013 to 2019, depending on the data source, because wage growth was particularly strong among lower-wage workers. read more »

During the first year of the COVID-19 pandemic, job losses in large private sector industries such as food services and drinking places received a lot of attention. State and local government also had high job losses. From March 2020 to March 2021, employment fell by 5.1 percent in state government and 6.5 percent in local government, compared with a 4.3-percent decrease in the private sector. read more »
 Respondents homepage.