
An official website of the United States government
An official website of the United States government
The .gov means it's official.
Federal government websites often end in .gov or .mil. Before sharing sensitive information,
make sure you're on a federal government site.
The site is secure.
The
https:// ensures that you are connecting to the official website and that any
information you provide is encrypted and transmitted securely.
The Employment Cost Index (ECI) measures the change in the hourly labor cost to employers over time. The ECI uses a fixed “basket” of labor to produce a pure cost change, free from the effects of workers moving between occupations and industries and includes both the cost of wages and salaries and the cost of benefits.
Compensation in private industry and state and local government, 12-month percent change, not seasonally adjusted
Month
Private industry
Government
Mar 2006
2.6%
3.7%
June 2006
2.8%
3.8%
Sept 2006
3.0%
4.1%
Dec 2006
3.2%
4.1%
Mar 2007
3.2%
4.6%
June 2007
3.1%
4.8%
Sept 2007
3.1%
4.3%
Dec 2007
3.0%
4.1%
Mar 2008
3.2%
3.6%
June 2008
3.0%
3.5%
Sept 2008
2.8%
3.4%
Dec 2008
2.4%
3.0%
Mar 2009
1.9%
3.1%
June 2009
1.5%
3.1%
Sept 2009
1.2%
2.3%
Dec 2009
1.2%
2.3%
Mar 2010
1.6%
2.0%
June 2010
1.9%
1.7%
Sept 2010
2.0%
1.8%
Dec 2010
2.1%
1.8%
Mar 2011
2.0%
1.8%
June 2011
2.3%
1.7%
Sept 2011
2.1%
1.5%
Dec 2011
2.2%
1.3%
Mar 2012
2.1%
1.5%
June 2012
1.8%
1.6%
Sept 2012
1.9%
1.8%
Dec 2012
1.8%
1.9%
Mar 2013
1.9%
1.9%
June 2013
1.9%
1.8%
Sept 2013
1.9%
1.7%
Dec 2013
2.0%
1.9%
Mar 2014
1.7%
1.9%
June 2014
2.0%
2.0%
Sept 2014
2.3%
2.1%
Dec 2014
2.3%
2.0%
Mar 2015
2.8%
2.1%
June 2015
1.9%
2.2%
Sept 2015
1.9%
2.3%
Dec 2015
1.9%
2.5%
Mar 2016
1.8%
2.4%
June 2016
2.4%
2.3%
Sept 2016
2.3%
2.6%
Dec 2016
2.2%
2.4%
Mar 2017
2.3%
2.6%
June 2017
2.4%
2.6%
Sept 2017
2.5%
2.4%
Dec 2017
2.6%
2.5%
Mar 2018
2.8%
2.2%
June 2018
2.9%
2.3%
Sept 2018
2.9%
2.5%
Dec 2018
3.0%
2.6%
Mar 2019
2.8%
3.0%
June 2019
2.6%
3.0%
Sept 2019
2.7%
3.1%
Dec 2019
2.7%
2.9%
Mar 2020
2.8%
2.8%
June 2020
2.7%
2.7%
Sept 2020
2.4%
2.3%
Dec 2020
2.6%
2.3%
Mar 2021
2.8%
2.0%
June 2021
3.1%
2.0%
Sept 2021
4.1%
2.3%
Dec 2021
4.4%
2.6%
Mar 2022
4.8%
3.2%
June 2022
5.5%
3.4%
Sept 2022
5.2%
4.6%
Dec 2022
5.1%
4.8%
Mar 2023
4.8%
4.9%
June 2023
4.5%
4.9%
Sept 2023
4.3%
4.8%
Dec 2023
4.1%
4.6%
Civilian workers
0.9% in 4th Qtr of 2023
![]()
Private industry workers
0.9% in 4th Qtr of 2023
![]()
State and local government workers
1.0% in 4th Qtr of 2023
![]()
Civilian workers
4.2% in 4th Qtr of 2023
![]()
Private industry workers
4.1% in 4th Qtr of 2023
![]()
State and local government workers
4.6% in 4th Qtr of 2023
![]()
The Employment Cost Index, or ECI, measures changes in the cost of employees to employers over time. In the private sector, business owners and human resources professionals can use the ECI to make decisions about pay adjustments to help them stay competitive. In the public sector, the Federal Reserve and others use the ECI to gauge the health of the labor market, adjust contracts, and research the labor market. read more »
01/31/2024
Compensation costs increased 0.9 percent for civilian workers, seasonally adjusted, from September 2023 to December 2023. Over the year, total compensation rose 4.2 percent, wages and salaries rose 4.3 percent, and benefit costs rose 3.8 percent.
HTML
|
PDF
|
RSS
|
Charts

The implications of removing an item from the National Compensation Survey. read more »
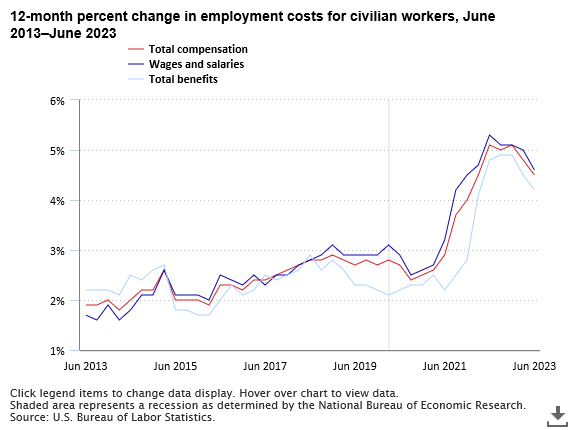
Compensation costs for civilian workers increased 4.5 percent for the 12 months ending June 2023, compared with an increase of 5.1 percent for the year ending in June 2022. read more »

In 2022, 10.1 percent of workers in the United States belonged to a union. This Spotlight on Statistics focuses on union membership, strike activity, and compensation in 2022. read more »