
An official website of the United States government
An official website of the United States government
The .gov means it's official.
Federal government websites often end in .gov or .mil. Before sharing sensitive information,
make sure you're on a federal government site.
The site is secure.
The
https:// ensures that you are connecting to the official website and that any
information you provide is encrypted and transmitted securely.
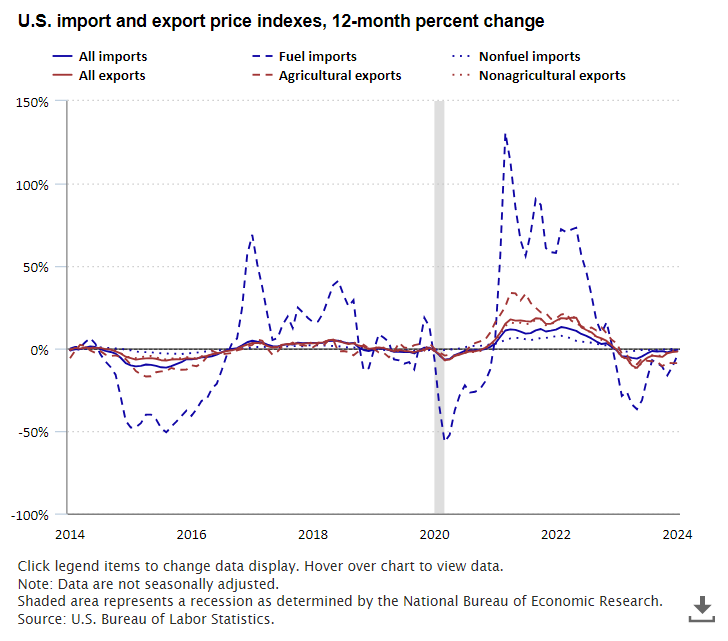
The International Price Program (IPP) produces Import/Export Price Indexes (MXP) containing data on changes in the prices of nonmilitary goods and services traded between the U.S. and the rest of the world.
U.S. import and export price indexes, 12-month percent change
Month
All imports
Fuel imports
Nonfuel imports
All exports
Agricultural exports
Nonagricultural exports
Mar 2004
1.1%
-4.0%
2.1%
3.3%
20.7%
1.8%
Apr 2004
4.6%
21.5%
2.4%
4.1%
23.3%
2.4%
May 2004
6.9%
38.0%
2.8%
4.4%
20.9%
2.9%
June 2004
5.7%
30.5%
2.4%
3.9%
15.8%
2.8%
July 2004
5.6%
28.2%
2.3%
4.5%
14.7%
3.7%
Aug 2004
7.1%
37.6%
2.8%
4.0%
6.2%
3.9%
Sept 2004
8.2%
47.1%
2.8%
4.0%
2.5%
4.3%
Oct 2004
9.9%
60.6%
2.7%
4.4%
-1.0%
5.0%
Nov 2004
9.0%
53.9%
2.6%
4.2%
-4.5%
5.2%
Dec 2004
6.7%
31.5%
3.0%
4.0%
-5.9%
5.0%
Jan 2005
5.7%
22.3%
3.0%
4.0%
-6.0%
5.1%
Feb 2005
6.1%
26.5%
2.7%
3.4%
-7.8%
4.6%
Mar 2005
7.6%
37.8%
2.5%
3.3%
-7.6%
4.5%
Apr 2005
8.4%
43.4%
2.4%
3.1%
-9.5%
4.5%
May 2005
5.9%
26.6%
2.0%
2.5%
-8.2%
3.7%
June 2005
7.4%
36.0%
2.1%
3.2%
-2.7%
3.8%
July 2005
8.2%
43.5%
1.8%
2.8%
-1.7%
3.2%
Aug 2005
8.2%
42.7%
1.3%
3.1%
6.7%
2.8%
Sept 2005
9.9%
51.9%
1.4%
3.6%
3.3%
3.6%
Oct 2005
8.2%
37.7%
1.6%
3.7%
4.8%
3.6%
Nov 2005
6.4%
30.0%
1.4%
2.8%
4.2%
2.6%
Dec 2005
8.0%
43.5%
1.1%
2.8%
4.9%
2.6%
Jan 2006
8.7%
48.6%
0.9%
2.7%
4.8%
2.6%
Feb 2006
6.9%
37.4%
0.8%
2.7%
4.6%
2.7%
Mar 2006
4.5%
21.7%
0.7%
2.3%
0.7%
2.5%
Apr 2006
5.8%
27.8%
0.6%
2.5%
-0.1%
2.6%
May 2006
8.6%
41.0%
1.5%
3.5%
-1.5%
3.9%
June 2006
7.4%
29.3%
2.2%
4.2%
0.2%
4.6%
July 2006
7.0%
24.3%
2.5%
4.5%
2.1%
4.7%
Aug 2006
6.0%
17.7%
2.9%
5.2%
3.7%
5.3%
Sept 2006
1.6%
-2.6%
2.9%
3.9%
4.6%
3.8%
Oct 2006
-1.0%
-13.2%
2.6%
2.9%
5.3%
2.6%
Nov 2006
1.3%
-4.2%
2.8%
3.9%
10.3%
3.4%
Dec 2006
2.5%
0.9%
2.9%
4.5%
13.5%
3.7%
Jan 2007
0.0%
-10.2%
2.8%
4.1%
13.5%
3.3%
Feb 2007
1.2%
-4.6%
2.5%
4.9%
17.5%
3.8%
Mar 2007
2.8%
4.0%
2.6%
5.4%
20.1%
4.3%
Apr 2007
2.1%
0.5%
2.7%
5.1%
18.9%
4.0%
May 2007
1.2%
-2.4%
2.4%
4.6%
18.1%
3.6%
June 2007
2.3%
3.5%
2.1%
4.3%
18.2%
3.2%
July 2007
2.8%
5.1%
2.4%
4.0%
17.8%
2.9%
Aug 2007
1.9%
1.3%
2.4%
3.7%
17.9%
2.5%
Sept 2007
4.8%
15.6%
2.1%
4.5%
23.4%
2.9%
Oct 2007
9.1%
36.5%
2.7%
5.6%
26.8%
3.9%
Nov 2007
12.0%
50.8%
3.0%
6.2%
23.0%
4.7%
Dec 2007
10.6%
42.1%
3.1%
6.0%
23.3%
4.5%
Jan 2008
13.6%
58.8%
3.5%
6.8%
28.5%
4.9%
Feb 2008
13.5%
54.6%
4.3%
6.9%
30.7%
4.8%
Mar 2008
15.2%
57.0%
5.1%
7.9%
34.0%
5.5%
Apr 2008
16.9%
59.7%
6.0%
8.0%
33.3%
5.7%
May 2008
19.1%
70.2%
6.0%
8.1%
33.6%
5.7%
June 2008
21.3%
77.9%
6.4%
8.7%
33.1%
6.5%
July 2008
21.4%
75.2%
6.7%
10.2%
39.7%
7.6%
Aug 2008
18.1%
60.7%
6.6%
8.3%
25.0%
6.8%
Sept 2008
13.1%
38.5%
6.1%
7.0%
20.1%
5.8%
Oct 2008
4.9%
4.5%
4.8%
4.0%
6.0%
3.8%
Nov 2008
-5.9%
-32.9%
2.6%
-0.3%
-2.7%
0.0%
Dec 2008
-10.1%
-47.0%
1.2%
-2.9%
-10.9%
-2.2%
Jan 2009
-12.5%
-51.4%
-0.3%
-3.4%
-10.0%
-2.7%
Feb 2009
-12.7%
-49.8%
-1.2%
-4.5%
-15.4%
-3.4%
Mar 2009
-14.9%
-50.7%
-2.8%
-6.7%
-22.0%
-5.0%
Apr 2009
-16.4%
-50.8%
-3.8%
-6.7%
-17.5%
-5.4%
May 2009
-17.3%
-50.7%
-4.1%
-6.6%
-14.7%
-5.6%
June 2009
-17.5%
-47.6%
-4.5%
-6.6%
-13.1%
-5.9%
July 2009
-19.1%
-50.6%
-5.3%
-8.3%
-22.5%
-6.6%
Aug 2009
-15.3%
-41.0%
-5.1%
-6.2%
-14.1%
-5.3%
Sept 2009
-12.0%
-34.0%
-4.2%
-5.6%
-16.7%
-4.4%
Oct 2009
-5.6%
-14.2%
-3.1%
-3.6%
-9.7%
-2.9%
Nov 2009
3.4%
26.4%
-1.1%
0.4%
0.7%
0.3%
Dec 2009
8.6%
62.2%
0.3%
3.4%
9.2%
2.9%
Jan 2010
11.4%
77.8%
1.3%
3.5%
4.4%
3.3%
Feb 2010
11.3%
72.0%
1.9%
3.4%
2.0%
3.6%
Mar 2010
11.2%
61.7%
2.7%
4.9%
7.7%
4.6%
Apr 2010
11.2%
54.4%
3.2%
5.5%
3.5%
5.7%
May 2010
8.5%
33.5%
3.5%
5.6%
1.5%
5.8%
June 2010
4.3%
10.7%
2.9%
3.7%
-2.6%
4.4%
July 2010
4.9%
14.7%
2.8%
3.9%
2.3%
4.1%
Aug 2010
3.8%
8.4%
2.7%
4.1%
6.4%
3.9%
Sept 2010
3.6%
8.1%
2.5%
4.9%
12.2%
4.3%
Oct 2010
3.9%
9.5%
2.5%
5.8%
16.2%
4.8%
Nov 2010
4.1%
8.0%
3.0%
6.5%
20.3%
5.1%
Dec 2010
5.3%
14.2%
3.0%
6.5%
20.5%
5.1%
Jan 2011
5.6%
13.9%
3.4%
7.0%
22.7%
5.4%
Feb 2011
7.6%
21.1%
3.8%
8.7%
33.6%
6.3%
Mar 2011
10.3%
31.0%
4.4%
9.5%
34.0%
7.1%
Apr 2011
11.9%
37.3%
4.6%
9.2%
33.9%
6.8%
May 2011
12.9%
43.7%
4.5%
9.1%
30.4%
7.0%
June 2011
13.6%
46.1%
5.0%
10.1%
31.4%
8.0%
July 2011
13.7%
44.8%
5.4%
9.8%
26.4%
8.2%
Aug 2011
12.9%
40.3%
5.4%
9.4%
23.2%
8.0%
Sept 2011
12.7%
40.9%
5.4%
9.4%
22.7%
7.9%
Oct 2011
11.1%
34.3%
4.8%
6.3%
11.5%
5.8%
Nov 2011
10.1%
32.4%
3.7%
4.8%
5.4%
4.8%
Dec 2011
8.5%
24.9%
3.4%
3.6%
1.0%
4.0%
Jan 2012
6.9%
19.8%
2.9%
2.6%
-0.9%
3.2%
Feb 2012
5.1%
13.4%
2.4%
1.8%
-5.7%
2.8%
Mar 2012
3.5%
7.9%
2.0%
1.1%
-5.4%
1.9%
Apr 2012
0.8%
-0.5%
1.3%
0.7%
-3.1%
1.2%
May 2012
-0.8%
-5.5%
0.9%
-0.2%
-1.6%
0.0%
June 2012
-2.5%
-11.5%
0.6%
-2.1%
-5.8%
-1.6%
July 2012
-3.3%
-13.4%
0.0%
-1.3%
3.9%
-1.9%
Aug 2012
-1.8%
-6.1%
-0.4%
-0.9%
7.1%
-1.9%
Sept 2012
-0.6%
-1.5%
-0.4%
-0.6%
6.4%
-1.5%
Oct 2012
0.0%
-0.8%
0.1%
1.5%
11.9%
0.2%
Nov 2012
-1.4%
-6.2%
0.2%
0.8%
10.6%
-0.3%
Dec 2012
-2.0%
-7.9%
0.0%
1.1%
13.4%
-0.3%
Jan 2013
-1.5%
-6.0%
0.0%
1.2%
10.7%
0.0%
Feb 2013
-0.6%
-2.5%
0.1%
1.5%
13.4%
0.0%
Mar 2013
-2.1%
-6.6%
-0.4%
0.2%
8.7%
-0.8%
Apr 2013
-2.7%
-8.1%
-0.7%
-0.8%
4.3%
-1.5%
May 2013
-1.8%
-4.3%
-1.1%
-0.8%
5.0%
-1.6%
June 2013
0.1%
3.8%
-1.0%
0.8%
9.6%
-0.2%
July 2013
0.9%
7.7%
-1.0%
0.3%
3.1%
-0.2%
Aug 2013
0.0%
4.1%
-1.0%
-1.1%
-5.6%
-0.6%
Sept 2013
-0.7%
1.2%
-1.2%
-1.6%
-6.3%
-0.9%
Oct 2013
-1.6%
-2.2%
-1.3%
-2.2%
-5.9%
-1.7%
Nov 2013
-1.8%
-4.1%
-1.2%
-1.5%
-6.6%
-0.9%
Dec 2013
-1.1%
-1.2%
-1.2%
-1.0%
-6.4%
-0.4%
Jan 2014
-1.3%
-2.2%
-1.1%
-1.0%
-5.3%
-0.5%
Feb 2014
-1.1%
-0.1%
-1.2%
-1.0%
-5.9%
-0.5%
Mar 2014
-0.5%
1.0%
-0.7%
0.4%
-1.4%
0.5%
Apr 2014
-0.4%
0.8%
-0.6%
-0.1%
2.2%
-0.2%
May 2014
0.5%
3.8%
-0.2%
0.6%
1.4%
0.5%
June 2014
1.2%
6.2%
0.0%
0.2%
-1.2%
0.3%
July 2014
0.9%
2.9%
0.5%
0.4%
-2.7%
0.7%
Aug 2014
-0.3%
-3.5%
0.7%
0.4%
-1.6%
0.5%
Sept 2014
-1.4%
-7.9%
0.4%
-0.4%
-3.7%
-0.1%
Oct 2014
-2.1%
-11.2%
0.3%
-0.7%
-4.6%
-0.3%
Nov 2014
-3.1%
-15.9%
0.0%
-1.7%
-4.2%
-1.4%
Dec 2014
-5.6%
-29.1%
0.0%
-3.0%
-5.2%
-2.8%
Jan 2015
-8.9%
-43.8%
-0.9%
-5.0%
-6.4%
-4.9%
Feb 2015
-10.2%
-47.9%
-1.1%
-5.8%
-9.7%
-5.3%
Mar 2015
-10.8%
-47.7%
-1.8%
-6.7%
-13.7%
-5.8%
Apr 2015
-10.5%
-45.3%
-2.2%
-6.3%
-15.7%
-5.3%
May 2015
-9.7%
-40.1%
-2.2%
-6.0%
-17.0%
-4.7%
June 2015
-9.9%
-40.1%
-2.3%
-5.8%
-16.8%
-4.5%
July 2015
-10.5%
-42.9%
-2.6%
-6.2%
-14.4%
-5.3%
Aug 2015
-11.4%
-48.2%
-2.9%
-7.1%
-13.9%
-6.3%
Sept 2015
-11.6%
-50.8%
-3.0%
-7.3%
-13.8%
-6.6%
Oct 2015
-10.7%
-47.4%
-3.2%
-6.7%
-11.8%
-6.1%
Nov 2015
-9.5%
-44.3%
-3.2%
-6.5%
-12.7%
-5.8%
Dec 2015
-8.3%
-41.0%
-3.4%
-6.6%
-12.9%
-5.9%
Jan 2016
-6.5%
-37.7%
-2.9%
-5.9%
-12.8%
-5.1%
Feb 2016
-6.6%
-40.8%
-2.8%
-6.1%
-10.2%
-5.8%
Mar 2016
-6.1%
-36.7%
-2.5%
-6.2%
-10.7%
-5.8%
Apr 2016
-5.3%
-31.7%
-2.0%
-5.1%
-9.1%
-4.7%
May 2016
-5.2%
-30.6%
-1.8%
-4.5%
-5.2%
-4.4%
June 2016
-4.7%
-24.5%
-1.8%
-3.5%
-1.3%
-3.8%
July 2016
-3.7%
-21.3%
-1.2%
-3.0%
-2.6%
-3.0%
Aug 2016
-2.2%
-12.9%
-0.9%
-2.4%
-3.5%
-2.3%
Sept 2016
-1.1%
-3.7%
-0.6%
-1.5%
-3.1%
-1.3%
Oct 2016
-0.2%
3.1%
-0.3%
-1.1%
-2.7%
-0.8%
Nov 2016
0.2%
6.1%
-0.2%
-0.2%
-1.1%
-0.2%
Dec 2016
1.9%
24.7%
0.2%
1.3%
-0.3%
1.4%
Jan 2017
3.8%
56.9%
0.2%
2.4%
1.3%
2.4%
Feb 2017
4.7%
68.9%
0.6%
3.2%
2.1%
3.3%
Mar 2017
4.1%
50.9%
0.9%
3.4%
5.4%
3.2%
Apr 2017
3.6%
36.9%
1.0%
3.1%
4.6%
3.0%
May 2017
2.3%
20.4%
0.9%
1.4%
-0.1%
1.6%
June 2017
1.4%
5.1%
1.1%
0.6%
-3.8%
1.0%
July 2017
1.2%
6.3%
0.7%
0.9%
-1.8%
1.1%
Aug 2017
2.0%
14.4%
1.0%
2.3%
1.7%
2.4%
Sept 2017
2.7%
19.4%
1.3%
2.8%
2.1%
2.8%
Oct 2017
2.4%
12.4%
1.4%
2.7%
3.6%
2.6%
Nov 2017
3.5%
24.8%
1.5%
3.1%
2.1%
3.3%
Dec 2017
3.2%
21.8%
1.3%
2.8%
1.9%
2.8%
Jan 2018
3.4%
18.5%
1.9%
3.3%
1.5%
3.5%
Feb 2018
3.3%
16.0%
2.0%
3.1%
0.7%
3.4%
Mar 2018
3.3%
16.4%
1.9%
3.4%
2.8%
3.5%
Apr 2018
3.5%
21.5%
1.7%
3.7%
1.6%
3.9%
May 2018
4.5%
30.1%
1.8%
5.0%
4.8%
4.9%
June 2018
4.7%
38.5%
1.5%
5.3%
5.3%
5.3%
July 2018
4.8%
41.0%
1.4%
4.3%
-1.9%
5.0%
Aug 2018
3.8%
32.7%
0.9%
3.6%
-1.5%
4.1%
Sept 2018
3.1%
25.6%
0.6%
2.7%
-2.1%
3.3%
Oct 2018
3.4%
29.3%
0.6%
3.1%
-4.1%
3.9%
Nov 2018
0.7%
3.5%
0.4%
1.8%
-1.7%
2.2%
Dec 2018
-0.9%
-13.1%
0.6%
1.1%
2.3%
1.0%
Jan 2019
-1.5%
-12.0%
-0.2%
-0.2%
0.1%
-0.2%
Feb 2019
-0.7%
-1.2%
-0.5%
0.2%
-0.3%
0.3%
Mar 2019
0.1%
8.7%
-0.8%
0.6%
-2.4%
0.9%
Apr 2019
-0.2%
6.5%
-0.9%
0.2%
-2.7%
0.5%
May 2019
-0.9%
3.9%
-1.4%
-0.9%
-5.3%
-0.3%
June 2019
-2.0%
-6.6%
-1.4%
-1.6%
-2.0%
-1.5%
July 2019
-2.0%
-7.2%
-1.2%
-0.9%
3.5%
-1.5%
Aug 2019
-2.1%
-9.2%
-1.1%
-1.4%
0.6%
-1.6%
Sept 2019
-2.1%
-8.3%
-1.2%
-1.7%
0.2%
-1.9%
Oct 2019
-3.0%
-12.7%
-1.5%
-2.2%
2.0%
-2.7%
Nov 2019
-1.2%
1.6%
-1.4%
-1.3%
2.7%
-1.7%
Dec 2019
0.5%
18.6%
-1.4%
-0.9%
-1.2%
-0.8%
Jan 2020
0.5%
13.2%
-0.9%
0.4%
3.1%
0.2%
Feb 2020
-1.3%
-6.6%
-0.8%
-1.4%
-0.1%
-1.6%
Mar 2020
-4.2%
-36.0%
-0.6%
-3.5%
-2.4%
-3.7%
Apr 2020
-6.8%
-56.6%
-1.0%
-7.0%
-4.3%
-7.2%
May 2020
-6.3%
-52.3%
-0.7%
-6.7%
-3.7%
-7.0%
June 2020
-4.0%
-37.5%
-0.2%
-4.5%
-4.5%
-4.5%
July 2020
-2.8%
-28.2%
0.0%
-3.7%
-3.1%
-3.8%
Aug 2020
-1.4%
-22.3%
0.8%
-2.7%
-2.9%
-2.6%
Sept 2020
-1.3%
-26.7%
1.4%
-1.8%
1.4%
-2.2%
Oct 2020
-1.0%
-26.2%
1.6%
-1.7%
3.2%
-2.1%
Nov 2020
-1.0%
-24.6%
1.6%
-1.0%
4.3%
-1.6%
Dec 2020
-0.3%
-20.1%
1.9%
0.4%
5.4%
-0.1%
Jan 2021
1.0%
-12.8%
2.6%
2.5%
9.6%
1.6%
Feb 2021
3.0%
6.4%
2.8%
5.4%
15.9%
4.3%
Mar 2021
7.1%
56.4%
3.8%
9.6%
20.4%
8.4%
Apr 2021
10.9%
130.7%
5.2%
15.0%
25.5%
13.7%
May 2021
11.6%
113.1%
6.1%
17.6%
33.7%
15.8%
June 2021
11.3%
85.3%
6.5%
16.9%
33.4%
15.1%
July 2021
10.2%
65.6%
6.3%
17.0%
29.1%
15.6%
Aug 2021
9.0%
56.1%
5.6%
16.6%
33.2%
14.8%
Sept 2021
9.3%
69.8%
5.1%
16.3%
27.6%
15.1%
Oct 2021
11.0%
90.6%
5.6%
18.3%
24.7%
17.6%
Nov 2021
11.8%
87.0%
6.4%
18.1%
21.9%
17.7%
Dec 2021
10.3%
60.9%
6.4%
14.9%
21.5%
14.1%
Jan 2022
10.8%
58.4%
7.0%
15.0%
18.0%
14.6%
Feb 2022
11.4%
57.9%
7.4%
16.8%
18.2%
16.6%
Mar 2022
13.0%
72.3%
7.7%
18.4%
20.6%
18.1%
Apr 2022
12.5%
70.6%
7.2%
18.2%
21.2%
17.8%
May 2022
11.6%
72.0%
5.9%
18.6%
16.9%
18.9%
June 2022
10.7%
73.2%
4.6%
18.6%
15.3%
19.0%
July 2022
8.8%
56.6%
4.1%
12.9%
13.6%
12.9%
Aug 2022
7.7%
46.4%
3.9%
11.2%
12.0%
11.1%
Sept 2022
6.1%
32.5%
3.5%
9.8%
12.7%
9.5%
Oct 2022
4.2%
16.7%
2.9%
7.2%
10.9%
6.8%
Nov 2022
2.7%
9.4%
2.0%
6.1%
12.8%
5.2%
Dec 2022
3.2%
15.9%
1.9%
4.6%
9.3%
3.9%
Jan 2023
0.9%
2.7%
0.6%
2.0%
5.3%
1.5%
Feb 2023
-1.1%
-12.3%
0.2%
-0.8%
3.1%
-1.4%
Mar 2023
-4.7%
-28.8%
-1.5%
-5.0%
-3.1%
-5.2%
Apr 2023
-4.9%
-26.2%
-1.9%
-6.0%
-3.9%
-6.3%
May 2023
-5.7%
-33.9%
-1.6%
-10.3%
-8.3%
-10.7%
June 2023
-6.1%
-36.8%
-1.3%
-11.8%
-9.6%
-12.2%
July 2023
-4.8%
-31.3%
-0.9%
-8.1%
-6.1%
-8.4%
Aug 2023
-3.0%
-18.2%
-0.9%
-5.7%
-7.4%
-5.6%
Sept 2023
-1.5%
-7.1%
-0.8%
-4.3%
-7.7%
-4.1%
Oct 2023
-1.8%
-8.8%
-0.9%
-4.7%
-8.1%
-4.4%
Nov 2023
-1.6%
-11.1%
-0.5%
-5.1%
-10.7%
-4.4%
Dec 2023
-2.4%
-16.3%
-0.8%
-2.9%
-8.7%
-2.1%
Jan 2024
-1.3%
-10.8%
-0.3%
-2.3%
-9.0%
-1.5%
Feb 2024
-0.9%
-4.3%
-0.5%
-2.0%
-9.1%
-1.2%
Mar 2024
0.4%
4.8%
0.0%
-1.4%
-8.1%
-0.6%
All Commodities:
+0.4% in Mar 2024
![]()
Fuels & Lubricants:
+4.7% in Mar 2024
![]()
All Imports Excluding Fuels:
+0.1% in Mar 2024
![]()
All Commodities:
+0.3% in Mar 2024
![]()
Agricultural Commodities:
-0.7% in Mar 2024
![]()
Nonagricultural Commodities:
+0.4% in Mar 2024
![]()
04/12/2024
Prices for U.S. imports advanced 0.4 percent in March following an increase of 0.3
percent in February. U.S. export prices rose 0.3 percent in March, after a 0.7-percent
advance the previous month. Over the past year, import prices rose 0.4 percent and export
prices declined 1.4 percent.
HTML
|
PDF
|
RSS
|
Charts
Prices for U.S. imports decreased 0.8 percent from February 2023 to February 2024 while U.S. export prices declined 1.8 percent. This was the smallest 12-month export price drop since the index decreased 0.8 percent from February 2022 to February 2023. read more »

Americans drink more coffee each day than any other beverage—including tap water. Since January 2021, U.S. coffee importers have faced an escalating cost for the hot commodity. Import prices increased just over 65 percent in less than 2 years. The following Beyond the Numbers article explains the reasons import prices for coffee have increased and discusses global supply issues that have arisen in the top coffee-supplying countries to the U.S. read more »
 Respondents homepage