
An official website of the United States government
An official website of the United States government
The .gov means it's official.
Federal government websites often end in .gov or .mil. Before sharing sensitive information,
make sure you're on a federal government site.
The site is secure.
The
https:// ensures that you are connecting to the official website and that any
information you provide is encrypted and transmitted securely.
Data from the Bureau of Labor Statistics’ Consumer Expenditure Survey (CE) show that cellular phone expenditures increased rapidly from 2001 through 2007. Cellular phone expenditures surpassed spending on residential landline phone services beginning in 2007. Chart 1 shows that annual expenditures for cellular phone services per consumer unit increased from $210 in 2001 to $608 in 2007, an increase of 190 percent. Expenditures for residential phone services per consumer unit decreased from $686 to $482 over that period, a decrease of 30 percent.
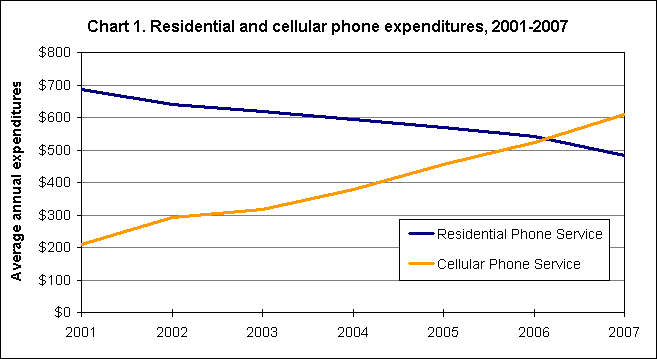
In 2001, the ratio of spending on residential phone services to spending on cellular phone services was greater than 3 to 1. In 2007, cellular phone expenditures accounted for 55 percent of total telephone expenditures compared to 43 percent for residential phone expenditures.
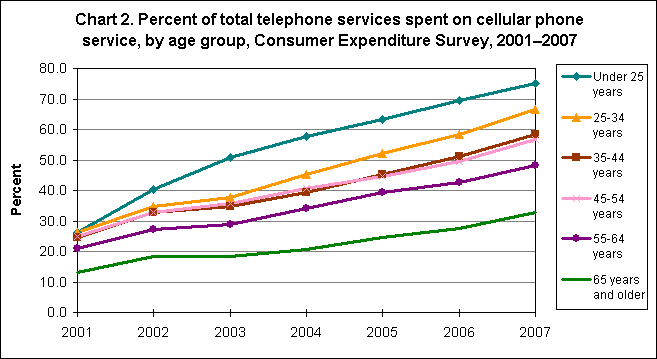
The distribution of telephone service expenditures between residential telephone/pay phone services and cellular phone services changed significantly in all age groups since 2001. For example, in 2001, the share of total telephone services spent on cellular phone service for consumer units whose reference person was under 25 years was 26 percent. (The reference person is one of the people in the consumer unit who owns or rents the unit's home.) By 2007, the share had risen sharply, to 75 percent. Similar, but less dramatic, shifts occurred for all other age groups. For the 25 to 34 years age group, the cell phone share was 26 percent in 2001; in 2007 it was 67 percent. The cell phone share for the 35 to 44 age group increased from 25 percent in 2001 to 59 percent in 2007. In the 45 to 54 age group, the share was 25 percent in 2001 compared to 57 percent in 2007. Although the shift in expenditures was not as great for consumer units with a reference person aged 65 years or older, even that age group saw a significant increase in its cellular phone service expenditures. Between 2001 and 2007, cellular phone services rose from 13 percent to 33 percent of total phone services for that group.
Chart 2 shows the shift in expenditures towards cellular phone service by age group. In 2007, for all age groups under age 55, cellular phone expenditures constituted more than half of total telephone expenditures. The situation differed from that of 2001, when the majority of total telephone expenditures for all age groups were residential telephone/pay phone service expenditures. In 2003, the under-25 age group was the first age group for whom spending on cellular phones accounted for the majority of total telephone expenditures. Those aged 25 to 34 years followed suit in 2005, those aged 35 to 44 years shifted in 2006, and those aged 45 to 54 shifted in 2007. The cell phone share of the 55 to 64 age group was just below the 50 percent level in 2007.
Data on cellular and residential telephones are unpublished components of telephone expenditures from the Consumer Expenditure Survey. Data for 2007 were released on November 25, 2008. Learn more in “Consumer Expenditures in 2007,” news release USDL 08-1746 on the Internet at https://www.bls.gov/news.release/cesan.nr0.htm. For more information, contact the CE program by email or call (202) 691-6900.
| 2001 | 2002 | 2003 | 2004 | 2005 | 2006 | 2007 | |
|---|---|---|---|---|---|---|---|
Telephone services | $914 | $957 | $956 | $990 | $1,048 | $1,087 | $1,110 |
Residential telephone/pay phone | 686 | 641 | 620 | 592 | 570 | 542 | 482 |
Cellular phone service | 210 | 294 | 316 | 378 | 455 | 524 | 608 |
Other services (phone cards, pager services, and, | 19 | 22 | 20 | 20 | 23 | 21 | 20 |
| 2001 | 2002 | 2003 | 2004 | 2005 | 2006 | 2007 | |
|---|---|---|---|---|---|---|---|
Telephone services | 100.0 | 100.0 | 100.0 | 100.0 | 100.0 | 100.0 | 100.0 |
Residential telephone/pay phone | 75.0 | 67.0 | 64.8 | 59.8 | 54.4 | 49.9 | 43.4 |
Cellular phone service | 23.0 | 30.7 | 33.1 | 38.2 | 43.4 | 48.2 | 54.8 |
Other services (phone cards, pager services, and, | 2.0 | 2.3 | 2.1 | 2.0 | 2.2 | 2.0 | 1.8 |
| 2001 | 2002 | 2003 | 2004 | 2005 | 2006 | 2007 | |
|---|---|---|---|---|---|---|---|
Under 25 years | 26.3 | 40.4 | 50.9 | 57.8 | 63.4 | 69.5 | 75.2 |
25-34 years | 26.3 | 34.9 | 37.6 | 45.2 | 52.0 | 58.3 | 66.5 |
35-44 years | 24.6 | 32.7 | 34.6 | 39.4 | 45.1 | 51.1 | 58.5 |
45-54 years | 25.0 | 32.9 | 35.7 | 40.7 | 44.6 | 49.4 | 56.6 |
55-64 years | 21.0 | 27.1 | 29.0 | 34.0 | 39.2 | 42.7 | 48.1 |
65 years and older | 13.1 | 18.2 | 18.2 | 20.8 | 24.6 | 27.7 | 32.8 |
Last Modified Date: January 14, 2009